

Significance
In recent years an extensive effort has been made to elucidate the molecular pathways involved in metabolic signaling. Our study shows, surprisingly, a direct link between metabolic regulation and the heat-shock response, a highly conserved transcriptional program that is activated in the presence of various environmental stresses. Specifically, we demonstrate that peroxisome proliferator-activated receptor γ coactivator 1α, a critical and well-established inducible transcriptional coactivator of metabolic genes, acts as a direct transcriptional repressor of heat-shock factor 1, a key regulator of the heat-shock/stress response and a factor more recently demonstrated to be necessary for cancer initiation and survival. Thus, our findings have possible implications both for our understanding of the full scope of metabolically regulated target genes in vivo and, conceivably, for therapeutics.
Keywords: metabolism, transcription, stress response
Abstract
In recent years an extensive effort has been made to elucidate the molecular pathways involved in metabolic signaling in health and disease. Here we show, surprisingly, that metabolic regulation and the heat-shock/stress response are directly linked. Peroxisome proliferator-activated receptor γ coactivator 1α (PGC-1α), a critical transcriptional coactivator of metabolic genes, acts as a direct transcriptional repressor of heat-shock factor 1 (HSF1), a key regulator of the heat-shock/stress response. Our findings reveal that heat-shock protein (HSP) gene expression is suppressed during fasting in mouse liver and in primary hepatocytes dependent on PGC-1α. HSF1 and PGC-1α associate physically and are colocalized on several HSP promoters. These observations are extended to several cancer cell lines in which PGC-1α is shown to repress the ability of HSF1 to activate gene-expression programs necessary for cancer survival. Our study reveals a surprising direct link between two major cellular transcriptional networks, highlighting a previously unrecognized facet of the activity of the central metabolic regulator PGC-1α beyond its well-established ability to boost metabolic genes via its interactions with nuclear hormone receptors and nuclear respiratory factors. Our data point to PGC-1α as a critical repressor of HSF1-mediated transcriptional programs, a finding with possible implications both for our understanding of the full scope of metabolically regulated target genes in vivo and, conceivably, for therapeutics.
The cellular response to metabolic demands and stimuli involves a complex network of transcription factors and coactivators that regulate the timely expression of a diverse array of target genes. Peroxisome proliferator-activated receptor γ coactivator 1α (PGC-1α) is a key metabolic transcriptional coactivator protein that associates with numerous transcription factors and increases their ability to induce expression of their cognate target genes (1, 2). A key attribute of PGC-1α is its ability to enhance oxidative metabolism and mitochondrial biogenesis (3). PGC-1α also can induce tissue-specific programs such as hepatic gluconeogenesis (4), thermogenesis in brown adipose tissue (BAT) (5), and fiber-type switching in skeletal muscle (6). PGC-1α is induced by a variety of physiological stimuli in the tissues where it acts, including exercise in muscle, cold in BAT, and fasting or diabetes in the liver (1, 2). Mechanistically, PGC-1α induces gene expression via a strong transcriptional activation domain at its N terminus. This domain interacts with several lysine acetyltransferase complexes that include p300, CBP, and SRC-1 (7). The ability of PGC-1α to coactivate nuclear hormone receptors depends on two N-terminal LXXLL motifs, designated L2 and L3, that mediate the interaction of PGC-1α with these transcription factors (8, 9). However, PGC-1α also was described as a coactivator of several nonnuclear hormone receptor transcription factors that include NRF1 and NRF2 (3). Although these interactions were demonstrated to regulate the expression of numerous transcriptional programs, the full scope of PGC-1α binding partners and regulated targets is not fully elucidated.
A critical aspect of cellular protein homeostasis is the utilization of chaperone proteins responsible for correctly folding proteins and for stabilizing protein structure (10, 11). Chaperone proteins include heat-shock proteins (HSPs) within the HSP27, HSP40, HSP70, and HSP90 families as well as α-crystallin and class I and class II chaperonins. These proteins are part of the cellular heat-shock response (HSR), the cellular response to proteotoxic stimuli such as elevated temperatures and oxidative stress (10, 11). This response is controlled by the heat-shock factor (HSF) family of transcription factors (12) and in particular by HSF1, which is conserved from yeast to humans (13). Although HSF1 has long been known to bind to and activate promoters of various HSP genes as part of the HSR, it has been described more recently as a regulator of many additional transcriptional programs that include those controlling cell survival, ion transport, signal transduction, and other cellular processes (12, 14, 15). Consistent with its versatile functions in the regulation of numerous transcriptional programs, HSF1 also has been implicated in certain pathological conditions that include neurodegeneration and cancer (16, 17). Although HSF1 may not be strictly required for normal cellular or organismal survival in mammals (18), the role of HSF1 in regulating non-HSR targets, including those related to DNA damage repair and the cell cycle, recently has emerged as critical for cancer cell survival (19–21). Thus, inhibiting the activity of HSF1 has been suggested as a potential anticancer therapeutic approach (22).
Although the HSPs are the products of genes activated by HSF1, they also have been reported to inhibit HSF1 in a negative feedback loop (23). For example, HSP70 and HSP40 interactions with HSF1 have been shown to inhibit its transactivation capacity, although the inhibitory mechanism is still unknown (24). Thus, the exact mechanisms and physiological stimuli that regulate HSF1 remain incompletely understood.
Here we show that PGC-1α is a direct binding partner of HSF1 and acts to repress its transcriptional activity. Using a variety of cell types, as well as mice, we demonstrate the repressive effects of PGC-1α on HSF1 in hepatocytes and in muscle. Although there are a number of PGC-1α isoforms (25), our studies are focused on PGC-1α1, the coactivator variant with the best-established effects on cellular bioenergetics. Although initially focusing on HSP genes as targets of PGC-1α activity, we extend our observations to genes from additional transcriptional programs controlled by HSF1 in cancer cells and show that PGC-1α can associate with the promoters of the target genes that it represses. In addition, by using biochemical and cellular approaches, we demonstrate a physical association between HSF1 and PGC-1α and the effects of PGC-1α on HSF1-driven transcription. Thus, this work broadens our view of PGC-1α as a transcriptional regulator and identifies the PGC-1α/HSF1 axis as a potential target for therapeutics.
Results
Inhibition of the Expression of HSR Genes by PGC-1α in HepG2 Cells.
With an interest in the transcriptional activity of PGC-1α in hepatocytes, we initially used a microarray analysis to examine the effects of ectopic PGC-1α on gene expression in human HepG2 cells. HepG2 cells were infected with an adenoviral vector encoding PGC-1α or with a control adenovirus. Although numerous genes previously shown to be activated by PGC-1α in hepatocytes were found to be induced by PGC-1α in the present study, including the gluconeogenic enzyme phosphoenolpyruvate carboxykinase 1 (PCK1) (Fig. 1 A and C), we also identified several targets that were repressed by PGC-1α in this system. Strikingly, many genes encoding HSPs and chaperonins were dramatically down-regulated in a PGC-1α–dependent manner in the microarray analysis (Fig. 1A). Indeed, a gene annotation enrichment analysis revealed a significant overrepresentation of chaperone and stress response-related genes among the genes down-regulated 1.5-fold or more by PGC-1α in these cells (Fig. 1B). To validate these findings, we performed RT-PCR analyses for several of the targets, revealing down-regulation by PGC-1α of HSP genes from several families, including the HSP70 and HSP40 families (Fig. 1C). We also examined the expression of several targets by immunoblot, finding a consistent down-regulation of the levels of HSP proteins, including HSP105 and HSP27 (Fig. 1E).
Fig. 1.
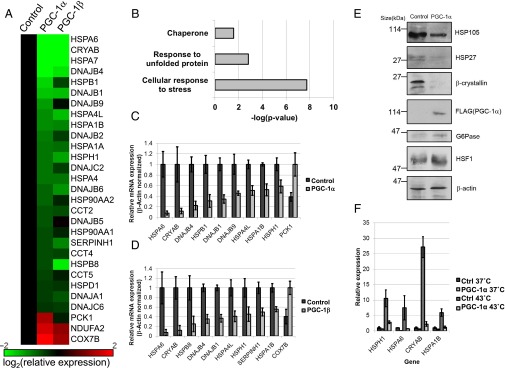
PGC-1α inhibits the expression of HSR genes in HepG2 cells. (A) Heat map representing mRNA expression of selected genes affected by adenoviral expression of PGC-1α in HepG2 cells (PGC-1α) relative to control cells (Control) as determined by microarray analysis. (B) HSR-related terms in term enrichment analysis of genes repressed 1.5-fold or more by PGC-1α expression in HepG2 cells. (C) RT-PCR validation of mRNA expression of several genes identified as repressed by PGC-1α in HepG2 cells in our microarray analysis. (D) RT-PCR validation of mRNA expression of several genes identified as repressed by PGC-1β in HepG2 cells in our microarray analysis. (E) Western blot showing protein levels of selected targets in whole-cell extracts from HepG2 cells infected with an adenovirus encoding PGC-1α or a control adenovirus. (F) RT-PCR validation of mRNA expression of HSP genes repressed by PGC-1α following heat shock in HepG2 cells. Cells were infected with a control virus or a virus encoding PGC-1α and then were heat shocked for 1 h at 43 °C followed by 5-h recovery at 37 °C.
PGC-1β, a closely related homolog of PGC-1α, has both overlapping and divergent transcriptional programs with PGC-1α in liver (26). Therefore, we also analyzed the effects of PGC-1β on gene expression in HepG2 cells. Although, as expected (26), PGC-1β failed to induce the gluconeogenic gene PCK1 (Fig. 1A), it induced the expression of other known targets of PGC-1 family members (Fig. 1 A and D). Importantly, it was able to inhibit the expression of numerous HSP genes (Fig. 1 A and D), many of which also were repressed by PGC-1α in this system. Finally, PGC-1α was able to repress the induced mRNA expression of HSP during heat stress in these cells (Fig. 1F), broadening the physiological context in which PGC-1α may act to suppress HSP gene expression.
PGC-1α Suppresses HSR Gene Expression in Human Primary Hepatocytes and in Mouse Liver.
Because HepG2 cells are cancer cells, we wished to examine whether PGC-1α can exert its inhibitory effects on HSP gene expression in primary cells as well. For that purpose, primary hepatocytes from five human donors were treated and analyzed as shown in Fig. 1. Confirming our observation in HepG2 cells, PGC-1α also elicited significant down-regulation of HSP gene expression in human primary hepatocytes (Fig. 2 A and C). A gene annotation enrichment analysis also showed overrepresentation of chaperone and stress-response genes among the genes whose expression is inhibited by PGC-1α (Fig. 2B).
Fig. 2.
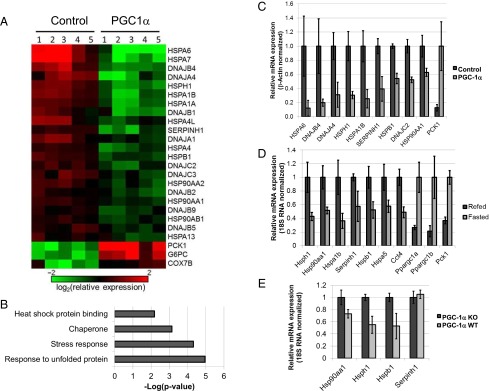
HSR genes are repressed by PGC-1α in primary human hepatocytes and by fasting in mouse liver. (A) Heat map representing mRNA expression of selected genes affected by adenoviral expression of PGC-1α in human primary hepatocytes (PGC-1α) relative to control cells (Control) as determined by microarray analysis. Each column represents one sample derived from a single human donor. (B) HSR-related terms in term enrichment analysis of genes repressed 1.5-fold or more by PGC-1α expression in human primary hepatocytes. (C) RT-PCR validation of mRNA expression of several genes identified as repressed by PGC-1α in primary human hepatocytes in our microarray analysis. Values represent averages of data from five donors; P < 0.01. (D) RT-PCR analysis of mRNA expression of several HSR genes in mouse liver during fasting or after refeeding. Values represent averages of data from eight or nine mice; P < 0.05. (E) RT-PCR analysis of mRNA expression of several HSR genes in PGC-1α KO or WT mouse livers during fasting. Values represent averages of data from seven to nine mice; P < 0.05.
Although the findings described above reveal an inhibitory effect of PGC-1α on HSR gene expression, it remained important to determine whether the physiological stimuli that regulate PGC-1α could elicit a similar effect on HSP gene expression in vivo. One well-established inducer of PGC-1α and PGC-1β in liver is fasting (4, 26). We therefore examined the effects of fasting on HSP gene expression in mouse liver and noted a decrease in the expression of several HSP genes (Fig. 2D) during fasting compared with the refed state. Interestingly, and consistent with our own expression data (Fig. 2D), our analysis of previously published global gene-expression data in mouse liver during fasting (GSE43581) revealed a significant overrepresentation of genes related to chaperones and protein-folding among the genes repressed during fasting (Fig. S1).
Fig. S1.

Repression of HSR-related genes during fasting in mouse liver. HSR-related terms found in term enrichment analysis of genes repressed 1.5-fold or more by fasting in mouse liver, based on publicly available data (GSE43581). Expression values from three mice were used to calculate averages for either the fasted or the refed states.
Although PGC-1α and PGC-1β appear to have somewhat overlapping functions with respect to HSR regulation (Fig. 1 A, C, and D), we wondered whether ablating the activity of endogenous PGC-1α alone would be sufficient to affect HSR gene expression. For this purpose we used a previously described mouse strain harboring a floxed allele of the gene encoding PGC-1α (27) crossed with a strain harboring CRE recombinase under the control of the liver-specific albumin promoter. When examining gene expression in Pgc1α WT or KO livers under fasting conditions, we noted that several HSP genes were repressed in the WT livers compared with the KO livers (Fig. 2E).
HSF1 Is Required for Optimal Suppression of HSR Gene Expression by PGC-1α.
Our results pointed to an inhibitory effect of PGC-1α on HSR gene expression, but the molecular mechanisms that underlie these effects were unclear to us. Because the best-described activators of HSP expression are the HSFs in general (12) and HSF1 in particular (13), we wondered whether the effects of PGC-1α could be mediated through HSF1. To address this possibility, HepG2 cells were transfected with a pool of siRNAs targeting HSF1 or with control siRNAs. Cells then were infected either with an adenovirus encoding PGC-1α or with a control virus, and gene expression was monitored. First, knock-down of HSF1 resulted in a rather modest (about 60%) suppression of endogenous HSF1 protein expression (Fig. S2A). Despite this modest effect, the expression levels of several genes, most notably those encoding HSPs, were negatively affected by knockdown of HSF1, demonstrating its role in their activation in these cancer cells (Fig. S2B). Importantly, in cells with reduced HSF1 levels, the inhibitory effect of ectopic PGC-1α on gene expression was less pronounced (Fig. S2C), as it also was in human primary hepatocytes (Fig. 3A).
Fig. S2.

HSF1 is required for HSP gene expression in HepG2 cells and MEFs. (A) HepG2 cells were transfected with siRNAs targeting HSF1 (SiHSF1) or control siRNAs (SiControl) and then were infected with an adenovirus encoding PGC-1α or a control adenovirus. Protein levels were scored by Western blotting of whole-cell extracts. (B) HepG2 cells were transfected with siRNAs targeting HSF1 (SiHSF1) or control siRNAs (SiControl), and mRNA levels of several HSP genes were monitored by RT-PCR. (C) RT-PCR analysis of HSP mRNA fold repression by PGC-1α in HepG2 cells that were transfected with siRNAs targeting HSF1 (SiHSF1) or with control siRNAs (SiControl). Expression was normalized to β-actin mRNA levels.
Fig. 3.

HSF1 is required for optimal repression of HSP genes by PGC-1α. (A) RT-PCR analysis of HSP mRNA fold repression by PGC-1α in human primary hepatocytes that were transfected with siRNAs targeting HSF1 (SiHSF1) or with control siRNAs (SiControl). Expression was normalized to β-actin mRNA levels. (B) Expression of PGC-1α and HSF1 proteins in HSF1 KO and WT MEFs infected with a control adenovirus or and adenovirus encoding PGC-1α. IB, immunoblot. (C) RT-PCR analysis of HSP mRNA in HSF1 KO or WT MEFs expressing an adenovirus encoding PGC-1α (P) or a control adenovirus (C). Expression was normalized to β-actin mRNA levels. (D) RT-PCR analysis of HSF mRNA expression in HepG2 cells infected with an adenovirus encoding PGC-1α or with a control adenovirus.
To support further a role for HSF1 in PGC-1α–mediated repression, we used immortalized mouse embryonic fibroblasts (MEFs) derived from either WT or KO Hsf1 mice (28). When infected with a control adenovirus or an adenovirus encoding PGC-1α, WT and KO Hsf1 MEFs showed similar levels of PGC-1α expression, and, as expected, HSF1 was detectable only in WT MEFs (Fig. 3B). In this system as well, the levels of several HSP mRNAs were dependent on HSF1 (Fig. 3C). Importantly, repression of several HSP mRNAs by PGC-1α in this system seems to be strictly dependent on HSF1 (Fig. 3C), supporting the notion that the inhibitory effects of PGC-1α are mediated through HSF1. However, the expression of PGC-1α did not reduce the level of HSF1 protein expression in HepG2 cells or in MEFs (Figs. 1D and 3B, respectively); furthermore, mRNA expression levels of all three human HSF family members were unaltered in HepG2 cells upon PGC-1α expression (Fig. 3D; mRNAs of HSFX and HSFY were undetectable). Thus, the inhibitory effect of PGC-1α on HSF1 function may involve mechanisms other than one that regulates HSF1 levels.
HSF1 and PGC-1α Interact Both in Cell Extracts and in Vitro and Bind Target Gene Promoters.
To understand further the functional relationship between PGC-1α and HSF1, we examined whether the observed effects of PGC-1α on HSF1 can be direct. To explore the possibility that PGC-1α may associate physically with HSF1, HEK293 cells were transfected with a vector encoding a V5-tagged HSF1 and then were infected with an adenovirus encoding either FLAG-tagged PGC-1α or a control adenovirus. Nuclear extracts were prepared, and PGC-1α was immunoprecipitated using an anti-FLAG antibody. Interestingly, HSF1 was detected in FLAG-immunoprecipitates from cells expressing PGC-1α but not from control cells (Fig. 4A), suggesting an intracellular association of HSF1 and PGC-1α. To examine the possibility of a direct interaction, full-length FLAG-tagged PGC-1α and GST-tagged HSF1 were expressed in and purified from bacterial cells (Fig. 4B). Subsequently, PGC-1α was incubated with either GST or GST-HSF1 immobilized on beads, followed by several washes. PGC-1α was readily detected in the material from the GST-HSF1 beads but not in the material from the GST beads, indicating a direct interaction between PGC-1α and HSF1 (Fig. 4C).
Fig. 4.

PGC-1α and HSF1 interact physically and coreside on target gene promoters. (A) Coimmunoprecipitation of PGC-1α and HSF1 in HEK293 nuclear extracts. Nuclear extracts from HEK293 cells expressing V5-tagged HSF1 and FLAG-PGC-1α or control vector were subjected to immunoprecipitations using an anti-FLAG antibody. Immunoprecipitates (IP) and nuclear extracts (NE) were blotted and probed with the indicated antibodies. (B) Recombinant bacterially expressed purified proteins used in C. Purified proteins were subjected to SDS/PAGE and stained with Coomassie Blue. (C) PGC-1α and HSF1 interact directly in vitro. Purified PGC-1α was incubated with immobilized GST or GST-HSF1. After washing the retained material was resolved by SDS/PAGE, blotted, and probed as indicated. The lower band is a likely degradation product of FLAG-PGC-1α. (D) ChIP analysis for HSF1 in HepG2 cells. Values represent enrichment of selected target gene promoters over an upstream region of the GAPDH promoter. (E) ChIP analysis for PGC-1α in HepG2 cells. Values represent the enrichment of selected target gene promoters over an upstream region of the GAPDH promoter.
The demonstration of an intracellular association, as well as a direct interaction, between PGC-1α and HSF1 raised the possibility that these proteins might function by joint binding to promoters of relevant target genes. To test this idea, we performed ChIP experiments in HepG2 cells. As expected, promoters of several HSP genes were detected in the endogenous HSF1 chromatin immunoprecipitates (Fig. 4D). Remarkably, promoters of the same HSP genes, including those of HSP90AA1 and HSPH1, were detected in the endogenous PGC-1α chromatin immunoprecipitates (Fig. 4E). These results, along with the functional and protein–protein interaction data, suggest a model in which PGC-1α, through an interaction with promoter-bound HSF1, directly regulates the expression of these genes.
PGC-1α Regulates HSF1-Mediated Transcription.
To gain further insight into the possible mechanisms by which PGC-1α affects HSF1 function, we first set out to examine whether the effects of PGC-1α on HSP gene expression involve an effect on mRNA stability. Notably, PGC-1α did not reduce, but instead appeared to moderately augment, HSP mRNA half-life (Fig. 5A) in human primary hepatocytes treated with actinomycin D. To analyze a possible effect on transcription per se, and because intronic RNA expression is believed to reflect transcription rates in cells (29, 30), we examined the expression of intronic RNAs for several HSP genes in response to PGC-1α expression. Indeed, HSP intronic RNA expression was reduced in the presence of PGC-1α (Fig. 5B), supporting a PGC-1α–mediated effect on transcriptional rates of HSP genes. Similar results were obtained using HepG2 cells (Fig. S3). Finally, we also examined the effect of PGC-1α expression in HepG2 cells on the activity of HSP promoters in a luciferase reporter assay (Fig. 5C). In this system, PGC-1α elicited reductions in expression from the HSPA1A and HSPH1 promoters. Overall, these results are consistent with a transcriptional effect of PGC-1α on HSP mRNA expression.
Fig. 5.
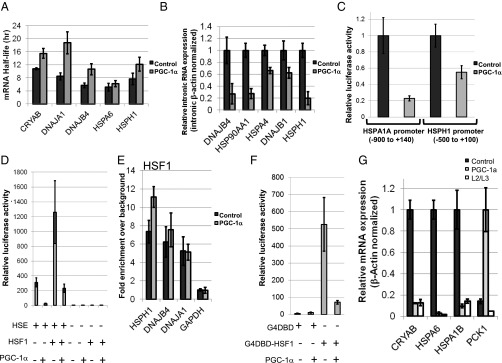
PGC-1α regulates HSF1-mediated transcription. (A) Analysis of the effects of PGC-1α on HSP mRNA half-life. Primary human hepatocytes were infected with an adenovirus encoding PGC-1α or a control adenovirus and then were mock treated or were treated with Actinomycin D for 18 h. HSP mRNA expression was determined by RT-PCR, and the half-life was calculated for the indicated transcripts. (B) Primary human hepatocytes were infected with an adenovirus encoding PGC-1α or with a control adenovirus, and intronic RNA expression of the indicated transcripts was determined by RT-PCR. (C) PGC-1α regulates the activity of HSP promoters. The indicated promoters were cloned in front of a luciferase reporter and were transfected into HepG2 cells together with a construct encoding Renilla under the control of a CMV promoter. After infection with either a PGC-1α–encoding adenovirus or a control adenovirus, cells were lysed, and luciferase activity was determined. All luciferase readings were normalized to Renilla readings. (D) PGC-1α regulates HSF1 transcriptional activity from an HSE-driven template. HepG2 cells were transfected with combinations of plasmids encoding HSF1, HSE-driven luciferase, and a template encoding luciferase but lacking HSEs, in addition to a template encoding CMV-driven Renilla. After infection with either a PGC-1α–encoding adenovirus or a control adenovirus, cells were lysed, and luciferase activity was determined. All luciferase readings were normalized to Renilla readings. (E) ChIP analysis for HSF1 in HepG2 cells infected with an adenovirus encoding PGC-1α or with a control adenovirus. Values represent enrichment of selected target gene promoters over an upstream region of the GAPDH promoter. (F) The transcriptional activity of HSF1 artificially tethered to DNA is repressed by PGC-1α. G4DBD or G4DBD fused to HSF1 was transfected into HepG2 cells together with a template containing G4DBD-binding sites and a template encoding CMV-driven Renilla. PGC-1α was coexpressed by adenoviral infection. Cells were lysed, and luciferase activity was determined. All luciferase readings were normalized to Renilla readings. (G) The L2/L3 motifs of PGC-1α are dispensable for HSP repression. HepG2 cells were infected with adenoviruses encoding PGC-1α or the L2/L3 mutant PGC-1α, as indicated, and mRNA expression of the shown genes was determined by RT-PCR analysis.
Fig. S3.

Effects of PGC-1α on mRNA stability and intronic RNA expression in HepG2 cells. (A) Analysis of the effects of PGC-1α on HSP mRNA half-life. HepG2 cells were infected with an adenovirus encoding PGC-1α or a control adenovirus and then were mock treated or treated with Actinomycin D for 18 h. HSP mRNA expression was determined by RT-PCR, and the half-life was calculated for the indicated transcripts. (B) HepG2 cells were infected with an adenovirus encoding PGC-1α or a control adenovirus, and intronic RNA expression of the indicated transcripts was determined by RT-PCR.
Although PGC-1α affects HSF1-mediated gene expression and binds promoters of genes affected by HSF1 activity, it is unclear whether additional DNA-bound factors are required for PGC-1α to mediate its inhibitory effects. To examine this possibility, we used a reporter construct containing several repeats of the heat-shock response element (HSE) without additional known transcription factor-binding sites. Expression of HSF1 in HepG2 cells augmented the activity of the HSE-containing reporter (Fig. 5D). Importantly, both basal (presumably resulting from endogenous HSFs) and HSF1-induced activities of the reporter were repressed by the expression of PGC-1α (Fig. 5D). Interestingly, however, expression of PGC-1α failed to reduce HSF1 binding to its target gene promoters, as determined by ChIP in HepG2 cells (Fig. 5E). To support further a role for PGC-1α in regulating the transcriptional activity of HSF1, rather than its DNA binding activity, HSF1 was fused to the Gal4 DNA-binding domain (G4DBD) from yeast and was expressed in HepG2 cells together with a template containing five tandem Gal4 DNA-binding sites in front of a luciferase reporter. Remarkably, coexpressed PGC-1α resulted in a dramatic loss of the ability of Gal4DBD–HSF1 to activate transcription (Fig. 5F). Thus, even when artificially tethered to a template, HSF1-mediated transcriptional activity is susceptible to repression by PGC-1α.
To examine whether the L2/L3 motifs of PGC-1α are also necessary for its ability to repress HSP gene expression, we generated an adenovirus vector encoding the L2/L3 mutant of PGC-1α and used it to infect HepG2 cells. The PGC-1α WT and L2/L3 mutant proteins were equally efficient in repressing several HSF1 target genes (Fig. 5G), suggesting that these motifs and nuclear hormone receptor binding via these motifs (8, 9) are dispensable for the inhibitory effects of PGC-1α on HSF1.
PGC-1α Regulates HSP Gene Expression in Muscle.
Because our results so far delineate a role for PGC-1α in HSF1 repression in liver, we wondered whether PGC-1α could have a similar effect in additional tissues. Indeed, expression of PGC-1α in myotubes (Fig. 6 A and B) or muscle (Fig. 6C) repressed the expression of HSPs from several families. We also noted repression of muscle HSP gene expression by endogenous PGC-1α when we analyzed publicly available microarray data (Fig. 6D). Thus, the ability of PGC-1α to suppress HSP expression appears to be manifested in other cellular contexts beyond the hepatocyte.
Fig. 6.

HSP gene expression is attenuated by PGC-1α in muscle. (A) Heat map representing mRNA expression of selected genes affected by adenoviral expression of PGC-1α in C2C12 myotubes (PGC-1α) relative to control myotubes as determined by microarray analysis. (B) RT-PCR validation of mRNA expression of several genes repressed by PGC-1α in myotubes. (C) HSP mRNA expression in gastrocnemius muscle of WT mice and mice expressing a PGC-1α transgene under a muscle-specific promoter (PGC-1α Tg). Values represent averages of data from five or six mice; P < 0.05. (D) Analysis of publicly available data (GSE34773) from mouse muscle. Mice with muscle-specific deletion of PGC-1α were subjected to calorie restriction. Statistical analysis was conducted using the two-tailed t test; *P < 0.05, **P < 0.01, ***P < 0.001. Six or seven microarrays per group were analyzed, representing six or seven mice.
PGC-1α Directly Regulates HSF1-Mediated Transcriptional Programs Beyond the HSR.
HSF1 now is understood to be a critical factor necessary for cancer cell maintenance, both by its ability to regulate HSP gene expression and by its ability to induce additional transcriptional programs (19). Thus it was tempting to explore the possible effects of PGC-1α expression on additional HSF1-dependent gene-expression programs beyond the HSR and to do so specifically in cancer cells. First, because HepG2 cells were derived from a hepatocellular carcinoma tumor (31), we reexamined our microarray data and noted that, in these cancer cells, many additional genes that previously were described as HSF1 targets in cancer are down-regulated in a PGC-1α–dependent manner. Several genes, including CDC6, EIF4A2, MLH1, and SLC5A3, were all described previously as HSF1 targets in cancer (19) and were down-regulated by PGC-1α in our HepG2 cell analysis (Fig. 7A). In fact, when performing a gene annotation enrichment analysis of genes down-regulated by PGC-1α, we noted a striking overrepresentation of cell cycle- and DNA repair-related genes (Fig. 7B). To substantiate further that HSF1 is required for the effects of PGC-1α on these transcriptional programs in HepG2 cells, we knocked down HSF1 using siRNAs and examined the impact on PGC-1α–mediated gene repression using a microarray analysis. Indeed, a role for HSF1 in PGC-1α–mediated repression of several genes was evident from the microarray analysis (Fig. 7 C and D). Thus, PGC-1α represses HSF1-dependent transcriptional programs beyond the one involved in HSR in cancer cells.
Fig. 7.
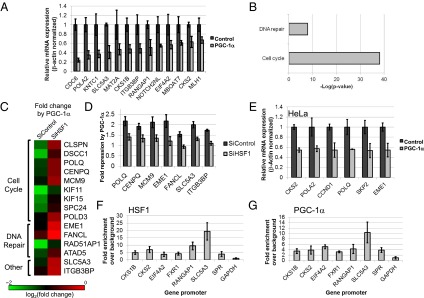
PGC-1α regulates non-HSR HSF1-dependent transcriptional programs. (A) RT-PCR validation of mRNA expression of several non-HSR genes identified as repressed by PGC-1α in HepG2 cells in our microarray analysis. (B) Non–HSR-related terms found in term enrichment analysis of genes repressed 1.5-fold or more by PGC-1α expression in HepG2 cells. (C) Heat map representing fold repression by PGC-1α of selected genes in cells transfected with control siRNAs (SiControl) or with siRNAs targeting HSF1 (SIHSF1). (D) RT-PCR analysis of target gene mRNA fold repression by PGC-1α in HepG2 cells that were transfected with siRNAs targeting HSF1 (SiHSF1) or with control siRNAs (SiControl). (E) RT-PCR analysis of mRNA expression of several non-HSR genes repressed by PGC-1α in HeLa cells. (F) ChIP analysis for HSF1 in HepG2 cells. Values represent enrichment of selected target gene promoters over an upstream region of the GAPDH promoter. (G) ChIP analysis for PGC-1α in HepG2 cells. Values represent enrichment of selected target gene promoters over an upstream region of the GAPDH promoter.
However, we noted that not all possible HSF1 target genes that we analyzed (e.g., in Fig. 7A) were affected by the HSF1 knockdown. Some genes still were suppressed efficiently by PGC-1α even in cells with HSF1 knockdown. This efficient gene suppression in the HSF1 knockdown cells may be explained by the significant levels of HSF1 remaining in the knockdown cells (as shown in Fig. S2A), possibly enabling some genes still to be suppressed efficiently by PGC-1α through residual HSF1.
Because a role for HSF1 in cancer cell survival has been described previously for many other cell types (19, 20), and because HSF1 repression previously has been suggested as a promising anticancer strategy (22), we used additional cancer cell lines to demonstrate further the relevance of PGC-1α expression to the repression of HSF1 in cancer. In HeLa cervical cancer cells, much as in HepG2 cells, several known non-HSR HSF1 target genes were repressed by PGC-1α (Fig. 7E). Interestingly, an analysis of mRNA expression in mouse liver also revealed an inhibition of several non-HSR target genes in response to fasting (Fig. S4).
Fig. S4.

Effects of fasting on mouse liver mRNA expression of several potential HSF1 targets. RT-PCR analysis of mRNA expression in mouse liver during fasting or after feeding. Values represent averages of data from eight or nine mice, P < 0.05.
Finally, we used ChIP to examine the association of PGC-1α and HSF1 with promoter regions of several of the non-HSP genes repressed by PGC-1α in HepG2 cells. Indeed, several relevant promoters were cobound by both PGC-1α and HSF1 (Fig. 7 F and G). These results suggest that these genes, like the HSP genes, are directly down-regulated by promoter-bound HSF1 and PGC-1α.
Discussion
Although PGC-1α has long been appreciated as a direct coactivator of numerous transcription factors involved in metabolic regulation (see the Introduction), our findings delineate a more complex scenario whereby PGC-1α also acts as a direct repressor for multiple genes in several transcriptional programs that are dependent on HSF1 activity.
By examining gene expression in the HepG2 human hepatocellular carcinoma cell line and in primary human hepatocytes from several donors, we show that PGC-1α can exert a strong inhibitory effect on HSR gene expression at both the mRNA and protein levels. It is interesting that PGC-1α and PGC-1β repress some HSR gene targets to similar levels, whereas other targets are repressed better by PGC-1α or by PGC-1β. Thus, it is possible that these two closely related family members have some differential target preferences with regard to HSR genes. However, it seems that, overall, the target gene profiles of PGC-1α and PGC-1β are similar and may be overlapping in vivo under conditions, such as fasting, that induce the expression of both proteins. Importantly, our data show that fasting can exert an inhibitory effect on HSP gene expression. Thus, it seems that fasting, the physiological stimulus for the induction of PGC-1α–dependent transcriptional programs in liver (e.g., gluconeogenesis), also can elicit repression of the HSR. Furthermore, either endogenous PGC-1α (Figs. 2E and 6D) or PGC-1α expressed from a transgene (Fig. 6C) can repress some HSP gene expression, at least under some conditions. Because PGC-1α and PGC-1β may have overlapping HSR-related target genes in liver, future studies using mice lacking Pgc-1β or both Pgc-1α and Pgc-1β would be instrumental in demonstrating an even broader impact of PGC-1 family members on HSR gene expression.
What could be the mechanisms by which the inhibitory effects of PGC-1α on HSF1 take place? Specifically, are these effects direct or indirect? Indeed, it previously has been proposed that PGC-1α can act as an indirect repressor of inflammatory genes, in addition to its well-described role as a regulator of metabolic pathways, an observation made mostly in myocytes and muscle tissue (32). On the other hand, our results (for different target genes) suggest that PGC-1α has a direct effect on HSF1-dependent transcription. First, HSF1 and PGC-1α can be coimmunoprecipitated from cellular extracts, indicating an intracellular association. Second, although this result does not exclude an association via an additional bridging factor, in vitro binding data using purified recombinant proteins clearly indicate a direct interaction. Third, ChIP studies have shown that HSF1 and PGC-1α co-occupy the promoter regions of several genes that are inhibited by PGC-1α. These results suggest a mechanism involving PGC-1α–mediated suppression of HSF1 activity at sites where it engages in transcription activation rather than a possible effect of PGC-1α on HSF1 extrinsic to the DNA. Strikingly, a recent genomic analysis of PGC-1α has revealed that the motif most highly enriched in DNA fragments bound by PGC-1α is the HSE, the recognition site for the heat-shock transcription factors in general and for HSF1 in particular (33). Interestingly, that genomic study used HepG2 cells, and in analyzing the supplemental data in that report we observed similar targets bound by HSF1 and PGC-1α as in our study. Collectively, these observations suggest that HSF1 is an important binding partner for PGC-1α on chromatin.
Several potential mechanisms, yet to be explored, may mediate the repressive effects of PGC-1α upon HSF1 binding. For example, PGC-1α may recruit corepressor complexes, actively inducing repression of HSF1-mediated transcription. Alternatively, the binding of PGC-1α to HSF1 may elicit eviction of HSF1-bound coactivators or an HSF1 conformational change that results in compromised transcriptional activity.
Although we find HSF1 to be repressed by PGC-1α, it is noteworthy that HSF1 is not the sole HSF in mammals (12). Many targets identified in our study are also targets for HSF2, and it remains possible that at least some of the effects of PGC-1α in the systems analyzed here are mediated through HSF2. Furthermore, HSF2 and HSF4 also have some unique targets that might be modulated by PGC-1α activity under some conditions. Because HSF family members are known to form heterotrimers (12), it also is possible that PGC-1α gains access to genes regulated by HSF2 and HSF4 indirectly, via its association with HSF1.
Interestingly, we find that mutations in the L2/L3 motifs of PGC-1α do not affect the ability of PGC-1α to repress HSP gene expression (Fig. 5G). This finding is consistent with the notion that the PGC-1α effect on HSF1 is direct, because the binding of nuclear hormone receptors via these motifs is dispensable for PGC-1α–mediated repression of HSPs. Future studies will help determine the precise mechanisms that underlie the inhibitory effects of PGC-1α on HSF1-mediated transcription.
Finally, our observations in liver and hepatocytes were extended to muscle (Fig. 6). Thus, our findings are not restricted solely to liver, and future studies might reveal additional cell types and tissues in which PGC-1α can exert its inhibitory activity on HSP gene expression. Because adipocytes and neurons are also target cells for PGC-1α, they constitute good candidates for future exploration of the ability of PGC-1α to repress HSF1 functions.
HSF1 is now widely recognized as a transcriptional regulator not only of the HSR but also of numerous other transcriptional programs (19). It thus is notable that PGC-1α also can regulate these aspects of HSF1 activity. Specifically, cancer cells are considered to be highly dependent on HSF1 activity, which regulates several transcriptional programs that include those controlling cell cycle, DNA damage repair, and protein translation (17, 19). Our analysis shows that at least some of these programs are regulated directly by PGC-1α; future studies will explore the possibility that additional non-HSR transcriptional programs are directly regulated by the action of PGC-1α on HSF1. Our studies used several cancer cell lines, including HepG2, HeLa, and MCF7. Although HepG2 cells naturally express PGC-1α, it is unclear whether other cancer cells such as HeLa and MCF7 express significant levels of PGC-1α. However, regardless of the endogenous levels of PGC-1α in specific cancers, our studies constitute a proof of principle that targeting the PGC-1α/HSF1 interface can be a valid approach to repress HSF1 activity in cancer.
Why would PGC-1α both boost metabolic gene transcription and at the same time repress HSF1? One possibility may involve the ability of PGC-1α, under some conditions, to activate genes that are implicated in the response to oxidative stress (34–36) and thus lead to a reduction of cellular oxidative stress levels. PGC-1α therefore may orchestrate the timely repression of HSPs in response to lower levels of oxidative stress.
One other possibility may involve the previously described inhibition of cell proliferation by fasting (37–39). Because HSF1 is required for several processes that involve normal cell proliferation, such as spleen cell proliferation following immunization (40), muscle regeneration (41), and postnatal growth in C57BL/6 mice (42), it is possible that PGC-1α induction by fasting in liver (4) and muscle (43) represses HSF1 to mediate some of the antiproliferative effects of fasting. These scenarios also may hold true in cancer cells, although the potential effect of PGC-1α on cancer cell growth and survival is controversial, with reports suggesting both positive (44, 45) and negative (46–50) associations between PGC-1α activity and cancer cell survival [including a negative association in HepG2 cells (51)], depending on the cellular context and on PGC-1α expression levels. It thus is possible that PGC-1α effects in cancer depend on a balance between its ability to induce metabolic genes and oxidative stress-response genes, a property that may promote cancer growth, and its ability to repress HSF1 activity.
Thus, our findings that PGC-1α acts as a critical repressor of HSF1-mediated transcriptional programs link two major cellular transcriptional networks and form a basis for future studies looking into the cross-talk between metabolic regulation and the cellular stress response in physiological and pathophysiological scenarios.
Materials and Methods
Cell Culture and Treatments.
HepG2 cells (ATCC HB-8065) and HeLa cells were grown in Eagle’s minimum essential medium containing 10% (vol/vol) FBS and antibiotics. HEK293 cells were grown in DMEM containing 10% (vol/vol) FBS and antibiotics. Preplated fresh primary hepatocytes from different human donors were obtained from Becton-Dickinson in collagen I-coated plates. C2C12 cells (ATCC CRL-1772) were grown in DMEM containing 20% (vol/vol) FBS and antibiotics and were differentiated into myotubes in DMEM supplemented with 2% (vol/vol) donor equine serum and 1 μM insulin for 7 d. HSF1 WT and KO immortalized MEFs were a kind gift from Ivor J. Benjamin, Medical College of Wisconsin, Milwaukee, and were maintained in DMEM containing 10% FBS and antibiotics. Adenoviruses were produced in HEK293 cells as previously described (52) and were added directly to the culture medium where indicated. Control and HSF1-targeting ON-TARGETplus SMARTpool siRNAs from Dharmacon were transfected into cells using the DharmaFECT 1 reagent (Dharmacon) according to the manufacturer’s instructions.
In Vitro Binding and Immunoprecipitation Studies.
GST-tagged proteins were purified from bacteria as previously described (53). Recombinant FLAG-tagged PGC-1α was expressed from a pET vector in BL21 cells following induction with 1 mM isopropyl β-d-1-thiogalactopyranoside for 3 h. Following sonication in BC500 [25% glycerol, 20 mM Hepes⋅KOH (pH 7.9), 500 mM KCl, 0.1% Nonidet P-40, and protease inhibitors] and centrifugation, the supernatant was incubated with M2 anti-FLAG beads (Sigma). Beads were washed in BC500, and FLAG-PGC-1α was eluted with 3× FLAG peptide (Sigma) in BC100. For in vitro binding assays, immobilized proteins were incubated with purified PGC-1α in BC120/0.01% Nonidet P-40, were washed with the same buffer, and then were boiled in SDS/PAGE protein-loading buffer for elution. For coimmunoprecipitation studies, nuclear extracts were prepared as previously described (54). Extracts then were adjusted to 100 mM KCl and were supplemented with 0.01% Nonidet P-40 and M2 anti-FLAG beads (Sigma). After incubation and washes in BC100/0.01% Nonidet P-40, proteins were eluted by boiling in SDS/PAGE protein-loading buffer. ChIP studies were performed as previously described (32).
Luciferase Assays.
Luciferase assays were performed using the dual luciferase kit from Promega. Cells were transfected with the Trans-IT reagent (Mirus) according to the manufacturer’s instructions. For HSE-driven luciferase assays, the Cignal Heat Shock Response Reporter kit from SA Biosciences was used.
Antibodies.
Antibodies used were FLAG (F3165; Sigma), β-actin (sc-47778), HSF1 (sc-9144), PGC-1α (sc-13067), HSP27 (sc-1048), HSP105 (sc-6241), β-crystallin (sc-22744), and G6Pase (sc-25840) (all from Santa Cruz), and V5-tag (ab9116; Abcam).
Mice.
All animal experiments were performed according to procedures approved by the Institutional Animal Care and Use Committee of the Rockefeller University. Mice were on a standard chow diet and were housed in a pathogen-free facility under a standard 12-h/12-h light/dark cycle. Seven- to nine-week-old male mice were used for experiments. For fasting experiments, mice were placed in individual cages with access to water ad libitum for 20 h and then were either given access to food or not for four additional hours. Mice harboring a floxed allele of the gene encoding PGC-1α were previously described (27) and were purchased from Jackson Laboratories.
Gene-Expression Analysis.
RNA was extracted using the RNeasy kit from Qiagen. RNA was reverse-transcribed using the SuperScript III First Strand Synthesis kit from Invitrogen. Real-time PCR was performed on an Applied Biosystems 7300 Real Time PCR System using QuantiTect SYBR Green mix. Complete primer information is given in Table S1. Microarray analysis was performed using the Affymetrix GeneChip Gene 1.0 ST arrays (either human or mouse) according to the manufacturer’s instructions. The data expressed as CEL files were normalized by the robust multiarray average method with the Expression Console software (Affymetrix) and have been deposited in the Gene Expression Omnibus database as GSE51498. Gene annotation enrichment analysis was performed using the Database for Annotation, Visualization, and Integrated Discovery (55) with the Benjamini procedure to control for false-discovery rate.
Table S1.
Primers used in this study
| Forward primer | Reverse primer | |
| Human mRNA expression primers | ||
| ACTB | GAG GCA CTC TTC CAG CCT T | AAG GTA GTT TCG TGG ATG CC |
| CCND1 | GCG GAG GAG AAC AAA CAG AT | TGA ACT TCA CAT CTG TGG CA |
| CDC6 | GTT TCA GGA GAT GTT CGC AA | GGA ATC AGA GGC TCA GAA GG |
| CENPQ | CTG AAG GAC AAA CAA AGC ACA | CTC TTT GAC AGA GGT TGC CA |
| CKS1B | AGT CAG GGA TGG GTC CAT TA | TTG CCA GCT TCA TTT CTT TG |
| CKS2 | GAG GAG TGG AGG AGA CTT GG | TGT GGT TCT GGC TCA TGA AT |
| COX7B | AGG GTA CCT GAA GCG AAT TG | TGA ATG CTT CGA ACT TGG AG |
| CRYAB | TGG GAG ATG TGA TTG AGG TG | GGA ACT CCC TGG AGA TGA AA |
| DNAJA1 | TCG ACG AGG AGA AGA CCT TT | TCT GAC CTG GAT GAG AGG TG |
| DNAJB1 | CTG ATG TCA TTT ATC CTG CCA | TTT GAA TAC GAC GGG TAT CG |
| DNAJB4 | GGA GGA AGG GTT GAA AGG A | ATG AAA GGT GTA CCG GAA GG |
| DNAJB8 | TCA AGC CAG AGG AGT TGA TG | GCC ACC TTC TTG CTG TTT CT |
| DNAJB9 | CTG TGG AGG AGC AGC AGT AG | AAA TGC AGA TTG CAA AGA TGA |
| DNAJC3 | CAT CTT GAA TTG GGC AAG AA | AGC CCT CCG ATA ATA AGC AA |
| EIF4A2 | GTC ATC GAG AGC AAC TGG AA | ATA GCG GAA GGC TTC TCA AA |
| EME1 | GAA GAG GCA TTG GTG GAT CT | TTT CCA GCT CTG CAC AAT TT |
| FANCL | AGA CCT GGG TAC TTG AGC CA | TCA GCT CCA AGA AAG AAG CA |
| GAPDH | TGC ACC ACC AAC TGC TTA GC | GGC ATG GAC TGT GGT CAT GAG |
| HSF1 | GCA GCT CCT TGA GAA CAT CA | CTG TCC TGG CGG ATC TTT AT |
| HSF2 | CAG AAT GAA CCA GCC AGA GA | TGA GGT CAG ACT GGA TGA GC |
| HSF4 | ACT TCA TCC AGT CGC CTT CT | GGA TGG AGA GTC TTC TGG GA |
| HSP90AA1 | CCC GTC GCT ATA TAA GGC A | GGG TTT CCT CAG GCA TCT T |
| HSPA1B | AGG GTG TTT CGT TCC CTT TA | CAT TCC CAG CCT TTG TAG TG |
| HSPA4L | AAT GCT GAT GAA GCT GTT GC | ACG CAC TTT AAA TGC TGG TG |
| HSPA6 | ACA GGA GCA CAG GTA AGG CT | TTC ATG AAC CAT CCT CTC CA |
| HSPB1 | CTG ACG GTC AAG ACC AAG G | GAC AGG GAG GAG GAA ACT TG |
| HSPH1 | AGG CGA TCT GTG TTA GAT GCT | ATC CGA GGT TTC TCA TCC AG |
| ITGB3BP | CAT TGG AAT CTC CTG TGC AT | GGA ATT CAT AGC TGT CAA GAT GA |
| KNTC1 | ACC ACT GCT TTC AGC CTC TT | AGC CGG AAG TTC TAA CTG GA |
| MAT2A | GAC CAG GGC TTA ATG TTT GG | TCT GCC AGT TTG GCA TTT AG |
| MBOAT7 | TAT GAG ACC ATC CGC AAC AT | CAC CGT CAT GTT CCA GTA CC |
| MCM9 | TAC CAG ATG CAA AGG CAG AG | GCA TGA GCT TCT GCT AAT CG |
| MLH1 | GAG GAA GAT GGT CCC AAA GA | TCC CTT CCT CAT CAA TTT CC |
| NOTCH2NL | ACT CCC ATA GCC TCT GCA TT | CTG CGG AAT CCT TGG TTA TT |
| PCK1 | CAC CCA AGA GCA AAG AGA CA | TAC ATG GTG CGA CCT TTC AT |
| POLA2 | GCT AAG CAT GAA CAG GTG GA | CAA TGA CGG GAC AAA GAC AA |
| POLQ | GAC CAA ACA GGA TTG TCA CG | GGA TGA AGA AGC CTC CTC TG |
| PPARGC1A | CAA GCC AAA CCA ACA ACT TTA TCT CT | CAC ACT TAA GGT GCG TTC AAT AGT C |
| RANGAP1 | GAT AGC CCA GCA GAC TGA CA | GTT GAA AGC CTT CTG CAT CA |
| SERPINH1 | CCA TGT TCT TCA AGC CAC AC | CAT CAT GAC ACC CAC GGT AT |
| SKP2 | TTG CAG GAT GGT GTC TCT TC | AGA ATG AAG GCA AAG GGA AA |
| SLC5A3 | TTC AGA GGC AGA AAC ACC AG | CTT CCA GTA CCG ACC TCC AT |
| Human intronic primers | ||
| DNAJB1 | ACA GTA TTT CCG CGT AGC CT | GCC ATC TCT TGG TGA TGT TG |
| DNAJB4 | TGG TGA GGA CCT ACA GTG TCA | GTA TCT CAG AAT CCT GCT TAG CTT T |
| HSP90AA1 | AAG CAA GGT TTG CCG TTA CT | CCC AAC GAT CAG GAA CAA G |
| HSPA4 | GTT TAA GCC CAG GAG ATG GA | TTG AGA GGC TTT CCC TCT GT |
| HSPH1 | ACA CCA CAA CTC TGG GTC AG | GTA CCC TTG CCT CAC ACC TT |
| Mouse mRNA expression primers | ||
| actb | GGC TGT ATT CCC CTC CAT CG | CCA GTT GGT AAC AAT GCC ATG T |
| ccnd1 | TGA GAA CAA GCA GAC CAT CC | TGA ACT TCA CAT CTG TGG CA |
| cct4 | CAA ATG CAG GTA TTG CAT CC | GAG CCA GCA ATG ATG ACA AC |
| cks1b | GAA AGC TTC AGC TCT TTC CG | AGG CCT TCC AGG CTT AGA TT |
| cox6a1 | TTG GAT GCT AAG CTC GTG TC | ACA AGC AGA AGG GAT GGA AG |
| cpt1b | GAA GAG ATC AAG CCG GTC AT | CTC CAT CTG GTA GGA GCA CA |
| dnaja1 | ATG GAA CTG CCT AGG AAT GG | AAG GGA TGG TTC AGT TCC TG |
| dnajb1 | CTG ATG TCA TCT ATC CAG CCA | AGG GAC ATT CAC AGT GCA AC |
| dnajc13 | GCG CCT AGG AAT GAA GGT AG | ATA GGA CAC ATG AGG GCA CA |
| hsp90aa1 | TGC CCA GTT AAT GTC CTT GA | GTC AGG CTC TCG TAA CGG AT |
| hspa1a | CTG GGC CAC ATT GTT GAT AC | TCC TAC AGT GCA ACC ACC AT |
| hspa1b | CCA GTA GCC TGG GAA GAC AT | CAG TGC CAA GAC GTT TGT TT |
| hspa5 | TCT GCG TGT GTG TGA GGT AA | GGT CAG GAG GAG ACA CGA AG |
| hspb1 | GGA GCT CAC AGT GAA GAC CA | CTG GAG GGA GCG TGT ATT TC |
| hspb8 | GTG GAA GTT TCA GGC AAA CA | GGA GAA AGC GAG GCA AAT AC |
| hsph1 | TTG AGA CAG AGG GCA AGA TG | CCA CAT AGC TTG TCC CTG AA |
| mlh1 | TTA ACC TCA CCA GCG TCT TG | GGA ATG GTT ACG GAG CAT CT |
| pck1 | TTT GTA GGA GCA GCC ATG AG | TGA TGA TCT TGC CCT TGT GT |
| polb | GGA CAT GCT CGT GGA ACT C | GCA TTG TAC TTG TGG ATC GC |
| ppargc1a | TAC AAT GAA TGC AGC GGT CT | GCA GGG TTT GTT CTG ATC CT |
| ppargc1b | TTC CAG AGA CTC CTC CAG GT | GCT TGT ATG GAG GTG TGG TG |
| serpinh1 | AAC TGT CAC TTG CCT GGG TT | GGA CCT GTG AGG GTT TAC CA |
| skp2 | CAT GTT GCC CAA GGA CAT AG | TGT GAG GTT CTG GTT CAT GG |
| Human genomic primers | ||
| CKS1B | CAG TGG GAG AAC GTA GCA AA | GCG CTA CTC TCC TGT TAG GG |
| CKS2 | GGG ATA CAA GGG ATC ACG AG | ACC TGA AGG TGG AGT GAG GT |
| DNAJA1 | TTT GGG AAC CCT AGG ACT TG | GGA ATC TTC TGG AGC CCT TT |
| DNAJB4 | TTA ATC GTG GAG GAG GAG AAA | AGA ACA GCA AAT GCT ACA GGA C |
| EIF4A2 | CCA GGG GAG ATG ATA GTG GA | AAA GCA GCC GAA GTT TCG TA |
| FXR1 | TTG CCA CTT TGT CGA GTG TT | ACC TCA CTC TCT GGG ACC AC |
| GAPDH | TCT GCA GGA GAC AAG ACC TG | GAC TTG AGG AGC TGG AGA GG |
| HSP90AA1 | CAC CCG TCA CCT TGG CTA | GAA GGT TCG GGA GGC TTC T |
| HSPA8 | CTG CCC TTA CAA GAC CCA AT | GGT GAG TGC GTT ATC GTG AG |
| HSPD1 | GGC CGG CTT AGT CTA GTT CC | GCT GTT TCT AGG CTT TTC TAG GC |
| HSPH1 | CGA GCC TTC TGG AAA GAT TC | AGG CAG GTT TGA GCC AAT |
| RANGAP1 | GCC CAG AGA CTA CAA TTC CC | GCA GCC AGC AGT ACC TGT TA |
| SLC5A3 | GAA GGA AGG CAT GGA AAG TT | CTG CCA TGC CTG CTA CCT |
| SPR | AAG CGC CTG TAG AAC TTT CC | GGT CCT TTG GAG AAG CAG AG |
Acknowledgments
We thank Ivor J. Benjamin for the HSF1-KO mouse embryonic fibroblasts (MEFs). This work was supported by a Machiah Foundation Fellowship and a Merck Postdoctoral Fellowship (to N.M.) and by NIH Grant DK071900 (to R.G.R.).
Footnotes
The authors declare no conflict of interest.
Data deposition: Microarray data associated with this article have been deposited in the Gene Expression Omnibus database (accession no. GSE51498).
This article contains supporting information online at www.pnas.org/lookup/suppl/doi:10.1073/pnas.1516219112/-/DCSupplemental.
References
- 1.Handschin C, Spiegelman BM. Peroxisome proliferator-activated receptor gamma coactivator 1 coactivators, energy homeostasis, and metabolism. Endocr Rev. 2006;27(7):728–735. doi: 10.1210/er.2006-0037. [DOI] [PubMed] [Google Scholar]
- 2.Liu C, Lin JD. PGC-1 coactivators in the control of energy metabolism. Acta Biochim Biophys Sin (Shanghai) 2011;43(4):248–257. doi: 10.1093/abbs/gmr007. [DOI] [PMC free article] [PubMed] [Google Scholar]
- 3.Wu Z, et al. Mechanisms controlling mitochondrial biogenesis and respiration through the thermogenic coactivator PGC-1. Cell. 1999;98(1):115–124. doi: 10.1016/S0092-8674(00)80611-X. [DOI] [PubMed] [Google Scholar]
- 4.Yoon JC, et al. Control of hepatic gluconeogenesis through the transcriptional coactivator PGC-1. Nature. 2001;413(6852):131–138. doi: 10.1038/35093050. [DOI] [PubMed] [Google Scholar]
- 5.Puigserver P, et al. A cold-inducible coactivator of nuclear receptors linked to adaptive thermogenesis. Cell. 1998;92(6):829–839. doi: 10.1016/s0092-8674(00)81410-5. [DOI] [PubMed] [Google Scholar]
- 6.Lin J, et al. Transcriptional co-activator PGC-1 alpha drives the formation of slow-twitch muscle fibres. Nature. 2002;418(6899):797–801. doi: 10.1038/nature00904. [DOI] [PubMed] [Google Scholar]
- 7.Puigserver P, et al. Activation of PPARgamma coactivator-1 through transcription factor docking. Science. 1999;286(5443):1368–1371. doi: 10.1126/science.286.5443.1368. [DOI] [PubMed] [Google Scholar]
- 8.Li Y, Kovach A, Suino-Powell K, Martynowski D, Xu HE. Structural and biochemical basis for the binding selectivity of peroxisome proliferator-activated receptor gamma to PGC-1alpha. J Biol Chem. 2008;283(27):19132–19139. doi: 10.1074/jbc.M802040200. [DOI] [PMC free article] [PubMed] [Google Scholar]
- 9.Wu Y, Chin WW, Wang Y, Burris TP. Ligand and coactivator identity determines the requirement of the charge clamp for coactivation of the peroxisome proliferator-activated receptor gamma. J Biol Chem. 2003;278(10):8637–8644. doi: 10.1074/jbc.M210910200. [DOI] [PubMed] [Google Scholar]
- 10.Morimoto RI. The heat shock response: Systems biology of proteotoxic stress in aging and disease. Cold Spring Harb Symp Quant Biol. 2011;76:91–99. doi: 10.1101/sqb.2012.76.010637. [DOI] [PubMed] [Google Scholar]
- 11.Gidalevitz T, Prahlad V, Morimoto RI. The stress of protein misfolding: From single cells to multicellular organisms. Cold Spring Harb Perspect Biol. 2011;3(6):a009704. doi: 10.1101/cshperspect.a009704. [DOI] [PMC free article] [PubMed] [Google Scholar]
- 12.Akerfelt M, Morimoto RI, Sistonen L. Heat shock factors: Integrators of cell stress, development and lifespan. Nat Rev Mol Cell Biol. 2010;11(8):545–555. doi: 10.1038/nrm2938. [DOI] [PMC free article] [PubMed] [Google Scholar]
- 13.Anckar J, Sistonen L. Regulation of HSF1 function in the heat stress response: Implications in aging and disease. Annu Rev Biochem. 2011;80:1089–1115. doi: 10.1146/annurev-biochem-060809-095203. [DOI] [PubMed] [Google Scholar]
- 14.Hahn JS, Hu Z, Thiele DJ, Iyer VR. Genome-wide analysis of the biology of stress responses through heat shock transcription factor. Mol Cell Biol. 2004;24(12):5249–5256. doi: 10.1128/MCB.24.12.5249-5256.2004. [DOI] [PMC free article] [PubMed] [Google Scholar]
- 15.Gonsalves SE, Moses AM, Razak Z, Robert F, Westwood JT. Whole-genome analysis reveals that active heat shock factor binding sites are mostly associated with non-heat shock genes in Drosophila melanogaster. PLoS One. 2011;6(1):e15934. doi: 10.1371/journal.pone.0015934. [DOI] [PMC free article] [PubMed] [Google Scholar]
- 16.Neef DW, Jaeger AM, Thiele DJ. Heat shock transcription factor 1 as a therapeutic target in neurodegenerative diseases. Nat Rev Drug Discov. 2011;10(12):930–944. doi: 10.1038/nrd3453. [DOI] [PMC free article] [PubMed] [Google Scholar]
- 17.Ciocca DR, Arrigo AP, Calderwood SK. Heat shock proteins and heat shock factor 1 in carcinogenesis and tumor development: An update. Arch Toxicol. 2013;87(1):19–48. doi: 10.1007/s00204-012-0918-z. [DOI] [PMC free article] [PubMed] [Google Scholar]
- 18.Zhang Y, Huang L, Zhang J, Moskophidis D, Mivechi NF. Targeted disruption of hsf1 leads to lack of thermotolerance and defines tissue-specific regulation for stress-inducible Hsp molecular chaperones. J Cell Biochem. 2002;86(2):376–393. doi: 10.1002/jcb.10232. [DOI] [PubMed] [Google Scholar]
- 19.Mendillo ML, et al. HSF1 drives a transcriptional program distinct from heat shock to support highly malignant human cancers. Cell. 2012;150(3):549–562. doi: 10.1016/j.cell.2012.06.031. [DOI] [PMC free article] [PubMed] [Google Scholar]
- 20.Santagata S, et al. Tight coordination of protein translation and HSF1 activation supports the anabolic malignant state. Science. 2013;341(6143):1238303. doi: 10.1126/science.1238303. [DOI] [PMC free article] [PubMed] [Google Scholar]
- 21.Dai C, Whitesell L, Rogers AB, Lindquist S. Heat shock factor 1 is a powerful multifaceted modifier of carcinogenesis. Cell. 2007;130(6):1005–1018. doi: 10.1016/j.cell.2007.07.020. [DOI] [PMC free article] [PubMed] [Google Scholar]
- 22.Whitesell L, Lindquist S. Inhibiting the transcription factor HSF1 as an anticancer strategy. Expert Opin Ther Targets. 2009;13(4):469–478. doi: 10.1517/14728220902832697. [DOI] [PubMed] [Google Scholar]
- 23.Baler R, Welch WJ, Voellmy R. Heat shock gene regulation by nascent polypeptides and denatured proteins: Hsp70 as a potential autoregulatory factor. J Cell Biol. 1992;117(6):1151–1159. doi: 10.1083/jcb.117.6.1151. [DOI] [PMC free article] [PubMed] [Google Scholar]
- 24.Shi Y, Mosser DD, Morimoto RI. Molecular chaperones as HSF1-specific transcriptional repressors. Genes Dev. 1998;12(5):654–666. doi: 10.1101/gad.12.5.654. [DOI] [PMC free article] [PubMed] [Google Scholar]
- 25.Ruas JL, et al. A PGC-1α isoform induced by resistance training regulates skeletal muscle hypertrophy. Cell. 2012;151(6):1319–1331. doi: 10.1016/j.cell.2012.10.050. [DOI] [PMC free article] [PubMed] [Google Scholar]
- 26.Lin J, et al. PGC-1beta in the regulation of hepatic glucose and energy metabolism. J Biol Chem. 2003;278(33):30843–30848. doi: 10.1074/jbc.M303643200. [DOI] [PubMed] [Google Scholar]
- 27.Lin J, et al. Defects in adaptive energy metabolism with CNS-linked hyperactivity in PGC-1alpha null mice. Cell. 2004;119(1):121–135. doi: 10.1016/j.cell.2004.09.013. [DOI] [PubMed] [Google Scholar]
- 28.McMillan DR, Xiao X, Shao L, Graves K, Benjamin IJ. Targeted disruption of heat shock transcription factor 1 abolishes thermotolerance and protection against heat-inducible apoptosis. J Biol Chem. 1998;273(13):7523–7528. doi: 10.1074/jbc.273.13.7523. [DOI] [PubMed] [Google Scholar]
- 29.Elferink CJ, Reiners JJ., Jr Quantitative RT-PCR on CYP1A1 heterogeneous nuclear RNA: A surrogate for the in vitro transcription run-on assay. Biotechniques. 1996;20(3):470–477. doi: 10.2144/19962003470. [DOI] [PubMed] [Google Scholar]
- 30.Shema E, Kim J, Roeder RG, Oren M. RNF20 inhibits TFIIS-facilitated transcriptional elongation to suppress pro-oncogenic gene expression. Mol Cell. 2011;42(4):477–488. doi: 10.1016/j.molcel.2011.03.011. [DOI] [PMC free article] [PubMed] [Google Scholar]
- 31.Knowles BB, Howe CC, Aden DP. Human hepatocellular carcinoma cell lines secrete the major plasma proteins and hepatitis B surface antigen. Science. 1980;209(4455):497–499. doi: 10.1126/science.6248960. [DOI] [PubMed] [Google Scholar]
- 32.Handschin C, Spiegelman BM. The role of exercise and PGC1alpha in inflammation and chronic disease. Nature. 2008;454(7203):463–469. doi: 10.1038/nature07206. [DOI] [PMC free article] [PubMed] [Google Scholar]
- 33.Charos AE, et al. A highly integrated and complex PPARGC1A transcription factor binding network in HepG2 cells. Genome Res. 2012;22(9):1668–1679. doi: 10.1101/gr.127761.111. [DOI] [PMC free article] [PubMed] [Google Scholar]
- 34.St-Pierre J, et al. Suppression of reactive oxygen species and neurodegeneration by the PGC-1 transcriptional coactivators. Cell. 2006;127(2):397–408. doi: 10.1016/j.cell.2006.09.024. [DOI] [PubMed] [Google Scholar]
- 35.Valle I, Alvarez-Barrientos A, Arza E, Lamas S, Monsalve M. PGC-1alpha regulates the mitochondrial antioxidant defense system in vascular endothelial cells. Cardiovasc Res. 2005;66(3):562–573. doi: 10.1016/j.cardiores.2005.01.026. [DOI] [PubMed] [Google Scholar]
- 36.Lu Z, et al. 2010. PGC-1 alpha regulates expression of myocardial mitochondrial antioxidants and myocardial oxidative stress after chronic systolic overload. Antioxid Redox Signal 13(7):1011–1022.
- 37.Kouda K, et al. Dietary restriction: Effects of short-term fasting on protein uptake and cell death/proliferation in the rat liver. Mech Ageing Dev. 2004;125(5):375–380. doi: 10.1016/j.mad.2004.02.006. [DOI] [PubMed] [Google Scholar]
- 38.Delvaux G, Caes F, Willems G. Refeeding of fasting rats stimulates epithelial cell proliferation in the excluded colon. Gastroenterology. 1984;86(5 Pt 1):802–807. [PubMed] [Google Scholar]
- 39.Phillips TL, Wachtel LW. 1968. Suppression of cellular proliferation in weanling rat kidneys by short-term fasting. Proc Soc Exp Biol Med 128(2):566–570.
- 40.Inouye S, et al. Impaired IgG production in mice deficient for heat shock transcription factor 1. J Biol Chem. 2004;279(37):38701–38709. doi: 10.1074/jbc.M405986200. [DOI] [PubMed] [Google Scholar]
- 41.Nishizawa S, et al. Regeneration of injured skeletal muscle in heat shock transcription factor 1-null mice. Physiol Rep. 2013;1(3):e00071. doi: 10.1002/phy2.71. [DOI] [PMC free article] [PubMed] [Google Scholar]
- 42.Xiao X, et al. HSF1 is required for extra-embryonic development, postnatal growth and protection during inflammatory responses in mice. EMBO J. 1999;18(21):5943–5952. doi: 10.1093/emboj/18.21.5943. [DOI] [PMC free article] [PubMed] [Google Scholar]
- 43.Gerhart-Hines Z, et al. Metabolic control of muscle mitochondrial function and fatty acid oxidation through SIRT1/PGC-1alpha. EMBO J. 2007;26(7):1913–1923. doi: 10.1038/sj.emboj.7601633. [DOI] [PMC free article] [PubMed] [Google Scholar]
- 44.Vazquez F, et al. PGC1α expression defines a subset of human melanoma tumors with increased mitochondrial capacity and resistance to oxidative stress. Cancer Cell. 2013;23(3):287–301. doi: 10.1016/j.ccr.2012.11.020. [DOI] [PMC free article] [PubMed] [Google Scholar]
- 45.Shiota M, et al. Peroxisome proliferator-activated receptor gamma coactivator-1alpha interacts with the androgen receptor (AR) and promotes prostate cancer cell growth by activating the AR. Mol Endocrinol. 2010;24(1):114–127. doi: 10.1210/me.2009-0302. [DOI] [PMC free article] [PubMed] [Google Scholar]
- 46.D’Errico I, et al. Bax is necessary for PGC1α pro-apoptotic effect in colorectal cancer cells. Cell Cycle. 2011;10(17):2937–2945. doi: 10.4161/cc.10.17.16791. [DOI] [PubMed] [Google Scholar]
- 47.D’Errico I, et al. Peroxisome proliferator-activated receptor-gamma coactivator 1-alpha (PGC1alpha) is a metabolic regulator of intestinal epithelial cell fate. Proc Natl Acad Sci USA. 2011;108(16):6603–6608. doi: 10.1073/pnas.1016354108. [DOI] [PMC free article] [PubMed] [Google Scholar]
- 48.Jiang WG, Douglas-Jones A, Mansel RE. 2003. Expression of peroxisome-proliferator activated receptor-gamma (PPARgamma) and the PPARgamma co-activator, PGC-1, in human breast cancer correlates with clinical outcomes. International Journal of Cancer 106(5):752–757.
- 49.Feilchenfeldt J, Bründler MA, Soravia C, Tötsch M, Meier CA. Peroxisome proliferator-activated receptors (PPARs) and associated transcription factors in colon cancer: Reduced expression of PPARgamma-coactivator 1 (PGC-1) Cancer Lett. 2004;203(1):25–33. doi: 10.1016/j.canlet.2003.08.024. [DOI] [PubMed] [Google Scholar]
- 50.Wang X, Moraes CT. Increases in mitochondrial biogenesis impair carcinogenesis at multiple levels. Mol Oncol. 2011;5(5):399–409. doi: 10.1016/j.molonc.2011.07.008. [DOI] [PMC free article] [PubMed] [Google Scholar]
- 51.Martínez-Jiménez CP, Gómez-Lechón MJ, Castell JV, Jover R. Underexpressed coactivators PGC1alpha and SRC1 impair hepatocyte nuclear factor 4 alpha function and promote dedifferentiation in human hepatoma cells. J Biol Chem. 2006;281(40):29840–29849. doi: 10.1074/jbc.M604046200. [DOI] [PubMed] [Google Scholar]
- 52.Luo J, et al. A protocol for rapid generation of recombinant adenoviruses using the AdEasy system. Nat Protoc. 2007;2(5):1236–1247. doi: 10.1038/nprot.2007.135. [DOI] [PubMed] [Google Scholar]
- 53.Wallberg AE, Yamamura S, Malik S, Spiegelman BM, Roeder RG. Coordination of p300-mediated chromatin remodeling and TRAP/mediator function through coactivator PGC-1alpha. Mol Cell. 2003;12(5):1137–1149. doi: 10.1016/s1097-2765(03)00391-5. [DOI] [PubMed] [Google Scholar]
- 54.Dignam JD, Lebovitz RM, Roeder RG. Accurate transcription initiation by RNA polymerase II in a soluble extract from isolated mammalian nuclei. Nucleic Acids Res. 1983;11(5):1475–1489. doi: 10.1093/nar/11.5.1475. [DOI] [PMC free article] [PubMed] [Google Scholar]
- 55.Huang W, Sherman BT, Lempicki RA. Systematic and integrative analysis of large gene lists using DAVID bioinformatics resources. Nat Protoc. 2009;4(1):44–57. doi: 10.1038/nprot.2008.211. [DOI] [PubMed] [Google Scholar]