

Abstract
High-affinity extrasynaptic GABAA receptors are persistently activated by the low ambient GABA levels that are known to be present in extracellular space. The resulting tonic conductance generates a form of shunting inhibition that is capable of altering cellular and network behavior. It has been suggested that this tonic inhibition will be enhanced by neurosteroids, antiepileptics, and sedative/hypnotic drugs. However, we show that the ability of sedative/hypnotic drugs to enhance tonic inhibition in the mouse cerebellum will critically depend on ambient GABA levels. For example, we show that the intravenous anesthetic propofol enhances tonic inhibition only when ambient GABA levels are <100 nm. More surprisingly, the actions of the sleep-promoting drug 4,5,6,7-tetrahydroisothiazolo-[5,4-c]pyridin-3-ol (THIP) are attenuated at ambient GABA levels of just 20 nm. In contrast, our data suggest that neurosteroid enhancement of tonic inhibition will be greater at high ambient GABA concentrations. We present a model that takes into account realistic estimates of ambient GABA levels and predicted extrasynaptic GABAA receptor numbers when considering the ability of sedative/hypnotic drugs to enhance tonic inhibition. These issues will be important when considering drug strategies designed to target extrasynaptic GABAA receptors in the treatment of sleep disorders and other neurological conditions.
Introduction
Synaptic release of GABA results in the activation of low-affinity ligand-gated ion channels [GABAA receptors (GABAARs)] and/or G-protein-coupled receptors close to the release site. These synaptic conductance changes can modify signal integration and network behavior (Freund and Katona, 2007; Klausberger and Somogyi, 2008). In a number of brain regions, high-affinity extrasynaptic GABAARs can be persistently activated by the ambient GABA present in the extracellular space (Farrant and Nusser, 2005; Glykys and Mody, 2007; Herd et al., 2009). This tonic inhibition can alter neuronal excitability both in vitro (Brickley et al., 2001) and in vivo (Chadderton et al., 2004). Disturbances in tonic inhibition are associated with a number of neurological disorders including depression (Maguire and Mody, 2008), schizophrenia (Maldonado-Avilés et al., 2009), and forms of epilepsy (Maguire et al., 2005; Cope et al., 2009). It is therefore not surprising that extrasynaptic GABAARs are emerging as clinical drug targets (Brickley and Mody, 2012).
Propofol may enhance tonic inhibition (Orser et al., 1994) because of its ability to allosterically modulate GABAARs (Hales and Lambert, 1991). Anesthetic concentrations of propofol (1–5 μm) produce a leftward shift in the GABA concentration–response relationship that is not associated with an increase in the maximum response (Franks, 2008). When receptors are fully occupied by GABA the maximum peak response is attained and no anesthetic enhancement is possible. At synapses, full occupancy is not a feature of GABA binding to low-affinity GABAARs because of the very brief nature of the GABA profile relative to the slow rate of GABA binding (Barberis et al., 2011). In contrast, full receptor occupancy could be a feature of high-affinity extrasynaptic GABAARs, and propofol modulation of tonic inhibition could be attenuated at high ambient GABA concentrations.
4,5,6,7-Tetrahydroisothiazolo-[5,4-c]pyridin-3-ol (THIP; also known as gaboxadol) is an experimental sleep-promoting drug (Wafford and Ebert, 2006) that enhances tonic inhibition because of its “super agonist” action on extrasynaptic GABAARs (Brown et al., 2002). However, THIP's greater efficacy compared with GABA is based on peak concentration–response curves and has not been established at steady state. We have recently shown that, contrary to expectations, extrasynaptic GABAARs exhibit profound levels of steady-state desensitization (Bright et al., 2011). In addition, THIP and GABA compete for the same binding site, but the apparent affinity of extrasynaptic GABAARs for GABA is much higher. We have therefore examined THIP's ability to enhance tonic inhibition when ambient GABA is altered.
Neurosteroids enhance tonic inhibition in a number of brain regions, and gene knock-out studies suggest that GABAARs containing the δ subunit are a principle target for neurosteroids (Belelli and Herd, 2003; Spigelman et al., 2003; Stell et al., 2003; Cope et al., 2005). Compared with other agonists, GABA has high affinity but low efficacy at extrasynaptic GABAARs. Allosteric modulation of extrasynaptic GABAARs by neurosteroids reflects an increased probability of channel opening caused by enhanced GABA efficacy (Bianchi and Macdonald, 2003) and is therefore expected to occur regardless of ambient GABA levels. The aim of this study was to establish how variations in ambient GABA levels may affect the ability of these drugs to modulate tonic inhibition.
Materials and Methods
Recombinant expression.
Cell cultures were grown to 70–80% confluence and maintained at 37°C in 5% CO2. The culture medium (essential DMEM) was supplemented with 1% nonessential amino acids, 10% heat-inactivated FBS, 1% penicillin (10,000 U/ml)/streptomycin (10 mg/ml), and 200 mm l-glutamine. A modified HEK cell line transformed with the large T antigen from SV40 (HEK293T) was used to promote high-level episomal replication of plasmid DNA (Ali and DeCaprio, 2001). All plasmids contained the ampicillin resistance gene for selection during routine plasmid preparation, a cytomegalovirus promoter for high protein expression, and the SV40 early promoter. Mouse cDNA encoding the α6, β2, β3, and δ GABAAR subunits was subcloned into the pRK5 vector. The human α1 and γ2S cDNA constructs were subcloned into the pcDNA3.1 vector. HEK293T cells were transiently transfected with the appropriate GABAAR subunit cDNA by using a calcium phosphate technique (Chen and Okayama, 1987). The N terminus of the δ subunit was labeled with the fluorescent tag super ecliptic pHluorin (δSEP). This GFP variant has a pKa of ∼7.1 (Ashby et al., 2004), enabling surface expression to be confirmed with extracellular pH shifts. Using this approach we established the optimal ratio for recombinant expression of α6, β2, β3, and δ GABAAR subunits to be of 1α:1β:1δ and also confirmed δ-subunit incorporation into the assembly by assaying zinc and THIP sensitivity of the resulting receptors (Bright et al., 2011). In the absence of δSEP, HEK293T cells were cotransfected with an equal amount of reporter cDNA-encoding GFP to positively identify transfected cells. Transfected cells were plated onto poly-d-lysine-coated coverslips and kept in a humidified incubator overnight before electrophysiological recording experiments.
Acute slice preparations.
Male adult (35 ± 6 d postnatal) C57BL/6J mice were killed by cervical dislocation followed by decapitation. The brain was rapidly removed and immersed in ice-cold slicing solution (slicing ACSF contained the following (in mm): 2.5 KCl, 1 CaCl2, 5 MgCl, 1.25 NaH2PO4, 26 NaHCO3, 11 glucose, and 250 glycerol) bubbled with 95%O2/5%CO2. The cerebellum was detached from the forebrain, and brain slices were produced with a vibratome tissue slicer (Campden Instruments). Sagittal slices were cut at a thickness of 250 μm and immediately transferred to a holding chamber containing slicing ACSF continuously bubbled with 95%O2/5%CO2. Once slicing was complete the holding chamber was transferred to a 37°C heat block for 40 min after which the slicing ACSF was gradually exchanged for recording ACSF [which contained the following (in mm): 125 NaCl, 2.5 KCl, 2 CaCl2, 2 MgCl, 1.25 NaH2PO4, 26 NaHCO3, and 11 glucose; pH 7.4 when bubbled with 95%O2/5%CO2] and allowed to reach room temperature while the solutions were exchanged before electrophysiological recording experiments.
Electrophysiology.
HEK293T cells and cerebellar neurons were visualized by using a fixed-stage upright microscope (BX51W1; Olympus) fitted with a high numerical aperture (NA) water-immersion objective (Leica 40/63×), GFP epifluorescence, and a digital camera. The recording chamber was continuously perfused with the appropriate external solution. Solution entered the bath via a gravity perfusion system at a rate of 3 ml/min. Patch pipettes were fabricated from thick-walled borosilicate glass capillaries (1.5 mm outer diameter, 0.86 mm inner diameter; Harvard Apparatus) using a two-step vertical puller (Narishige PC-10). Pipette resistances were typically <8 MΩ when back-filled with internal solution. The internal solution contained the following (in mm): 140 CsCl, 4 NaCl, 0.5 CaCl2, 10 HEPES, 5 EGTA, and 2 Mg-ATP; the pH was adjusted to 7.3 with CsOH, and QX-314 (100 μm) was added to block voltage-gated sodium channels. Biocytin (1.5 mg/ml) (Sigma) was also included in the pipette solution to allow confocal imaging of filled neurons (see below). The amplifier headstage was connected to an Axopatch 200B or 700B amplifier (Molecular Devices). Fine and course movements of the pipettes were controlled by micromanipulators (PatchStar; Scientifica) mounted on a fixed platform. The amplifier current output was filtered at 10 kHz (−3 dB, eight-pole low-pass Bessel) and digitized at 50 kHz by using a National Instruments digitization board (NI-DAQmx, PCI-6052E). Data acquisition was performed by using WINWCP (version 4.1.2) and WINEDR (version 3.0.9), kindly provided by John Dempster (University of Strathclyde, Glasgow, UK).
Drug application.
Direct drug application close to HEK293T cells and cerebellar neurons was performed with a gravity-fed system via an eight-unit solenoid driver controlled via analog pulses produced from the WinEDR software. Up to eight different solutions flowed into a small-diameter manifold tip placed close to the cell by using a manual micromanipulator. Bath application of drugs also used a gravity perfusion system with a flow rate of at least 3 ml/min into a total bath volume of 2.4 ml. Solutions were transferred to the bath via polytetrafluoroethylene tubing and removed from the bath via a suction line connected to a peristaltic pump (Pharmacia Biotech P-1).
Confocal imaging.
After electrophysiological recording, slices were fixed in PBS containing 4% paraformaldehyde for 24 h. Biocytin-filled neurons were conjugated to a streptavadin-linked Alexa Fluor 555 dye (Invitrogen) at 1:200 dilution in 1% serum and 0.2% Triton-X at room temperature for 3–4 h. Slices were washed in PBS and mounted in Vectashield medium (Vector Laboratories) on glass slides with a 13-mm-thick borosilicate glass cover (VWR International). A Zeiss LSM 510 upright confocal microscope fitted with a HeNe 543 nm laser was used for excitation of the Alexa 555 dye by using a 40×/1.3 NA oil-immersion objective with emitted fluorescence passing through a 475 nm long-pass filter. The pinhole size was set to 1 Airy unit such that the minimal z-distance was determined according to the equation: zmin = 2λ0η/NA2, where η is the refractive index of the object medium and λ0 is the emission wavelength. For these experiments, zmin was 1.02 μm. The number of optical slices was determined after setting the depth of the first and last optical sections. Image pixel spacing was 112.47 nm with 1024 pixels in both the x- and y-planes, and a scan speed was set to 9.3 s per optical section. Because of differences in fluorescent intensity it was necessary to image the soma and neurites at different laser intensities to avoid saturation. To reduce background noise, a 4× frame-averaging protocol was implemented. Each optical section was then imported into the software program ImageJ (version 1.44), and a theoretical point spread function (PSF) was used for deconvolution of the images. The theoretical PSF was calculated from the numerical aperture of the lens, the refractive index of the immersion medium, pixel size, and the image size in the x-, y-, and z-planes. The images obtained after blind deconvolution were imported into Reconstruct (version 1.0.9.6) (Fiala, 2005) for 3D representation of each filled neuron. This software was also used to measure the surface area of the soma, dendrites, and axon of each filled neuron according to the simple relationship σSA = Σall sections length × section thickness, where length was the perimeter of the object under examination and section thickness was 1.02 μm.
Membrane capacitance estimates.
An estimate of total membrane capacitance (Cm) was obtained from voltage-clamp data according to the relationship Cm = Q/ΔV, where Q is the charge transfer measured from the current record during a hyperpolarizing 10 mV step in the amplifiers command voltage (ΔV). Q was calculated from an average of 20 consecutive current transients recorded immediately after breakthrough into whole-cell configuration at a command voltage of −60 mV. The resulting estimate of Cm directly correlated with membrane surface area assuming that ΔV influenced all regions of the cell uniformly and the lipid bilayer had a similar capacitance per unit area in all membrane compartments. All conductance estimates were normalized to Cm to control for differences in cell size.
Tonic conductance measurements.
Membrane currents were episodically sampled before and after cell breakthrough to estimate the membrane capacitance (see above), series resistance, and tonic GABAAR-mediated conductance throughout the experiment. Changes in membrane current were recorded continuously by using a voltage protocol that produced a 10 mV voltage step followed by a voltage ramp from −90 to +10 mV over a 200 ms epoch. Before breakthrough this protocol was used to estimate seal resistance, and after breakthrough it was used to estimate series and access resistance. The voltage ramp was used to measure a reversal potential for the net current flux. Chloride loading of the cell immediately after breakthrough was used to estimate the tonic GABA conductance at the beginning of the recording session, and this estimate was compared with the tonic GABA conductance measured from the blocking action of 40 μm SR95531 at the end of the recording session. During experiments on cerebellar granule cells, glutamate receptors were blocked with the non-NMDA receptor blocker CNQX (5 μm). To calculate the tonic conductance, all-point histograms of the current record were constructed at a command voltage of −60 mV, and differences in the peak amplitude measured from a single Gaussian fit were used to calculate the amplitude of the standing inward current before and after breakthrough and also in the presence of 100 μm SR95531. The reversal potential of the membrane current was also used to assay any change in nonspecific leak during the recording session. In this way we could be confident that any drug-induced change in holding current observed during the recording session was caused by an action on GABAAR-mediated conductances.
Drug sensitivity.
Propofol stock solutions were prepared with a final DMSO concentration of <0.001%. For consistency, 0.001% DMSO was used in all control and GABA solutions. However, the application of external solution containing 0.001% DMSO to HEK293T cells had no effect on the holding current (data not shown). Propofol at 1.5 μm has been shown to potentiate GABAARs in acute slice preparations (Zecharia et al., 2009) while having no direct agonist effect. No direct effect on the baseline current was seen when 1.5 μm propofol was applied in the absence of GABA to α6βδ GABAAR-expressing HEK293T cells (data not shown). Concentration–response data were fitted to a standard Hill equation of the form:
 |
where Vmax is the maximum response, [GABA] is the GABA concentration, EC50 is the GABA concentration that elicits a half-maximal response, and n is the Hill coefficient.
Kinetic schemes.
Kinetic modeling of GABAARs was performed by using ChanneLab version 2 (Synaptosoft Inc). The kinetic scheme and rate constants were based on work described previously (Jones and Westbrook, 1996). This model was modified with the presence of four additional states that mimicked anesthetics binding with equal affinity to both the open and desensitized states. The on and off rates for these propofol-bound states were set at 1 × 10⁷ m−1·s−1 and 10 s−1 to give a KD of 1 μm. Steady-state whole-cell responses were simulated with the number of channels set as 100 and a holding current of −100 mV. Steady-state conductance was calculated from the sum of the two open states (O1 and O2), each with a single-channel conductance of 30 pS (Jones and Westbrook, 1996).
Statistical analysis.
Distributions were compared by using Origin 8.5 (Microcal) using unconstrained least-squared fitting procedures, and statistical tests were performed at a 95% confidence level.
Results
Propofol modulation of tonic inhibition depends on GABAAR occupancy
Propofol is believed to exert its action on GABAARs by shifting the equilibrium in favor of anesthetic-bound states (Franks, 2008). We used this simple idea to predict the behavior of extrasynaptic GABAARs during steady-state GABA binding. To avoid arbitrary adjustment of rate constants (Bai et al., 1999; Li and Pearce, 2000), propofol was treated as simply binding with equal affinity (KD = 1 μm) to the two open and two desensitized states of the GABAAR kinetic scheme (Jones and Westbrook, 1996) (Fig. 1A). This model replicates all of the key actions of propofol such as prolongation of deactivation and a parallel leftward shift in the GABA concentration–response curve (Franks, 2008). Consistent with these actions, the model predicts that propofol enhancement of steady-state responses will be lost at low ambient GABA concentrations (Fig. 1C). We first tested this prediction on recombinant receptors of known subunit composition under experimental conditions where ambient GABA levels could be controlled (Fig. 2A). α6β2δ-containing GABAARs clearly exhibit considerable steady-state desensitization (Bright et al., 2011) even when the true peak response has been attenuated to some degree. Once the GABA response had reached steady state, 1.5 μm propofol was coapplied, and the steady-state conductance was calculated from single Gaussian fits to all-point histograms (Fig. 2B). On average, 1.5 μm propofol potentiated sub-EC50 GABA responses by 34.5 ± 11.3% (n = 4), 30.0 ± 12.5% (n = 5), and 29.7 ± 11.5% (n = 6) at 15, 30, and 50 nm GABA concentrations, respectively. However, at the EC50 concentration (250 nm GABA) propofol enhancement was absent (3.4 ± 11.1%; n = 6). Removal of propofol enhancement was also seen at a saturating steady-state GABA concentration of 1 μm (1.4 ± 14.4%; n = 6). As summarized in Figure 2C, and consistent with our prediction, propofol enhancement of the steady-state conductance was lost when ambient GABA concentrations rose above 100 nm. Although this is a surprisingly low GABA concentration, it is within the expected limits of ambient GABA concentrations reported to be present in the brain (see Discussion).
Figure 1.

A computational model predicts that propofol enhancement of the steady-state GABA response will be lost as ambient GABA concentrations rise. A, Illustration of a modified kinetic scheme (Jones and Westbrook, 1996) that incorporates four additional propofol-bound states (PO1, PO2, PD1, and PD2) that emanate from the two open states (O1 and O2) and the two desensitized states (D1 and D2). Each of these anesthetic-bound states has a KD of 1 μm. B, Plot of open probability (note the log scale) for all open states (O1, O2, PO1, and PO2) during the application of GABA and propofol to a total of 100 channels. In these simulations, GABA was first added alone (0–20 s) and then in the presence of 1.5 μm propofol (20–40 s). The three superimposed traces were obtained with 100 nm and 1 and 10 μm GABA concentrations. C, The change in open probability of the peak (solid line) and steady-state (dashed line) response estimated after the addition of 1.5 μm propofol is plotted as a function of the GABA concentration from 1 nm to 1 mm. These data were obtained from simulations of the type shown in B. It is clear from these data that propofol enhancement of the steady-state response (solid line) is lost at lower GABA concentrations than that calculated for the peak response (dashed line).
Figure 2.

Propofol's ability to enhance the steady-state GABA response generated by recombinant α6β2δ subunit-containing GABAARs is lost when the GABA concentration is raised >100 nm. A, Whole-cell voltage-clamp recording from HEK cells transfected with α6β2δ GABAARs at a command voltage of −60 mV during the application of GABA and propofol. The steady-state current observed after 30 nm GABA application (left) was clearly enhanced by the application of 1.5 μm propofol (right). A break in the current record has been introduced to allow for equilibrium of propofol to be achieved. A larger peak response was observed with a 1 μm GABA application, but the steady-state response was not enhanced by the subsequent application of 1.5 μm propofol. B, All-point histogram constructed from the steady-state conductance estimates obtained from the two experiments illustrated in A. These data were well described by single Gaussian fits. C, The peak values obtained from the Gaussian fits shown in B were used to calculate propofol enhancement at different steady-state GABA concentrations. The mean (±SEM) propofol enhancement at each steady-state GABA concentration (●) was plotted (n = 6 cells), and a Hill fit (sold line) was applied to these data to estimate an EC50 value of 100 nm at which propofol enhancement was lost.
We also examined propofol modulation of the tonic conductance recorded from neurons within the internal granule cell layer of the adult cerebellum, where δ subunit-containing GABAAR expression is specific to granule cells (Shivers et al., 1989; Laurie et al., 1992; Nusser et al., 1998; Brickley et al., 2001). As shown in Figure 3A, addition of the GABAAR antagonist SR95531 (40 μm) blocked the tonic conductance recorded from a morphologically identified granule cell but did not alter the baseline conductance in a morphologically identified unipolar brush cell (Fig. 3B). Morphological identification of a typical granule cell is shown in Figure 3C, and a unipolar brush cell is shown in Figure 3D. Next, we attempted to alter ambient GABA levels within the slice preparation by reducing the frequency of vesicular GABA release. As shown in Figure 3E, the mean frequency of spontaneous IPSCs was 1.9 ± 0.5 Hz (n = 16), but when action potential-dependent GABA release was blocked with 500 nm TTX the mean frequency of miniature IPSCs was reduced to 0.5 ± 0.1 Hz (n = 14). Lowering vesicular GABA release also halved the tonic conductance (ANOVA, p = 0.02) from 126 ± 24 to 56 ± 8 pS/pF in TTX. Having established a relationship between vesicular GABA release and the tonic conductance, 1.5 μm propofol was applied to granule cells in situations of altered GABA release (Fig. 3F–H). Under normal conditions the average enhancement of the tonic conductance was 46 ± 9% (n = 9), but when GABA release was reduced with TTX the enhancement was significantly increased to 163 ± 29% (n = 7). The reason for the greater degree of propofol enhancement of GABAARs recorded from native neurons (in TTX) compared with recombinant receptors (Fig. 2C) is not clear. This may reflect the presence of a lower ambient GABA concentration in the acute slice, lower receptor occupancy, or a greater intrinsic propofol sensitivity of native receptors. However, as predicted from our kinetic model, and confirmed with recombinant expression studies, propofol's ability to enhance tonic inhibition is extremely sensitive to fluctuations in ambient GABA levels.
Figure 3.
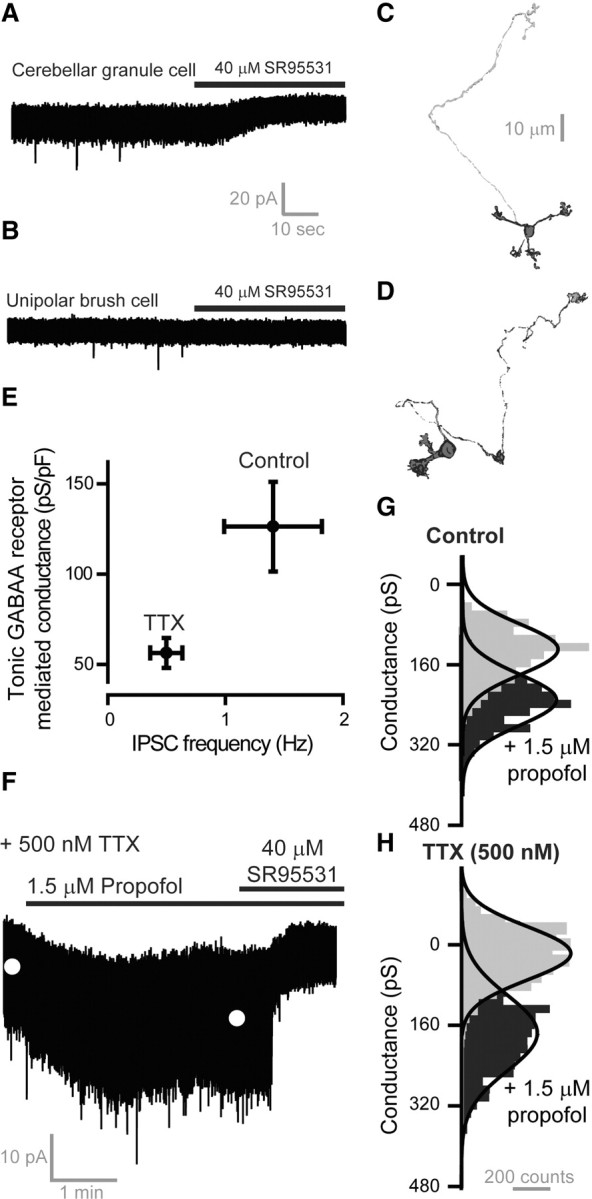
Propofol's ability to potentiate the tonic conductance recorded from adult cerebellar granule cells is attenuated when ambient GABA levels are high. A, B, Whole-cell voltage-clamp recordings from a cerebellar granule cell (A) and a unipolar brush cell (B) are shown at a command voltage of −60 mV during the application of the GABAAR antagonist SR95531 (40 μm). The solid bars illustrate the drug application period demonstrating a clear reduction in the holding current recorded from the granule cell but no change in the holding current recorded from the unipolar brush cell. Cells were filled with biocytin during whole-cell recording, and a streptavadin-Alexa 555 conjugation was used to visualize the cell with confocal imaging. C, D, Morphological data obtained from a granule cell (C) and a unipolar brush cell (D) is shown. The characteristic morphological features of these cells is apparent in these two images. E, The mean (±SEM) tonic conductance and IPSC frequency is plotted for all granule cells recorded in control conditions (n = 16 cells) and in the presence of 500 nm TTX (n = 14 cells) to block action potential-dependent vesicular GABA release. It is clear from these data that a reduction in the magnitude of the tonic conductance is associated with a reduction in GABA release. F, The current trace illustrates the ability of 1.5 μm propofol to enhance the tonic conductance recorded in the presence of 500 nm TTX. The white circles indicate the mean amplitude of the holding current recorded in control conditions and in the presence of propofol. These estimates were obtained from Gaussian fits to the all-point histograms of type shown in G and H. G, H, The all-point histograms shown have been normalized to the mean conductance observed in the presence of 40 μm SR95531. G, Control. H, TTX. It is clear from these data that propofol enhancement is significantly greater in TTX conditions where ambient GABA levels in the slice are predicted to be low.
THIP modulation of tonic inhibition similarly depends on GABAAR occupancy
This relationship between ambient GABA concentration and the actions of an allosteric modulator such as propofol is not expected of a drug such as THIP that is considered to be a super agonist compared with GABA at δ subunit-containing GABAARs (Brown et al., 2002; Mortensen et al., 2010). Indeed, consistent with previous reports (Lindquist et al., 2003; Stórustovu and Ebert, 2006), 500 nm THIP gives a robust response at α6β2δ-containing GABAARs (Fig. 4A), but gives no significant response at α1βγ2s-containing GABAARs (208 ± 36 pS/pF, n = 24 vs 32 ± 96 pS/pF, n = 7). However, preapplication of GABA greatly attenuated the THIP-activated conductance (Fig. 4A). Even in the presence of 50 nm GABA, the THIP-activated conductance was reduced by 70% with a mean steady-state conductance of 60 ± 30 pS/pF (n = 9). At 1 μm GABA the THIP-activated conductance was completely attenuated with a mean steady-state conductance of −9 ± 7 pS/pF (n = 7). A Hill fit to these data predicted that a THIP-activated conductance would be 50% attenuated at an ambient GABA concentration of just 20 nm.
Figure 4.
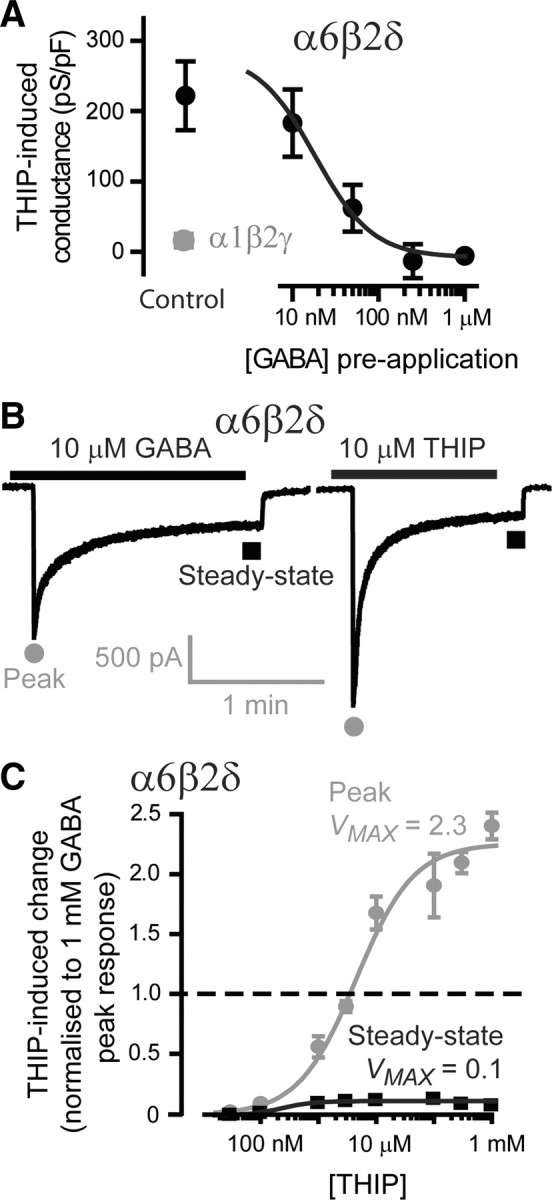
THIP is a selective agonist for α6β2δ subunit-containing GABAARs, but under steady-state conditions THIP is not a super agonist. A, A plot of the mean (±SEM) steady-state conductance calculated for α1β2γ and α6β2δ subunit-containing GABAARs exposed to 500 nm THIP. A measurable THIP-induced conductance was observed for recombinant receptors of the α6β2δ type (n = 24 cells), but this conductance was not apparent for α1β2γ receptors (n = 7 cells), which is consistent with the reported subunit selectivity of THIP. Different concentrations of GABA were preapplied to HEK cells expressing α6β2δ receptors, and the magnitude of the THIP-induced conductance was then measured. The mean (±SEM) THIP-induced conductance is plotted as a function of the steady-state GABA concentration (n = 9 cells). These data points were well described by the Hill equation with an EC50 GABA concentration of 20 nm. Attenuation of the THIP-induced conductance was apparent at GABA concentrations as low as 10 nm. B, Whole-cell recordings obtained from α6β2δ subunit-containing GABAARs illustrating the peak (gray circles) and steady-state (black squares) response to 10 μm GABA and 10 μm THIP. C, Concentration–response curves obtained from α6β2δ subunit-containing GABAARs exposed to varying concentrations of THIP (n = 10 cells). All data points were normalized to the maximum peak response measured at 1 mm GABA (n = 22 cells). The mean (±SEM) peak (gray circles) and steady-state (black squares) responses were well described by the Hill equation with an EC50 of 4.5 μm for the peak response and an EC50 of 240 nm for the steady-state response. These EC50 values are similar to those previously reported (Mortensen et al., 2010). Vmax for the THIP peak response curve was 2.3, which is consistent with THIP acting as a super agonist relative to GABA (dashed black line indicates the peak GABA response). However, under steady-state conditions this action was not observed, and the Vmax for the steady-state concentration–response curve for THIP was 0.1 compared with 0.2 for GABA.
These observations prompted us to re-evaluate the GABA and THIP concentration–response relationship of α6β2δ-containing GABAARs. A typical response from the same cell to 10 μm GABA and 10 μm THIP is shown in Figure 4B with the peak and steady-state responses highlighted. On average, the peak response to 10 μm THIP was 11.4 ± 5.2 nS/pF (n = 10) compared with only 4.0 ± 0.9 nS/pF (n = 22) in response to 10 μm GABA. Therefore, THIP could be termed a super agonist at α6βδ receptors when considering peak responses (Stórustovu and Ebert, 2006). However, it is also clear that α6β2δ GABAARs exhibit considerable desensitization such that the steady-state response to 10 μm THIP was no greater than that observed for 10 μm GABA. To highlight this observation, the average data for THIP have been normalized to the 1 mm GABA peak response and plotted in Figure 4C. A Hill fit to the steady-state GABA responses for α6β2δ GABAARs resulted in a Vmax of 0.1 for THIP compared with a Vmax of 0.2 for GABA. Therefore, contrary to the situation reported for peak responses, THIP should not be considered a super agonist under steady-state conditions.
Ambient GABA levels and THIP enhancement of tonic inhibition
As expected, a robust THIP-activated conductance (Fig. 5A) was elicited in adult cerebellar granule neurons (208 ± 20 pS/pF; n = 42), and this response was absent in neurons that lacked δ subunit-containing extrasynaptic GABAARs. For example, 500 nm THIP did not significantly change the holding current of cerebellar Golgi cells that also reside within the internal granule cell layer (mean THIP-activated conductance: 2.8 ± 2.0 pS/pF; n = 6). Addition of 10 μm GABA to the recording ACSF significantly enhanced the tonic conductance recorded from granule neurons by 125 ± 33 pS/pF (n = 12). However, as shown in Figure 5B, this preapplication of GABA attenuated any subsequent THIP-activated conductance in a concentration-dependent manner. Indeed, preapplication of 100 μm GABA resulted in a complete loss of any THIP-induced conductance (Fig. 5C). The magnitude of the THIP-activated conductance was then assayed after alterations in the rate of vesicular GABA release within the slice preparation. As shown in Figure 5D, the THIP-activated conductance was larger under conditions of reduced GABA release (TTX). These differences were significant (ANOVA, p = 0.03) and the mean THIP-activated conductance was 61.8 ± 20.5 pS/pF (n = 9) in normal conditions compared with 154.3 ± 28.6 pS/pF (n = 8) when GABA release was reduced with TTX. Therefore, in a similar manner to propofol, the THIP-induced conductance was highly sensitive to fluctuations in ambient GABA levels.
Figure 5.
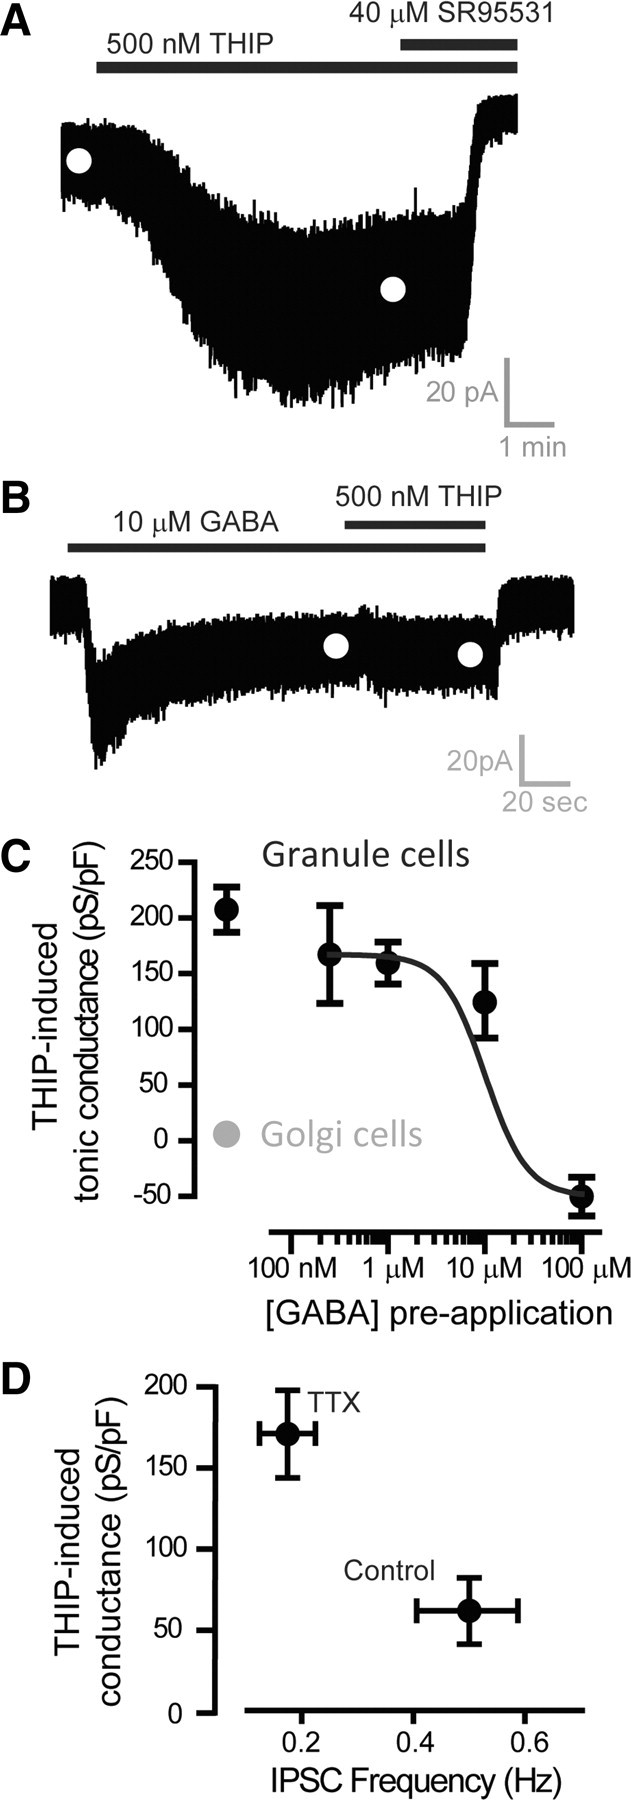
The ability of THIP to enhance the tonic conductance in cerebebellar granule cells is attenuated at high ambient GABA concentrations. A, Whole-cell recording from an adult cerebellar granule cell voltage-clamped at −60 mV during the application of 500 nm THIP followed by the coapplication of 40 μm SR95531 to block all GABAARs. The white circles illustrate the mean holding current calculated from Gaussian fits to all-point histograms similar to those illustrated in Figure 2B. B, Another whole-cell recording from an adult cerebellar granule cell during the application of 10 μm GABA and the coapplication of 500 nm THIP. The white circles illustrate the mean holding current calculated from Gaussian fits to all-point histograms. It is clear from this current record that the THIP-induced conductance is markedly attenuated by preapplication of GABA. C, Plot of the mean (±SEM) THIP-induced conductance for adult cerebellar granule cells as a function of the preapplied GABA concentration (n = 12 cells). For comparison, data obtained from cerebellar Golgi cells (gray circle; n = 6 cells) have also been plotted to illustrate the selectivity of this agonist for δ subunit-containing GABAARs. D, Plot of the mean (±SEM) THIP-induced conductance recorded in control (n = 8 cells) and in the presence of 500 nm TTX (n = 9 cells) to block action potential-dependent vesicular GABA release. The mean IPSC frequency was also calculated under these conditions to illustrate the reduction in vesicular GABA release that occurs in the presence of TTX.
Neurosteroid modulation of tonic inhibition is not influenced by vesicular GABA release
As shown in Figure 6A, the endogenous neurosteroid tetrahydrodeoxycorticosterone (THDOC) can also potently enhance the steady-state conductance mediated by α6β2δ subunit-containing GABAARs. However, contrary to the results described for other drugs examined in this study, the actions of THDOC (10 nm) and alphaxalone (30 nm) on α6β2δ subunit-containing GABAARs were enhanced in a dose-dependent manner by preapplication of GABA (Fig. 6B). The ability of two neurosteroids to enhance tonic inhibition in cerebellar granule neurons has been examined at different ambient GABA concentrations. As shown in Figure 7, A and B, 100 nm ganaxolone potently enhanced tonic inhibition even when the ambient GABA level was raised with the addition of 100 μm GABA to the recording ACSF. Similarly, the alphaxalone-induced tonic conductance (64.6 ± 10.5 pS/pF; n = 6), was of a similar magnitude when ambient GABA levels were lowered with TTX in the slice preparation (ANOVA, p = 0.5). Analysis of spontaneous IPSC parameters recorded during these experiments further showed that at this concentration of alphaxalone there was no modulation of IPSC amplitude (ACSF, 30.1 ± 5.5 pA; alphaxalone, 28.3 ± 3.1 pA; ANOVA p = 0.8), decay time (ACSF, 8 ± 1.1 ms; alphaxalone, 9.3 ± 1.1 ms; ANOVA p = 0.4), or frequency (ACSF, 1.8 ± 0.5 Hz; alphaxalone, 1.3 ± 0.4 Hz; ANOVA p = 0.5). Therefore, the actions of alphaxalone appeared to be specific to extrasynaptic δ subunit-containing GABAARs (Stell et al., 2003).
Figure 6.

Neurosteroids enhance the steady-state conductance mediated by α6β2δ subunit-containing GABAARs at low and high GABA concentrations. A, Continuous current record during the application of 250 nm GABA followed by coapplication of 10 nm THDOC. The white circles show the mean current obtained from all-point histograms of the steady-state current trace. B, Plot of the mean (±SEM) neurosteroid-induced steady-state conductance plotted in proportion to the GABA-evoked conductance (dashed line). It is clear from these data that the proportional increase in the tonic conductance is greater at higher steady-state GABA concentrations. This is true for both 10 nm THDOC (n = 23 cells) and 30 nm alphaxalone (n = 20 cells). Dashed gray line indicates the control GABA steady-state response.
Figure 7.
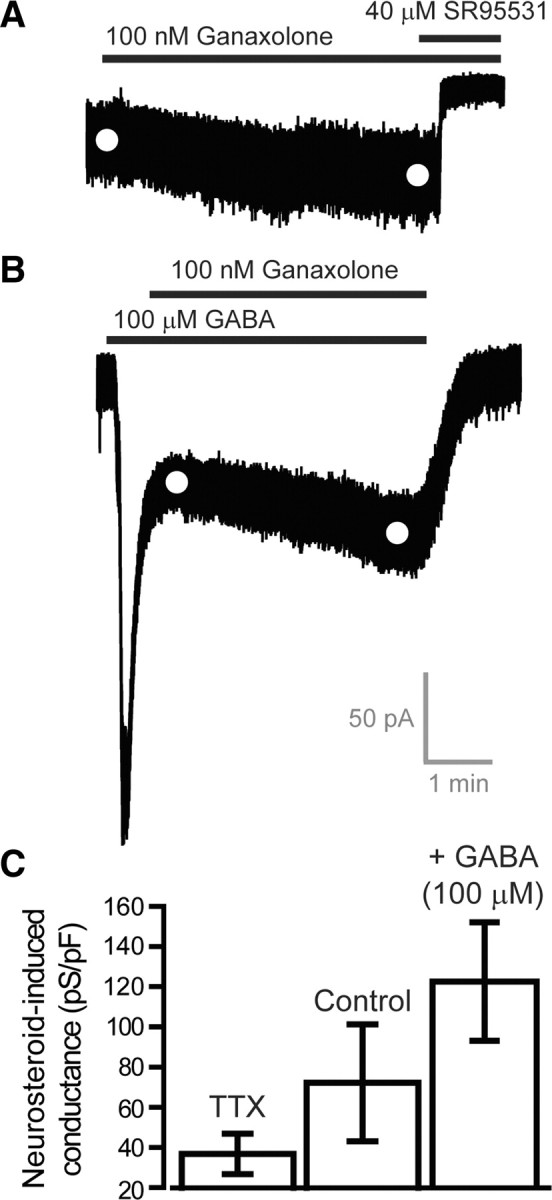
Neurosteroids enhance the tonic conductance recorded from adult cerebellar granule cells at low and high ambient GABA concentrations. A, The current trace is taken from a whole-cell recording from a cerebellar granule cell during the application of 100 nm ganaxolone followed by the coapplication of 40 μm SR95531. B, The trace is taken from a recording where 100 μm GABA was applied before coapplication of 100 nm ganaxolone. The white circles in A and B mark the mean current amplitude calculated from Gaussian fits to all-point histograms of the type shown in Figure 3, G and H. C, Bar graph of the mean (±SEM) alphaxalone-induced tonic conductance recorded from adult granule cells in control conditions (n = 6 cells), in the presence of 500 nm TTX (n = 6 cells) and compared with the ganaxolone-induced conductance recorded in the presence of 100 μm GABA (n = 10 cells).
Estimates of extrasynaptic GABAAR number in cerebellar granule cells
Our data demonstrate that, under steady-state conditions, THIP is a low-affinity partial agonist. It is therefore surprising that THIP is capable of increasing the tonic conductance at all. One plausible explanation is that cerebellar granule cells express a surplus of extrasynaptic GABAARs that have not bound GABA and are therefore available for THIP binding (see Discussion). To further explore this possibility, we quantified extrasynaptic GABAAR number in the soma, axon, and dendrites of cerebellar granule cells. If there is a surplus of extrasynaptic GABAARs relative to available GABA molecules, then we would predict a lack of correlation between receptor number and the tonic conductance recorded from these cells. Blind deconvolution of confocal images and subsequent 3D representation of cerebellar granule cell morphology was used to quantify the surface area of the soma, dendrites, and axon of 20 cerebellar granule neurons in which we also had an electrophysiological measure of the tonic conductance. From these measures of membrane area and measured capacitance we estimated a specific membrane capacitance of 0.63 ± 0.04 μF/cm2 for cerebellar granule neurons. Four typical examples of granule cell morphology in the adult cerebellum are shown in Figure 8A. These cells have been rotated to reveal as much of the dendritic structure as possible. The full extent of the recovered axon is not shown at this magnification. Figure 8B shows the quantification of soma, dendrite, and axon surface area for all granule neurons used in this part of the study. There was less variance associated with both the dendrite [519 ± 48 μm2; coefficient of variation (CV) = 0.46] and soma surface area (120 ± 9 μm2; CV = 0.35), compared with the axon surface area (130 ± 25 μm2; CV = 0.97). This greater variance probably reflects a greater intrinsic error associated with the ability of this technique to detect signal from such a thin axon. Total extrasynaptic GABAAR number (2196 ± 194; CV = 0.44; n = 25) was then calculated from receptor density values estimated from a previous high-resolution EM study in cerebellar granule neurons (Nusser et al., 1998). We used a density of one and four GABAARs per μm2 for the soma and dendrites, respectively, and assumed an absence of receptors in the axon. We regard this as a conservative estimate of receptor density, given the sensitivity of the method and the fact that functional studies indicate the presence of axonal extrasynaptic GABAARs (Trigo et al., 2008). However, the regression analysis illustrated in Figure 8C shows a lack of correlation (R2 = 0.2) between our estimate of total extrasynaptic GABAAR number and the magnitude of the tonic conductance (see Discussion). A similar lack of correlation was observed when a much larger dataset was analyzed using membrane capacitance as a surrogate for membrane surface area (Fig. 8D).
Figure 8.
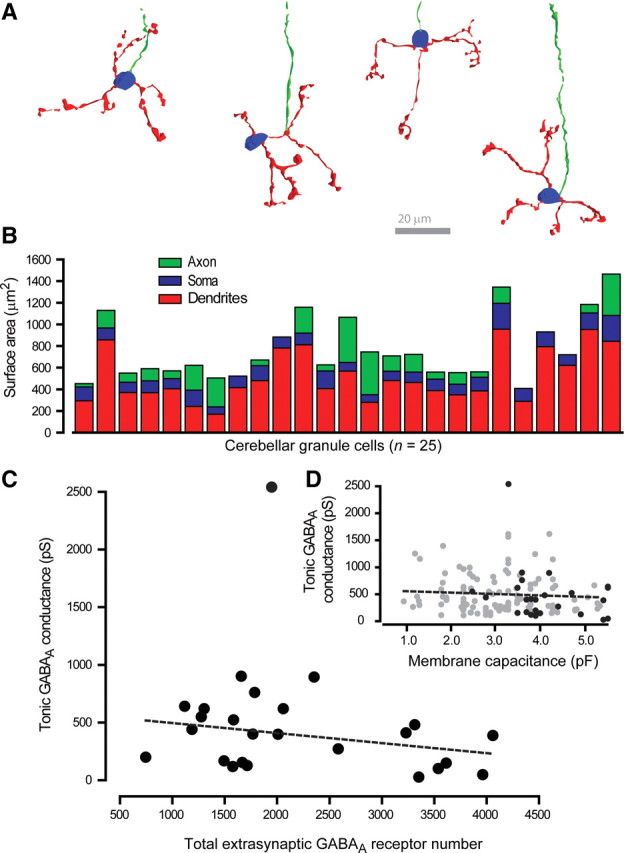
Extrasynaptic GABAAR number does not determine the magnitude of the tonic conductance recorded from cerebellar granule cells. A, Four representative examples of cerebellar granule cell reconstructions obtained after whole-cell voltage-clamp recording. Cells were visualized with standard confocal microscopy and rendered in 3D to enable estimates of surface area and dendrite and axon length. In these examples the soma is colored blue, the dendrites are red, and the axon is green. B, A total of 25 cerebellar granule cells were successfully recovered after whole-cell recording, and the surface area of the soma (blue), dendrite (red), and axon (green) of each cell is included in this stacked bar graph. C, The tonic conductance for each cell was calculated from the holding current, and the total extrasynaptic GABAAR number was estimated from the surface area measurements. Linear regression analysis (red line) of this dataset (black circles) shows that there is no correlation between the tonic conductance and the number of extrasynaptic GABAARs. This lack of correlation was confirmed with linear regression analysis (dashed line), giving an R2 value of 0.028 (p = 0.2; Pearson correlations). D, A similar lack of correlation between the tonic conductance and the measured membrane capacitance obtained for all cells (n = 134) in this study is shown (grey circles). The black circles highlight the 25 granule cells that were also used for surface area measurements. The dashed line is a linear regression analysis across this entire dataset with an R2 value of 0.0037 (p = 0.4; Pearson correlations), indicating a lack of correlation between the size of a granule cell and the tonic conductance.
Discussion
This study examines the actions of three classes of drugs that are believed to modulate tonic inhibition in the brain. Unexpectedly, the action of the widely used anesthetic propofol and the sleep-promoting drug THIP both were significantly reduced by raising the ambient GABA concentration. In contrast, the efficacy of neurosteroids was enhanced by raised ambient GABA concentrations. These results are discussed in relation to known changes in ambient GABA concentration and in the context of extrasynaptic GABAAR number.
Data from recombinant α6β2δ receptors demonstrate experimentally a complete loss of propofol enhancement at steady-state GABA concentrations >100 nm (Fig. 2) that is consistent with our predictions (Fig. 1). It was also possible to show that increasing the rate of vesicular GABA release reduced propofol's ability to enhance tonic inhibition in adult cerebellar granule cells (Fig. 3). Given that propofol enhancement of tonic inhibition was never completely attenuated, the ambient GABA concentration may not exceed 100 nm in the slice preparation. In contrast, the ability of neurosteroids to enhance tonic inhibition is not attenuated at high ambient GABA concentrations and is enhanced because of a reduction in steady-state desensitization (Figs. 6, 7). The fact that the action of a so-called super agonist like THIP was attenuated by raising ambient GABA levels was more surprising. However, when steady-state conditions are considered we see no evidence that THIP exhibits greater efficacy compared with GABA (Fig. 4). Therefore, steady-state behavior of extrasynaptic GABAARs (Bright et al., 2011) explains why THIP's ability to enhance tonic inhibition is attenuated at high ambient GABA levels. Our recombinant expression studies also suggest that THIP's ability to enhance tonic inhibition will be completely lost at ambient GABA concentrations >250 nm (Fig. 4) largely because extrasynaptic GABAARs have such high affinity for GABA that it is not possible for THIP to effectively compete with GABA binding. However, in native neurons a THIP-induced conductance was measured in all conditions examined (Fig. 5). This result is also consistent with a very low ambient GABA concentration in the slice preparation. Unfortunately, it is not possible to accurately predict the ambient GABA concentration from the magnitude of a THIP-activated conductance, but it would appear that the number of GABAARs far exceeds the available number of GABA molecules present in the extracellular space, enabling surplus receptors to bind THIP. The number of GABA molecules surrounding each granule cell can be approximately estimated assuming certain limits. For example, if the average cell to cell distance was taken as 50 nm then, at a low ambient GABA concentration of 25 nm, there would be a total of 800 GABA molecules, but this estimate would rise to 16,000 GABA molecules at a 1 μm intercellular distance. Assuming that the extracellular volume surrounding granule cells is at the lower end of these limits (Barberis et al., 2011) then the issue of surplus extrasynaptic GABAARs could be important. Using previous estimates of receptor density obtained from a high-resolution EM study (Nusser et al., 1998) combined with estimates of surface area obtained from our 3D reconstructions (Figs. 2, 8), we estimate that there are in the region of 2000 extrasynaptic GABAARs expressed on a typical granule cell. Two GABA molecules are required to open a single GABAAR. Therefore, only 10% of receptors will be fully bound at 25 nm, and it will require ambient GABA concentrations to increase tenfold before all available extrasynaptic GABAARs can be fully bound. Once receptor desensitization is taken into account it is not surprising that the tonic conductance recorded from central neurons is so small (typically reflecting the opening of only three to four channels at any given time in a cerebellar granule cells). Moreover, a lack of correlation between the magnitude of the tonic conductance and cell surface area (Fig. 8C, D) would be predicted if there is indeed an excess of extrasynaptic GABAARs relative to a small number of GABA molecules in the extracellular space.
It is widely assumed that synaptically released GABA will diffuse some distance away from the synaptic cleft to influence ambient GABA levels (Alger and Nicoll, 1982; Destexhe and Sejnowski, 1995; Rossi and Hamann, 1998; Mitchell and Silver, 2000; Hamann et al., 2002; Wei et al., 2003; Bright et al., 2011). Indeed, we and others have reported previously that blocking action potential-dependent GABA release with the voltage-gated sodium channel blocker TTX reduced the tonic conductance recorded from adult cerebellar granule neurons (Carta et al., 2004; Bright et al., 2011), but other studies have reported no reduction after TTX application (Wall and Usowicz, 1997; Hamann et al., 2002). This ambiguity has led to the suggestion that a novel nonvesicular mechanism for elevating ambient GABA concentrations exists in the cerebellum (Rossi et al., 2003), and it has been proposed that permeation of GABA through bestrophin-1 anion channels could be responsible for setting the ambient GABA concentration (Lee et al., 2010). Surprisingly, Lee et al. (2010) reported that blocking these swelling-activated channels with 5-nitro-2-(3-phenylpropylamino) benzoic acid reduced the tonic conductance, although this drug was shown previously to have the opposite effect and was reported to enhance tonic inhibition in cerebellar granule neurons (Rossi et al., 2003). One interpretation of these contradictory results is that the source of ambient GABA can vary according to physiological and pathological conditions. In the current study we have modulated ambient GABA levels by manipulating the rate of vesicular GABA, and this manipulation has a clear impact on the magnitude of the tonic conductance (Fig. 3B). Therefore, we suggest that under physiological conditions there is no necessity to invoke a nonvesicular source of GABA release, although it is possible that under pathological conditions other sources of GABA release could dominate.
Based on the stoichiometry of the GABA transporter, extracellular GABA concentrations are believed to be in the 10–400 nm range (Attwell et al., 1993; Richerson and Wu, 2003; Wu et al., 2006, 2007), and microdialysis studies have demonstrated that resting ambient GABA concentration could be anywhere from 30 nm (de Groote and Linthorst, 2007) to 300 nm (Richter et al., 1999; Kennedy et al., 2002; Bianchi et al., 2003; Xi et al., 2003). High-affinity extrasynaptic receptors containing the δ subunit are clearly capable of responding to these low ambient GABA levels to produce a tonic shunting inhibition in vitro (Brickley et al., 2001) and in vivo (Chadderton et al., 2004). Ambient GABA levels can rise further during certain behavioral states. For example, in the ventral hippocampus the ambient GABA concentration rises to ∼800 nm during exploration (Bianchi et al., 2003; de Groote and Linthorst, 2007). In the thalamus, ambient GABA levels are higher during non-rapid eye movement (non-REM) sleep than during REM or waking states (Kékesi et al., 1997), and in some pathological conditions ambient GABA levels can rise to higher concentrations. For example, in Parkinson's disease a loss of dopaminergic drive leads to enhanced GABA concentrations in the striatum (Kish et al., 1986). Additionally, a number of widely prescribed drugs (tiagabine, vigabatrin, and gabapentin) enhance ambient GABA levels by interfering with GABA uptake and metabolism. For example, gabapentin has several pharmacological actions (Eroglu et al., 2009), one of which involves raising ambient GABA levels by modulating GABA synthesis via the glutamic acid decarboxylase (GAD) enzyme (Taylor, 1997). Altered ambient GABA levels have also been reported after brain injury, and although enhanced tonic inhibition onto cortical neurons has an acute neuroprotective role it has also been shown to interfere with functional recovery in a rodent stroke model (Clarkson et al., 2010). Given that changes in ambient GABA levels are associated with such diverse physiological and pathological conditions, the clinical significance of a relationship between ambient GABA levels and drug potency should be considered. Previous studies using global subunit knock-out mice to alter extrasynaptic GABAAR number have reported alterations in the potency of certain anesthetics. For example, the hypnotic actions of alphaxalone are reduced in δ knock-out mice (Mihalek et al., 1999) as is the ability of THIP to prolong non-REM sleep (Winsky-Sommerer et al., 2007), but the ability of anesthetics such as propofol and etomidate to increase sleep time were not altered (Mihalek et al., 1999). A reduction in the propofol-induced sleep time has been reported in a GAD knock-out line, but this result cannot be attributed to extrasynaptic receptor modulation at present (Nishikawa et al., 2011). However, it remains to be established whether ambient GABA concentrations in vivo are sufficient to fully occupy the available extrasynaptic GABAARs, thus removing propofol enhancement of tonic inhibition under these conditions. Neurosteroid modulation of extrasynaptic GABAARs therefore represents a more effective strategy for enhancing tonic inhibition if ambient GABA levels in vivo are indeed >100 nm.
Footnotes
This work was supported by a Medical Research Council (MRC) program grant and a Wellcome Trust project grant (to N.P.F. and S.G.B.), a MRC career development grant (to A.M.H.), and a Biotechnology and Biological Sciences Research Council project grant (to N.P.F. and S.G.B.).
References
- Alger and Nicoll, 1982.Alger BE, Nicoll RA. Pharmacological evidence for two kinds of GABA receptor on rat hippocampal pyramidal cells studied in vitro. J Physiol. 1982;328:125–141. doi: 10.1113/jphysiol.1982.sp014256. [DOI] [PMC free article] [PubMed] [Google Scholar]
- Ali and DeCaprio, 2001.Ali SH, DeCaprio JA. Cellular transformation by SV40 large T antigen: interaction with host proteins. Semin Cancer Biol. 2001;11:15–23. doi: 10.1006/scbi.2000.0342. [DOI] [PubMed] [Google Scholar]
- Ashby et al., 2004.Ashby MC, Ibaraki K, Henley JM. It's green outside: tracking cell surface proteins with pH-sensitive GFP. Trends Neurosci. 2004;27:257–261. doi: 10.1016/j.tins.2004.03.010. [DOI] [PubMed] [Google Scholar]
- Attwell et al., 1993.Attwell D, Barbour B, Szatkowski M. Nonvesicular release of neurotransmitter. Neuron. 1993;11:401–407. doi: 10.1016/0896-6273(93)90145-h. [DOI] [PubMed] [Google Scholar]
- Bai et al., 1999.Bai D, Pennefather PS, MacDonald JF, Orser BA. The general anesthetic propofol slows deactivation and desensitization of GABAA receptors. J Neurosci. 1999;19:10635–10646. doi: 10.1523/JNEUROSCI.19-24-10635.1999. [DOI] [PMC free article] [PubMed] [Google Scholar]
- Barberis et al., 2011.Barberis A, Petrini EM, Mozrzymas JW. Impact of synaptic neurotransmitter concentration time course on the kinetics and pharmacological modulation of inhibitory synaptic currents. Front Cell Neurosci. 2011;5:6. doi: 10.3389/fncel.2011.00006. [DOI] [PMC free article] [PubMed] [Google Scholar]
- Belelli and Herd, 2003.Belelli D, Herd MB. The contraceptive agent Provera enhances GABAA receptor-mediated inhibitory neurotransmission in the rat hippocampus: evidence for endogenous neurosteroids? J Neurosci. 2003;23:10013–10020. doi: 10.1523/JNEUROSCI.23-31-10013.2003. [DOI] [PMC free article] [PubMed] [Google Scholar]
- Bianchi et al., 2003.Bianchi L, Ballini C, Colivicchi MA, Della Corte L, Giovannini MG, Pepeu G. Investigation on acetylcholine, aspartate, glutamate and GABA extracellular levels from ventral hippocampus during repeated exploratory activity in the rat. Neurochem Res. 2003;28:565–573. doi: 10.1023/a:1022881625378. [DOI] [PubMed] [Google Scholar]
- Bianchi and Macdonald, 2003.Bianchi MT, Macdonald RL. Neurosteroids shift partial agonist activation of GABAA receptor channels from low- to high-efficacy gating patterns. J Neurosci. 2003;23:10934–10943. doi: 10.1523/JNEUROSCI.23-34-10934.2003. [DOI] [PMC free article] [PubMed] [Google Scholar]
- Brickley and Mody, 2012.Brickley SG, Mody I. Extrasynaptic GABAA receptors: their function in the CNS and implications for disease. Neuron. 2012;73:23–34. doi: 10.1016/j.neuron.2011.12.012. [DOI] [PMC free article] [PubMed] [Google Scholar]
- Brickley et al., 2001.Brickley SG, Revilla V, Cull-Candy SG, Wisden W, Farrant M. Adaptive regulation of neuronal excitability by a voltage-independent potassium conductance. Nature. 2001;409:88–92. doi: 10.1038/35051086. [DOI] [PubMed] [Google Scholar]
- Bright et al., 2011.Bright DP, Renzi M, Bartram J, McGee TP, MacKenzie G, Hosie AM, Farrant M, Brickley SG. Profound desensitization by ambient GABA limits activation of δ-containing GABAA receptors during spillover. J Neurosci. 2011;31:753–763. doi: 10.1523/JNEUROSCI.2996-10.2011. [DOI] [PMC free article] [PubMed] [Google Scholar]
- Brown et al., 2002.Brown N, Kerby J, Bonnert TP, Whiting PJ, Wafford KA. Pharmacological characterization of a novel cell line expressing human α4β3δ GABAA receptors. Br J Pharmacol. 2002;136:965–974. doi: 10.1038/sj.bjp.0704795. [DOI] [PMC free article] [PubMed] [Google Scholar]
- Carta et al., 2004.Carta M, Mameli M, Valenzuela CF. Alcohol enhances GABAergic transmission to cerebellar granule cells via an increase in Golgi cell excitability. J Neurosci. 2004;24:3746–3751. doi: 10.1523/JNEUROSCI.0067-04.2004. [DOI] [PMC free article] [PubMed] [Google Scholar]
- Chadderton et al., 2004.Chadderton P, Margrie TW, Häusser M. Integration of quanta in cerebellar granule cells during sensory processing. Nature. 2004;428:856–860. doi: 10.1038/nature02442. [DOI] [PubMed] [Google Scholar]
- Chen and Okayama, 1987.Chen C, Okayama H. High-efficiency transformation of mammalian cells by plasmid DNA. Mol Cell Biol. 1987;7:2745–2752. doi: 10.1128/mcb.7.8.2745. [DOI] [PMC free article] [PubMed] [Google Scholar]
- Clarkson et al., 2010.Clarkson AN, Huang BS, Macisaac SE, Mody I, Carmichael ST. Reducing excessive GABA-mediated tonic inhibition promotes functional recovery after stroke. Nature. 2010;468:305–309. doi: 10.1038/nature09511. [DOI] [PMC free article] [PubMed] [Google Scholar]
- Cope et al., 2005.Cope DW, Hughes SW, Crunelli V. GABAA receptor-mediated tonic inhibition in thalamic neurons. J Neurosci. 2005;25:11553–11563. doi: 10.1523/JNEUROSCI.3362-05.2005. [DOI] [PMC free article] [PubMed] [Google Scholar]
- Cope et al., 2009.Cope DW, Di Giovanni G, Fyson SJ, Orbán G, Errington AC, Lorincz ML, Gould TM, Carter DA, Crunelli V. Enhanced tonic GABAA inhibition in typical absence epilepsy. Nat Med. 2009;15:1392–1398. doi: 10.1038/nm.2058. [DOI] [PMC free article] [PubMed] [Google Scholar]
- de Groote and Linthorst, 2007.de Groote L, Linthorst AC. Exposure to novelty and forced swimming evoke stressor-dependent changes in extracellular GABA in the rat hippocampus. Neuroscience. 2007;148:794–805. doi: 10.1016/j.neuroscience.2007.06.030. [DOI] [PubMed] [Google Scholar]
- Destexhe and Sejnowski, 1995.Destexhe A, Sejnowski TJ. G protein activation kinetics and spillover of γ-aminobutyric acid may account for differences between inhibitory responses in the hippocampus and thalamus. Proc Natl Acad Sci U S A. 1995;92:9515–9519. doi: 10.1073/pnas.92.21.9515. [DOI] [PMC free article] [PubMed] [Google Scholar]
- Eroglu et al., 2009.Eroglu C, Allen NJ, Susman MW, O'Rourke NA, Park CY, Ozkan E, Chakraborty C, Mulinyawe SB, Annis DS, Huberman AD, Green EM, Lawler J, Dolmetsch R, Garcia KC, Smith SJ, Luo ZD, Rosenthal A, Mosher DF, Barres BA. Gabapentin receptor α2δ-1 is a neuronal thrombospondin receptor responsible for excitatory CNS synaptogenesis. Cell. 2009;139:380–392. doi: 10.1016/j.cell.2009.09.025. [DOI] [PMC free article] [PubMed] [Google Scholar]
- Farrant and Nusser, 2005.Farrant M, Nusser Z. Variations on an inhibitory theme: phasic and tonic activation of GABAA receptors. Nat Rev Neurosci. 2005;6:215–229. doi: 10.1038/nrn1625. [DOI] [PubMed] [Google Scholar]
- Fiala, 2005.Fiala JC. Reconstruct: a free editor for serial section microscopy. J Microsc. 2005;218:52–61. doi: 10.1111/j.1365-2818.2005.01466.x. [DOI] [PubMed] [Google Scholar]
- Franks, 2008.Franks NP. General anaesthesia: from molecular targets to neuronal pathways of sleep and arousal. Nat Rev Neurosci. 2008;9:370–386. doi: 10.1038/nrn2372. [DOI] [PubMed] [Google Scholar]
- Freund and Katona, 2007.Freund TF, Katona I. Perisomatic inhibition. Neuron. 2007;56:33–42. doi: 10.1016/j.neuron.2007.09.012. [DOI] [PubMed] [Google Scholar]
- Glykys and Mody, 2007.Glykys J, Mody I. Activation of GABAA receptors: views from outside the synaptic cleft. Neuron. 2007;56:763–770. doi: 10.1016/j.neuron.2007.11.002. [DOI] [PubMed] [Google Scholar]
- Hales and Lambert, 1991.Hales TG, Lambert JJ. The actions of propofol on inhibitory amino acid receptors of bovine adrenomedullary chromaffin cells and rodent central neurones. Br J Pharmacol. 1991;104:619–628. doi: 10.1111/j.1476-5381.1991.tb12479.x. [DOI] [PMC free article] [PubMed] [Google Scholar]
- Hamann et al., 2002.Hamann M, Rossi DJ, Attwell D. Tonic and spillover inhibition of granule cells control information flow through cerebellar cortex. Neuron. 2002;33:625–633. doi: 10.1016/s0896-6273(02)00593-7. [DOI] [PubMed] [Google Scholar]
- Herd et al., 2009.Herd MB, Foister N, Chandra D, Peden DR, Homanics GE, Brown VJ, Balfour DJ, Lambert JJ, Belelli D. Inhibition of thalamic excitability by 4,5,6,7-tetrahydroisoxazolo[4,5-c]pyridine-3-ol: a selective role for δ-GABAA receptors. Eur J Neurosci. 2009;29:1177–1187. doi: 10.1111/j.1460-9568.2009.06680.x. [DOI] [PMC free article] [PubMed] [Google Scholar]
- Jones and Westbrook, 1996.Jones MV, Westbrook GL. The impact of receptor desensitization on fast synaptic transmission. Trends Neurosci. 1996;19:96–101. doi: 10.1016/s0166-2236(96)80037-3. [DOI] [PubMed] [Google Scholar]
- Kékesi et al., 1997.Kékesi KA, Dobolyi A, Salfay O, Nyitrai G, Juhász G. Slow wave sleep is accompanied by release of certain amino acids in the thalamus of cats. Neuroreport. 1997;8:1183–1186. doi: 10.1097/00001756-199703240-00025. [DOI] [PubMed] [Google Scholar]
- Kennedy et al., 2002.Kennedy RT, Thompson JE, Vickroy TW. In vivo monitoring of amino acids by direct sampling of brain extracellular fluid at ultralow flow rates and capillary electrophoresis. J Neurosci Methods. 2002;114:39–49. doi: 10.1016/s0165-0270(01)00506-4. [DOI] [PubMed] [Google Scholar]
- Kish et al., 1986.Kish SJ, Rajput A, Gilbert J, Rozdilsky B, Chang LJ, Shannak K, Hornykiewicz O. Elevated γ-aminobutyric acid level in striatal but not extrastriatal brain regions in Parkinson's disease: correlation with striatal dopamine loss. Ann Neurol. 1986;20:26–31. doi: 10.1002/ana.410200106. [DOI] [PubMed] [Google Scholar]
- Klausberger and Somogyi, 2008.Klausberger T, Somogyi P. Neuronal diversity and temporal dynamics: the unity of hippocampal circuit operations. Science. 2008;321:53–57. doi: 10.1126/science.1149381. [DOI] [PMC free article] [PubMed] [Google Scholar]
- Laurie et al., 1992.Laurie DJ, Seeburg PH, Wisden W. The distribution of 13 GABAA receptor subunit mRNAs in the rat brain. II. Olfactory bulb and cerebellum. J Neurosci. 1992;12:1063–1076. doi: 10.1523/JNEUROSCI.12-03-01063.1992. [DOI] [PMC free article] [PubMed] [Google Scholar]
- Lee et al., 2010.Lee S, Yoon BE, Berglund K, Oh SJ, Park H, Shin HS, Augustine GJ, Lee CJ. Channel-mediated tonic GABA release from glia. Science. 2010;330:790–796. doi: 10.1126/science.1184334. [DOI] [PubMed] [Google Scholar]
- Li and Pearce, 2000.Li X, Pearce RA. Effects of halothane on GABAA receptor kinetics: evidence for slowed agonist unbinding. J Neurosci. 2000;20:899–907. doi: 10.1523/JNEUROSCI.20-03-00899.2000. [DOI] [PMC free article] [PubMed] [Google Scholar]
- Lindquist et al., 2003.Lindquist CE, Ebert B, Birnir B. Extrasynaptic GABAA channels activated by THIP are modulated by diazepam in CA1 pyramidal neurons in the rat brain hippocampal slice. Mol Cell Neurosci. 2003;24:250–257. doi: 10.1016/s1044-7431(03)00128-3. [DOI] [PubMed] [Google Scholar]
- Maguire and Mody, 2008.Maguire J, Mody I. GABAAR plasticity during pregnancy: relevance to postpartum depression. Neuron. 2008;59:207–213. doi: 10.1016/j.neuron.2008.06.019. [DOI] [PMC free article] [PubMed] [Google Scholar]
- Maguire et al., 2005.Maguire JL, Stell BM, Rafizadeh M, Mody I. Ovarian cycle-linked changes in GABAA receptors mediating tonic inhibition alter seizure susceptibility and anxiety. Nat Neurosci. 2005;8:797–804. doi: 10.1038/nn1469. [DOI] [PubMed] [Google Scholar]
- Maldonado-Avilés et al., 2009.Maldonado-Avilés JG, Curley AA, Hashimoto T, Morrow AL, Ramsey AJ, O'Donnell P, Volk DW, Lewis DA. Altered markers of tonic inhibition in the dorsolateral prefrontal cortex of subjects with schizophrenia. Am J Psychiatry. 2009;166:450–459. doi: 10.1176/appi.ajp.2008.08101484. [DOI] [PMC free article] [PubMed] [Google Scholar]
- Mihalek et al., 1999.Mihalek RM, Banerjee PK, Korpi ER, Quinlan JJ, Firestone LL, Mi ZP, Lagenaur C, Tretter V, Sieghart W, Anagnostaras SG, Sage JR, Fanselow MS, Guidotti A, Spigelman I, Li Z, DeLorey TM, Olsen RW, Homanics GE. Attenuated sensitivity to neuroactive steroids in γ-aminobutyrate type A receptor δ subunit knockout mice. Proc Natl Acad Sci U S A. 1999;96:12905–12910. doi: 10.1073/pnas.96.22.12905. [DOI] [PMC free article] [PubMed] [Google Scholar]
- Mitchell and Silver, 2000.Mitchell SJ, Silver RA. GABA spillover from single inhibitory axons suppresses low-frequency excitatory transmission at the cerebellar glomerulus. J Neurosci. 2000;20:8651–8658. doi: 10.1523/JNEUROSCI.20-23-08651.2000. [DOI] [PMC free article] [PubMed] [Google Scholar]
- Mortensen et al., 2010.Mortensen M, Ebert B, Wafford K, Smart TG. Distinct activities of GABA agonists at synaptic- and extrasynaptic-type GABAA receptors. J Physiol. 2010;588:1251–1268. doi: 10.1113/jphysiol.2009.182444. [DOI] [PMC free article] [PubMed] [Google Scholar]
- Nishikawa et al., 2011.Nishikawa K, Kubo K, Obata H, Yanagawa Y, Saito S. The influence of manipulations to alter ambient GABA concentrations on the hypnotic and immobilizing actions produced by sevoflurane, propofol, and midazolam. Neuropharmacology. 2011;61:172–180. doi: 10.1016/j.neuropharm.2011.03.025. [DOI] [PubMed] [Google Scholar]
- Nusser et al., 1998.Nusser Z, Sieghart W, Somogyi P. Segregation of different GABAA receptors to synaptic and extrasynaptic membranes of cerebellar granule cells. J Neurosci. 1998;18:1693–1703. doi: 10.1523/JNEUROSCI.18-05-01693.1998. [DOI] [PMC free article] [PubMed] [Google Scholar]
- Orser et al., 1994.Orser BA, Wang LY, Pennefather PS, MacDonald JF. Propofol modulates activation and desensitization of GABAA receptors in cultured murine hippocampal neurons. J Neurosci. 1994;14:7747–7760. doi: 10.1523/JNEUROSCI.14-12-07747.1994. [DOI] [PMC free article] [PubMed] [Google Scholar]
- Richerson and Wu, 2003.Richerson GB, Wu Y. Dynamic equilibrium of neurotransmitter transporters: not just for reuptake anymore. J Neurophysiol. 2003;90:1363–1374. doi: 10.1152/jn.00317.2003. [DOI] [PubMed] [Google Scholar]
- Richter et al., 1999.Richter DW, Schmidt-Garcon P, Pierrefiche O, Bischoff AM, Lalley PM. Neurotransmitters and neuromodulators controlling the hypoxic respiratory response in anaesthetized cats. J Physiol. 1999;514:567–578. doi: 10.1111/j.1469-7793.1999.567ae.x. [DOI] [PMC free article] [PubMed] [Google Scholar]
- Rossi and Hamann, 1998.Rossi DJ, Hamann M. Spillover-mediated transmission at inhibitory synapses promoted by high affinity α6 subunit GABAA receptors and glomerular geometry. Neuron. 1998;20:783–795. doi: 10.1016/s0896-6273(00)81016-8. [DOI] [PubMed] [Google Scholar]
- Rossi et al., 2003.Rossi DJ, Hamann M, Attwell D. Multiple modes of GABAergic inhibition of rat cerebellar granule cells. J Physiol. 2003;548:97–110. doi: 10.1113/jphysiol.2002.036459. [DOI] [PMC free article] [PubMed] [Google Scholar]
- Shivers et al., 1989.Shivers BD, Killisch I, Sprengel R, Sontheimer H, Köhler M, Schofield PR, Seeburg PH. Two novel GABAA receptor subunits exist in distinct neuronal subpopulations. Neuron. 1989;3:327–337. doi: 10.1016/0896-6273(89)90257-2. [DOI] [PubMed] [Google Scholar]
- Spigelman et al., 2003.Spigelman I, Li Z, Liang J, Cagetti E, Samzadeh S, Mihalek RM, Homanics GE, Olsen RW. Reduced inhibition and sensitivity to neurosteroids in hippocampus of mice lacking the GABAA receptor δ subunit. J Neurophysiol. 2003;90:903–910. doi: 10.1152/jn.01022.2002. [DOI] [PubMed] [Google Scholar]
- Stell et al., 2003.Stell BM, Brickley SG, Tang CY, Farrant M, Mody I. Neuroactive steroids reduce neuronal excitability by selectively enhancing tonic inhibition mediated by δ subunit-containing GABAA receptors. Proc Natl Acad Sci U S A. 2003;100:14439–14444. doi: 10.1073/pnas.2435457100. [DOI] [PMC free article] [PubMed] [Google Scholar]
- Stórustovu and Ebert, 2006.Stórustovu SI, Ebert B. Pharmacological characterization of agonists at δ-containing GABAA receptors: functional selectivity for extrasynaptic receptors is dependent on the absence of γ2. J Pharmacol Exp Ther. 2006;316:1351–1359. doi: 10.1124/jpet.105.092403. [DOI] [PubMed] [Google Scholar]
- Taylor, 1997.Taylor CP. Mechanisms of action of gabapentin. Rev Neurol (Paris) 1997;153(Suppl 1):S39–S45. [PubMed] [Google Scholar]
- Trigo et al., 2008.Trigo FF, Marty A, Stell BM. Axonal GABAA receptors. Eur J Neurosci. 2008;28:841–848. doi: 10.1111/j.1460-9568.2008.06404.x. [DOI] [PubMed] [Google Scholar]
- Wafford and Ebert, 2006.Wafford KA, Ebert B. Gaboxadol—a new awakening in sleep. Curr Opin Pharmacol. 2006;6:30–36. doi: 10.1016/j.coph.2005.10.004. [DOI] [PubMed] [Google Scholar]
- Wall and Usowicz, 1997.Wall MJ, Usowicz MM. Development of action potential-dependent and independent spontaneous GABAA receptor-mediated currents in granule cells of postnatal rat cerebellum. Eur J Neurosci. 1997;9:533–548. doi: 10.1111/j.1460-9568.1997.tb01630.x. [DOI] [PubMed] [Google Scholar]
- Wei et al., 2003.Wei W, Zhang N, Peng Z, Houser CR, Mody I. Perisynaptic localization of δ subunit-containing GABAA receptors and their activation by GABA spillover in the mouse dentate gyrus. J Neurosci. 2003;23:10650–10661. doi: 10.1523/JNEUROSCI.23-33-10650.2003. [DOI] [PMC free article] [PubMed] [Google Scholar]
- Winsky-Sommerer et al., 2007.Winsky-Sommerer R, Vyazovskiy VV, Homanics GE, Tobler I. The EEG effects of THIP (Gaboxadol) on sleep and waking are mediated by the GABAAδ-subunit-containing receptors. Eur J Neurosci. 2007;25:1893–1899. doi: 10.1111/j.1460-9568.2007.05455.x. [DOI] [PubMed] [Google Scholar]
- Wu et al., 2006.Wu Y, Wang W, Richerson GB. The transmembrane sodium gradient influences ambient GABA concentration by altering the equilibrium of GABA transporters. J Neurophysiol. 2006;96:2425–2436. doi: 10.1152/jn.00545.2006. [DOI] [PubMed] [Google Scholar]
- Wu et al., 2007.Wu Y, Wang W, Díez-Sampedro A, Richerson GB. Nonvesicular inhibitory neurotransmission via reversal of the GABA transporter GAT-1. Neuron. 2007;56:851–865. doi: 10.1016/j.neuron.2007.10.021. [DOI] [PMC free article] [PubMed] [Google Scholar]
- Xi et al., 2003.Xi ZX, Ramamoorthy S, Shen H, Lake R, Samuvel DJ, Kalivas PW. GABA transmission in the nucleus accumbens is altered after withdrawal from repeated cocaine. J Neurosci. 2003;23:3498–3505. doi: 10.1523/JNEUROSCI.23-08-03498.2003. [DOI] [PMC free article] [PubMed] [Google Scholar]
- Zecharia et al., 2009.Zecharia AY, Nelson LE, Gent TC, Schumacher M, Jurd R, Rudolph U, Brickley SG, Maze M, Franks NP. The involvement of hypothalamic sleep pathways in general anesthesia: testing the hypothesis using the GABAA receptor β3N265M knock-in mouse. J Neurosci. 2009;29:2177–2187. doi: 10.1523/JNEUROSCI.4997-08.2009. [DOI] [PMC free article] [PubMed] [Google Scholar]