

Abstract
Objective
Assess the relationship of single nucleotide polymorphisms associated with restless legs syndrome to periodic limb movements of sleep in a population cohort of elderly individuals.
Methods
Single nucleotide polymorphisms previously associated with periodic limb movements of sleep or restless legs syndrome were analyzed in 2,356 white male participants in the osteoporotic fractures in men study sleep cohort. Associations of single nucleotide polymorphisms to polysomnographic measured periodic limb movement index ≥15 were examined with logistic regression adjusted for age, ancestry markers, and periodic limb movements of sleep risk factors.
Results
Of the men in this cohort, 61% had a periodic limb movement index ≥15. Significant associations were observed between a periodic limb movement index ≥15 and the number of risk alleles for the two BTBD9 single nucleotide polymorphisms (rs9357271[T], OR=1.38; 95%CI 1.20-1.58, and rs3923809[A], OR=1.43; 95%CI 1.26-1.63), one of the MEIS1 single nucleotide polymorphisms (rs2300478[G], OR=1.31; 95%CI 1.14-1.51) and the MAP2K5/SKOR1 single nucleotide polymorphism (rs1026732[G], OR=1.16; 95%CI 1.02-1.31). In a multivariable model controlling for each of the two MEIS1 single nucleotide polymorphisms, the rs6710341[A] single nucleotide polymorphism became a significant risk allele (OR=1.59; 95%CI 1.26-2.00).
Conclusions
Our findings confirm an association of the BTBD9, MEIS1 and MAP2K5/SKOR1 single nucleotide polymorphisms and periodic limb movements of sleep in an elderly cohort not selected for the presence of restless legs syndrome.
Keywords: periodic limb movements of sleep, single nucleotide polymorphism, restless legs syndrome, BTBD9, MEIS1
Periodic limb movements of sleep (PLMS) are contractions of the lower extremities which occur roughly every 20 seconds during sleep, may produce brief arousals from sleep(1) and are associated with dramatic increases in blood pressure (2). They are most prominent in the elderly and in those taking antidepressant medications. In addition, they are observed in roughly 90% of individuals with restless legs syndrome (RLS), in which they are considered the motor sign of the waking urge to move which characterizes that disorder. RLS is associated with a number of specific single nucleotide polymorphisms (SNPs) based on genome wide association scans (GWAS) (3, 4). Two studies have also demonstrated that these SNPs are associated with PLMS (3, 5). The present study further attempts to determine the relationship of these SNPs to PLMS in a population cohort of elderly individuals not selected for the presence of RLS.
METHODS
Study sample
During the Osteoporotic Fractures in Men Study (MrOS) baseline examination from 2000 to 2002, 5,994 community-dwelling men 65 years or older were enrolled at six clinical centers in the United States: Birmingham, Alabama; Minneapolis, Minnesota; Palo Alto, California; the Monongahela Valley near Pittsburgh, Pennsylvania; Portland, Oregon; and San Diego, California (6, 7). In order to participate, men needed to be able to walk without assistance and must not have had a bilateral hip replacement.
The MrOS Sleep Study, an ancillary study of the parent MrOS cohort, recruited 3,135 participants for a comprehensive sleep assessment who did not require positive airway pressure or nocturnal oxygen therapy during polysomnography (PSG). Because the candidate SNPs examined were established in Caucasian populations, 319 were excluded because they were non-white. A further 175 who did not have PSG were excluded. Of these 2,641 participants, 285 did not have SNP data, leaving 2,356 in this analysis cohort. Compared to this analysis subset, those 460 white men who were not included in the analysis were similar in age, body mass index (BMI), PLMS and RLS, and lifestyle covariates. They did have a higher rate of use of dopaminergic medication (2.4% vs. 1.2%, p = 0.03).
All men provided written informed consent, and the study was approved by the Institutional Review Board at each site.
Polysomnography
Sleep testing was conducted with unattended in-home polysomnography (Safiro, Compumedics, Inc, Melbourne, Australia). The recording montage included the following: C3/A2 and C4/A1 electroencephalography, bilateral electrooculography, a bipolar submental electromyography, thoracic/abdominal respiratory inductance plethysmography, naso-oral thermistry, nasal pressure transduction, finger pulse oximetry, lead I ECG, body position, and bilateral anterior tibialis piezoelectric movement sensors. Centrally trained staff performed home visits for unit setup and impedance value verification for each channel as previously described (8). Data were downloaded to a central server at the Central Sleep Reading Center (Cleveland, OH) and scored by certified research polysomnologists using standard criteria (9, 10). Apnea was defined as complete or near complete reduction in thermistor amplitude for at least 10 seconds; hypopnea was defined as at least 30% reduction in nasal pressure signal or summed inductance bands for at least 10 seconds. The apnea-hypopnea index (AHI) was calculated as the total number of apneas and hypopneas per hour of sleep, each associated with ≥4% desaturation (10). Arousals were scored according to the American Academy of Sleep Medicine criteria (9).
PLMS were scored according to the 1993 American Academy of Sleep Medicine criteria in which individual leg movements were scored if the duration was between 0.5 and 5 seconds and there was a clear amplitude increase from baseline in leg channels (11). To be considered periodic, at least 4 movements needed to occur in succession no less than 5 seconds and no more than 90 seconds apart. The periodic limb movement index (PLMI) was the total number of periodic leg movements per hour of sleep. Leg movements after respiratory events were excluded unless they were part of a ≥4 movement cluster with at least 2 movements occurring independently of respiratory events. The PLM parameter were expressed as both a continuous and categorical variable (PLMI ≥15 vs. <15). This value was chosen for the categorical threshold as it is the index above which a diagnosis of periodic limb movement disorder (PLMD) can be made (12). It is also the threshold at which a recent study found both reduced night to night variability and optimal specificity/sensitivity (13). Similarly, this threshold has been used in previous studies of this cohort (14).
Genetics
SNPs within the candidate gene regions previously associated with PLMS or RLS were analyzed (MEIS1 SNP -rs2300478, MEIS1 SNP -rs6710341, BTBD9 SNP-rs3923809, BTBD9 SNP-rs9357271, and MAP2K5/SKOR1 SNP-rs1026732). The California Pacific Medical Center investigators and the University of California, San Diego group collaborated to develop a custom Illumina Golden Gate assay (Illumina, San Diego, CA) to genotype polymorphisms in sleep-related genes (15). Genotype concordance rate was > 0.99 (8% of MrOS samples were plated in duplicate). Samples with < 90% SNP call rate were excluded. All SNPs summarized here were in Hardy– Weinberg equilibrium (p >0.001).
Other measures
Other covariates examined included age, BMI, medication use (16), smoking, education, alcohol use, physical activity (17), depression (18), and other PSG-derived parameters (sleep staging, AHI, total sleep time, time awake after sleep onset). Ancestry markers were calculated using Autosomal SNPs in multidimensional scaling analysis (MDS) as implemented in PLINK. The first two MDS components were used as covariates (19).
Statistical analysis
Characteristics of participants were compared across PLMI status using chi-square tests for categorical variables, t-tests for normally distributed continuous variables, and Wilcoxon rank sum tests for continuous variables with skewed distributions. A linear trend in PLMI across number of risk alleles for each SNP was examined with a linear regression model. Associations of SNPs and PLMI ≥15 were examined with logistic regression models and presented as odds ratios (ORs) and their 95% confidence intervals (CIs). Odd ratios were expressed as dose of the risk allele used as a linear variable (0,1,2). Models were first adjusted for age and ancestry markers, then multivariable models were further adjusted for those covariates shown to be associated with PLMS at p<0.10.
Exploratory analyses examining the association of combinations of these SNPs and PLMI were performed to determine if the associations were independent. Conditional models for the BTBD9 and MEIS1 genes were performed, with the two SNPs in each of these genes as variables in each of the models to determine if these SNPs were independently associated with the PLMI outcome. The SNPs from each gene with the highest association to PLMI were also combined in one predictor (0-6). In this logistic model, the odds ratio was expressed as number of risk alleles used as a linear variable
RESULTS
The overall prevalence of a PLMI≥15 was 61% (Table 1). Compared to those with a PLMI<15, those with a PLMI≥15 were on average older, were less likely to have an AHI≥15, had less total sleep time, more likely to be non-drinkers, and had more depressive symptoms. There were no differences in the use of antidepressants, anticonvulsants, dopaminergics or benzodiazepines between those with and without a PLMI≥15 (Table 1).
Table 1.
Baseline Characteristics by Periodic Leg Movement Index (PLMI)
| Characteristic | All (n = 2,356) | PLMI≥15 (n = 1,446) | PLMI<15 (n = 910) | p value |
|---|---|---|---|---|
| Age, y | 76.54 ± 5.58 | 76.91 ± 5.67 | 75.95 ± 5.38 | <.0001 |
| Body mass index, kg/m2 | 27.23 ± 3.76 | 27.27 ± 3.69 | 27.16 ± 3.88 | 0.47 |
| Apnea-hypopnea indexa | 11.86 ± 13.25 | 11.44 ± 12.9 | 12.53 ± 13.76 | 0.14 |
| Apnea-hypopnea index ≥15 | 621 (26.36) | 358 (24.76) | 263 (28.9) | 0.03 |
| Self-reported diagnosis of restless legs syndrome | 56 (2.41) | 39 (2.74) | 17 (1.9) | 0.20 |
| Total sleep time, min | 355.14 ± 69.04 | 352.71 ± 70.78 | 358.99 ± 66.04 | 0.03 |
| Percent of sleep time in nREM | 80.90 ± 6.69 | 80.95 ± 6.81 | 80.82 ± 6.50 | 0.13 |
| Percent of sleep time in REM | 19.1 ± 6.69 | 19.05 ± 6.81 | 19.17 ± 6.5 | 0.67 |
| Minutes awake after sleep onset | 114.6 ± 66.28 | 114.68 ± 67.31 | 114.48 ± 64.66 | 0.94 |
| Current benzodiazepine use | 110 (4.67) | 70 (4.84) | 40 (4.4) | 0.62 |
| Current antidepressant use | 195 (8.28) | 126 (8.71) | 69 (7.58) | 0.33 |
| Current dopaminergic use | 27 (1.15) | 16 (1.11) | 11 (1.21) | 0.82 |
| Current use of anticonvulsants | 79 (3.35) | 45 (3.11) | 34 (3.74) | 0.41 |
| Education | 0.57 | |||
| < High school | 112 (4.75) | 65 (4.5) | 47 (5.16) | |
| High school | 402 (17.06) | 254 (17.57) | 148 (16.26) | |
| Some college or more | 1,842 (78.18) | 1,127 (77.94) | 715 (78.57) | |
| Smoking | 0.45 | |||
| Never | 925 (39.28) | 578 (39.97) | 347 (38.17) | |
| Past | 1,387 (58.9) | 839 (58.02) | 548 (60.29) | |
| Current | 43 (1.83) | 29 (2.01) | 14 (1.54) | |
| Alcohol intake, drinks/week | 0.02 | |||
| <1 | 1,084 (46.21) | 697 (48.37) | 387 (42.76) | |
| 1-13 | 1,136 (48.42) | 665 (46.15) | 471 (52.04) | |
| ≥14 | 126 (5.37) | 79 (5.48) | 47 (5.19) | |
| PASE physical activity score | 145.46 ± 70.66 | 143.82 ± 68.73 | 148.05 ± 73.59 | 0.16 |
| Depression symptom scoreb | 1.75 ± 2.11 | 1.82 ± 2.08 | 1.64 ± 2.14 | 0.005 |
Abbreviations: PLMI = periodic leg movement index; nREM = non-rapid eye-movement; REM=rapid eye movement; PASE = The Physical Activity Scale for the Elderly.
Data shown as mean ± SD or n (%).
P values for continuous variables are from a t-test if normally distributed, a Wilcoxon rank-sum test if skewed. P values for categorical data are from a chi-square test.
Apneas and hypopneas at ≥4% oxygen desaturation per hour of sleep.
Geriatric Depression Scale score, range 0-1
Allele frequencies for each of the five SNPs based on PLMI category (PLMI>15) are shown in Table 2. PLMI as a continuous measure was significantly associated with the number of risk alleles for 4 of the 5 SNPs examined (Figure 1). After multivariable adjustment, significant associations were observed between the PLMI outcome and the number of risk alleles for the two BTBD9 SNPs (rs9357271[T], OR=1.38; 95% CI 1.20- 1.58, and rs3923809[A], OR=1.43; 95% CI 1.26-1.63), one of the MEIS1 SNPs (rs2300478[G], OR=1.31; 95% CI 1.14-1.51) and the MAP2K5/SKOR1 SNP (rs1026732[G], OR=1.16; 95% CI 1.02-1.31) (Table 3). Analyses using PLMI cutoffs of >10 per hour (which constituted 67% of the cohort) were very similar, with slightly stronger associations of the PLMI outcome and the SNPs.
Table 2.
Allele Frequencies by Periodic Leg Movement Index (PLMI)
| Gene | SNP | All (N= 2356) | PLMI>=15 (N= 1446) | PLMI<15 (N= 910) | p value |
|---|---|---|---|---|---|
| BTBD9 | rs9357271 | 9.6E-07 | |||
| T_T | 1442 (61.21) | 926 (64.04) | 516 (56.7) | ||
| C_T | 788 (33.45) | 468 (32.37) | 320 (35.16) | ||
| C_C | 126 (5.35) | 52 (3.6) | 74 (8.13) | ||
| rs3923809 | 2.02E-08 | ||||
| A_A | 1137 (48.26) | 750 (51.87) | 387 (42.53) | ||
| G_A | 1000 (42.44) | 597 (41.29) | 403 (44.29) | ||
| G_G | 219 (9.3) | 99 (6.85) | 120 (13.19) | ||
| MEIS1 | rs6710341 | 0.15 | |||
| G_G | 53 (2.25) | 26 (1.8) | 27 (2.97) | ||
| G_A | 614 (26.06) | 385 (26.63) | 229 (25.16) | ||
| A_A | 1689 (71.69) | 1035 (71.58) | 654 (71.87) | ||
| rs2300478 | 0.00063 | ||||
| G_G | 153 (6.49) | 110 (7.61) | 43 (4.73) | ||
| G_T | 889 (37.73) | 569 (39.35) | 320 (35.16) | ||
| T_T | 1314 (55.77) | 767 (53.04) | 547 (60.11) | ||
| MAP2K5/SKOR1 | rs1026732 | 0.05 | |||
| G_G | 1081 (45.9) | 687 (47.51) | 394 (43.34) | ||
| A_G | 1009 (42.85) | 611 (42.25) | 398 (43.78) | ||
| A_A | 265 (11.25) | 148 (10.24) | 117 (12.87) | ||
P-values from a chi-square test.
Figure 1.
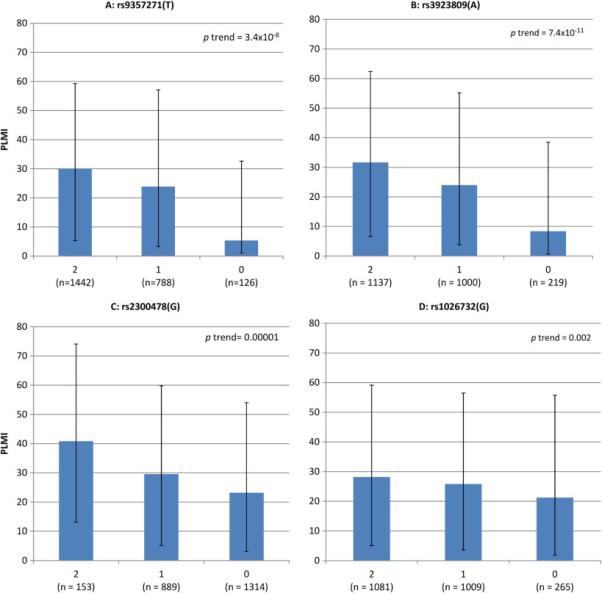
Periodic limb movement index (PLMI) in the four associated SNPs by number of risk alleles, median (inter quartile range)
Table 3.
Associations of SNPs with Periodic Leg Movement Index (PLMI≥15 vs. <15)
| Gene | SNP | Risk Allele Frequency | Age+Ancestry Marker Adjusted | Multivariablea Adjusted | ||
|---|---|---|---|---|---|---|
| OR (95% CI) | p value | OR (95% CI) | p value | |||
| BTBD9 | rs9357271(T) | 0.779 | 1.41 (1.23-1.63) | 1.14 × 10⁻⁶ | 1.38 (1.20-1.58) | 9.22 × 10⁻⁶ |
| rs3923809(A) | 0.695 | 1.45 (1.28-1.65) | 1.34 × 10⁻⁸ | 1.43 (1.26-1.63) | 6.45 × 10⁻⁸ | |
| MEIS1 | rs6710341(A) | 0.847 | 1.04 (0.88-1.22) | 0.68 | 1.04 (0.88-1.22) | 0.68 |
| rs2300478(G) | 0.254 | 1.33 (1.15-1.52) | 6.91 × 10⁻⁵ | 1.31 (1.14-1.51) | 0.0001 | |
| MAP2K5/SKOR1 | rs1026732(G) | 0.673 | 1.16 (1.02-1.31) | 0.02 | 1.16 (1.02-1.31) | 0.02 |
Abbreviations: PLMI = periodic leg movement index; SNP = single nucleotide polymorphism; OR= odds ratio; CI = confidence interval.
Adjusted for age, clinic, ancestry markers, apnea-hypopnea index ≥15, total sleep time, alcohol use, and number of depressive symptoms.
In further analyses, we included SNPs on the same gene in a multivariable model. In the multivariable model controlling for each of the BTBD9 SNPs, rs3923809[A] continued to be a significant predictor of a PLMI ≥ 15 but rs9357271[T] did not (rs3923809[A], OR=1.35; 1.13, 1.61 and rs9357271[T], OR=1.10; 0.90, 1.33) (Table 4). In the multivariable model controlling for each of the two MEIS1 SNPs, the rs6710341[A] SNP became a significant risk allele (OR=1.59; 95% CI 1.26-2.00) and rs2300478[G] maintained its significance as a risk allele (Table 4). When a SNP from each gene was combined in a multivariable model with the risk alleles as a continuous measure (0-6), the combined gene score was associated with a 1.28-fold increase in odds of having a PLMI≥15 per each additional risk allele (OR=1.28; 95% CI 1.19-1.38) (Table 4).
Table 4.
Associations of Combinations of SNPs with Periodic Leg Movement Index (PLMI≥15 vs. <15)
| Multivariablea Adjusted | ||
|---|---|---|
| Gene/SNP | OR (95% CI) | p value |
| BTBD9, SNP rs9357271(T)b | 1.10 (0.90-1.33) | 0.35 |
| BTBD9, SNP rs3923809(A)b | 1.35 (1.13-1.61) | 0.001 |
| MEIS1, SNP rs6710341(A)b | 1.59 (1.26-2.00) | 7.40 × 10⁻⁵ |
| MEIS1, SNP rs2300478(G)b | 1.70 (1.40-2.06) | 7.50 × 10⁻⁸ |
| Number of risk alleles for 1 SNP from each gene (0-6)c | 1.28 (1.19-1.38) | 1.69 × 10⁻¹⁰ |
Abbreviations: SNP = single nucleotide polymorphism; PLMI = periodic leg movement index; OR= odds ratio; CI = confidence interval.
Adjusted for age, clinic, ancestry markers, apnea-hypopnea index ≥15, total sleep time, alcohol use, and number of depressive symptoms.
Results from a model containing both SNPs from this gene as separate predictors (0,1,2).
Number of A alleles for rs3923809, number of G alleles for rs2300478, number of G alleles for rs1026732.
DISCUSSION
Our findings in a general cohort of older Caucasian men confirm a previous report of an association of the BTBD9 SNP rs3923809 (A allele) and PLMS in two groups selected for the presence of RLS (3). It further extends the association of PLMS to SNPs in the MEIS1 and MAP2K5/SKOR1 genes as well as to another BDBD9 SNP, all originally identified from RLS populations using GWAS (4, 20-22), and all in the elderly who have the highest rates of PLMS. We also establish these genetic associations using PLMS derived from full polysomnographic recordings, which, unlike the original GWAS study, allow us to distinguish leg movements occurring during sleep from those during recumbent wake.
Our point estimates for the association of BTBD9 and MEIS1 SNPs with a PLMI≥15 are very similar to those recently determined by Moore et al.(5), who like us, also found that the independent effects of each BTBD9 SNP were stronger than those of the MEIS1 SNPs for PLMI. However, in conditional analyses (assessing the independent effects of the two SNPs in each gene), we found that the MEIS1 SNPs had individually stronger effects than any of the other SNPs examined. Further, the BTBD9 SNPs had substantially lower point estimates when examined independently than when tested individually. Future investigations should consider such analyses when assessing the role of these SNPs into both PLMS and RLS. Finally, the similarity of the ORs in our study and Moore's is notable given that they used different methods for leg movement detection (surface EMG vs accelerometry) and scoring (automatic scoring vs hand scoring).
An important distinction between the Moore et al study (5) and ours is that they studied subjects in a very narrow middle-age range (59.7 ± 0.17 yrs) whereas our subjects were substantially older (76.5 ± 5.58 yrs). As PLMS become more prominent with age (23) it is not surprising that whereas only 33% of subjects in the Moore paper had a PLMI>15, 61% met this criterion in our study. The fact that these SNPs predicted PLMI in this older group is significant as it demonstrates that genetics continues to play an important role in PLMS even at an age when leg movements develop in the majority of the population.
BTBD9 is broadly expressed in the brain as well as in visceral organs though its function is not well understood. It has been associated with both primary as well as secondary RLS (24) as well as Tourette's syndrome (25). BTBD9 knockouts produce abnormal sleep and motor activity in both mice (26) and Drosophila (27). MEIS1 is a transcription factor known to be involved in neuronal development and connectivity, and rare variants have recently been associated with RLS (28). The rs1026732 SNP is between the MAP2K5 and SKOR1 genes, both of which have been implicated in neuronal function.
As we have previously proposed, PLMS may be an endophenotype for RLS (29). Endophenotypes are stable, biologically heritable, quantifiable aspects of a more complex disorder. In this way, PLMS may provide insights into the pathophysiology of RLS and/or identify subtypes of RLS that may respond to specific therapeutic interventions. PLMS and RLS may also be part of a disease continuum in which PLMS without RLS represents subclinical disease and increasing leg movement frequency and intensity may be a marker for a more clinically virulent form of RLS.
There are a number of limitations to this study. Our data is limited to older Caucasian men and may not be generalizable to other populations. Piezoelectric sensors and not the gold standard anterior tibialis electromyography were used to measure PLMS. However, PLMI scored using our approach (i.e.., 1993 scoring criteria with piezoelectric sensors) is highly correlated (r=0.81) with the PLMI derived using the 2013 (30) scoring criteria and use of anterior tibialis EMG (14). Further, the similarity of our BTBD9 and MEIS1 SNP ORs to those of Moore et al (5) who used surface EMG suggests that the two recording methods define substantially similar movements. The assessment of PLMS was performed on a single night, and given night to night variability of leg movements, we may have misclassified some participants (31). However, this would likely bias the associations of these SNPs and PLMS toward the null. Further, analysis of the data using a PLMI cutoff of >10 rather than >15 (which minimizes the effects of night to night variability) did not change the associations with these SNPs. Finally, we did not examine all RLS-related SNPs and future studies should also include other SNPs such as TOX3/BC034767 and PTPRD(A).
Highlights.
PLMS are associated with single nucleotide polymorphisms (SNPs).
Logistic regression was used to associate SNPs to polysomnographic measured PLMS.
Two BTBD9, one MEIS1 and one MAP2K5/SKOR1 SNPs were associated with PLMS>15
Genetics continues to play an important role in PLMS even in the elderly
Acknowledgments
Study Funding
The Osteoporotic Fractures in Men (MrOS) Study is supported by National Institutes of Health funding. The following institutes provide support: the National Institute on Aging (NIA), the National Institute of Arthritis and Musculoskeletal and Skin Diseases (NIAMS), the National Center for Advancing Translational Sciences (NCATS), and NIH Roadmap for Medical Research under the following grant numbers: U01 AG027810, U01 AG042124, U01 AG042139, U01 AG042140, U01 AG042143, U01 AG042145, U01 AG042168, U01 AR066160, and UL1 TR000128. The National Heart, Lung, and Blood Institute (NHLBI) provides funding for the MrOS Sleep ancillary study “Outcomes of Sleep Disorders in Older Men” under the following grant numbers: R01 HL071194, R01 HL070848, R01 HL070847, R01 HL070842, R01 HL070841, R01 HL070837, R01 HL070838, and R01 HL070839. Genetics data was funded by grant 1R01AG030474 from National Institute of Aging.
Footnotes
Publisher's Disclaimer: This is a PDF file of an unedited manuscript that has been accepted for publication. As a service to our customers we are providing this early version of the manuscript. The manuscript will undergo copyediting, typesetting, and review of the resulting proof before it is published in its final form. Please note that during the production process errors may be discovered which could affect the content, and all legal disclaimers that apply to the journal pertain.
Financial Disclosures
Dr. Stone, Dr. Tranah and Ms. Blackwell report no disclosures. Dr. Ancoli-Israel is a consultant or on the advisory board for Astra Zeneca, Ferring Pharmaceuticals Inc, GlaxoSmithKline, Hypnocore, Johnson & Johnson, Merck, NeuroVigil Inc, and Purdue Pharma LP. Dr. Redline's institution has received grant funding from ResMed, Inc, Philips Respironics and ResMed Foundation and equipment from them for use in NIH studies. Dr. Winkelman is a consultant or on the advisory board for Flex Pharma, Insys, Merck, UCB Pharma, and Xenoport. His institution has received grant funding from NeuroMetrix, Purdue and UCB Pharma.
This is not an industry-sponsored study. The funding agencies had no direct role in the conduct of the study; the collection, management, analyses and interpretation of the data; or preparation or approval of the manuscript.
REFERENCES
- 1.Rye DB, Trotti LM. Restless legs syndrome and periodic leg movements of sleep. Neurol Clin. 2012 Nov;30(4):1137–66. doi: 10.1016/j.ncl.2012.08.004. [DOI] [PubMed] [Google Scholar]
- 2.Pennestri MH, Montplaisir J, Colombo R, Lavigne G, Lanfranchi PA. Nocturnal blood pressure changes in patients with restless legs syndrome. Neurology. 2007 Apr 10;68(15):1213–8. doi: 10.1212/01.wnl.0000259036.89411.52. [DOI] [PubMed] [Google Scholar]
- 3.Stefansson H, Rye DB, Hicks A, Petursson H, Ingason A, Thorgeirsson TE, et al. A genetic risk factor for periodic limb movements in sleep. The New England journal of medicine. 2007 Aug 16;357(7):639–47. doi: 10.1056/NEJMoa072743. [DOI] [PubMed] [Google Scholar]
- 4.Winkelmann J, Schormair B, Lichtner P, Ripke S, Xiong L, Jalilzadeh S, et al. Genome-wide association study of restless legs syndrome identifies common variants in three genomic regions. Nature genetics. 2007 Aug;39(8):1000–6. doi: 10.1038/ng2099. [DOI] [PubMed] [Google Scholar]
- 5.Moore Ht, Winkelmann J, Lin L, Finn L, Peppard P, Mignot E. Periodic Leg Movements during Sleep Are Associated with Polymorphisms in BTBD9, TOX3/BC034767, MEIS1, MAP2K5/SKOR1, and PTPRD. Sleep. 2014;37(9):1535–42. doi: 10.5665/sleep.4006. [DOI] [PMC free article] [PubMed] [Google Scholar]
- 6.Orwoll E, Blank JB, Barrett-Connor E, Cauley J, Cummings S, Ensrud K, et al. Design and baseline characteristics of the osteoporotic fractures in men (MrOS) study--a large observational study of the determinants of fracture in older men. Contemp Clin Trials. 2005 Oct;26(5):569–85. doi: 10.1016/j.cct.2005.05.006. [DOI] [PubMed] [Google Scholar]
- 7.Blank JB, Cawthon PM, Carrion-Petersen ML, Harper L, Johnson JP, Mitson E, et al. Overview of recruitment for the osteoporotic fractures in men study (MrOS). Contemp Clin Trials. 2005 Oct;26(5):557–68. doi: 10.1016/j.cct.2005.05.005. [DOI] [PubMed] [Google Scholar]
- 8.Redline S, Sanders MH, Lind BK, Quan SF, Iber C, Gottlieb DJ, et al. Methods for obtaining and analyzing unattended polysomnography data for a multicenter study. Sleep Heart Health Research Group. Sleep. 1998 Nov 1;21(7):759–67. [PubMed] [Google Scholar]
- 9.ASDA EEG arousals: scoring rules and examples: a preliminary report from the Sleep Disorders Atlas Task Force of the American Sleep Disorders Association. Sleep. 1992 Apr;15(2):173–84. [PubMed] [Google Scholar]
- 10.Berry RB, Budhiraja R, Gottlieb DJ, Gozal D, Iber C, Kapur VK, et al. Rules for scoring respiratory events in sleep: update of the 2007 AASM Manual for the Scoring of Sleep and Associated Events. Deliberations of the Sleep Apnea Definitions Task Force of the American Academy of Sleep Medicine. Journal of clinical sleep medicine : JCSM : official publication of the American Academy of Sleep Medicine. 2012 Oct 15;8(5):597–619. doi: 10.5664/jcsm.2172. [DOI] [PMC free article] [PubMed] [Google Scholar]
- 11.Medicine AAoS Recording and scoring leg movements. The Atlas Task Force. Sleep. 1993 Dec;16(8):748–59. [PubMed] [Google Scholar]
- 12.Medicine AAoS . The International Classification of Sleep Disorders, Revised: Diagnostic and Coding Manual (ICSD-2) American Academy of Sleep Medicine (AASM); Chicago, Illinois: 2001. [Google Scholar]
- 13.Kobayashi M, Namba K, Ito E, Nishida S, Nakamura M, Ueki Y, et al. The validity of the PAM-RL device for evaluating periodic limb movements in sleep and an investigation on night-tonight variability of periodic limb movements during sleep in patients with restless legs syndrome or periodic limb movement disorder using this system. Sleep medicine. 2014 Jan;15(1):138–43. doi: 10.1016/j.sleep.2013.08.790. [DOI] [PubMed] [Google Scholar]
- 14.Claman DM, Ewing SK, Redline S, Ancoli-Israel S, Cauley JA, Stone KL. Periodic leg movements are associated with reduced sleep quality in older men: the MrOS Sleep Study. Journal of clinical sleep medicine : JCSM : official publication of the American Academy of Sleep Medicine. 2013;9(11):1109–17. doi: 10.5664/jcsm.3146. [DOI] [PMC free article] [PubMed] [Google Scholar]
- 15.Evans DS, Parimi N, Nievergelt CM, Blackwell T, Redline S, Ancoli-Israel S, et al. Common genetic variants in ARNTL and NPAS2 and at chromosome 12p13 are associated with objectively measured sleep traits in the elderly. Sleep. 2013 Mar;36(3):431–46. doi: 10.5665/sleep.2466. [DOI] [PMC free article] [PubMed] [Google Scholar]
- 16.Pahor M, Chrischilles EA, Guralnik JM, Brown SL, Wallace RB, Carbonin P. Drug data coding and analysis in epidemiologic studies. Eur J Epidemiol. 1994 Aug;10(4):405–11. doi: 10.1007/BF01719664. [DOI] [PubMed] [Google Scholar]
- 17.Washburn RA, Smith KW, Jette AM, Janney CA. The Physical Activity Scale for the Elderly (PASE): development and evaluation. J Clin Epidemiol. 1993 Feb;46(2):153–62. doi: 10.1016/0895-4356(93)90053-4. [DOI] [PubMed] [Google Scholar]
- 18.Sheikh JYJ. Geriatric Depression Scale: recent evidence and development of a shorter version. Clin Gerontol. 1986;5:165–73. [Google Scholar]
- 19.Purcell S, Neale B, Todd-Brown K, Thomas L, Ferreira MA, Bender D, et al. PLINK: a tool set for whole-genome association and population-based linkage analyses. Am J Hum Genet. 2007 Sep;81(3):559–75. doi: 10.1086/519795. [DOI] [PMC free article] [PubMed] [Google Scholar]
- 20.Vilarino-Guell C, Farrer MJ, Lin SC. A genetic risk factor for periodic limb movements in sleep. The New England journal of medicine. 2008 Jan 24;358(4):425–7. doi: 10.1056/NEJMc072518. [DOI] [PubMed] [Google Scholar]
- 21.Kemlink D, Polo O, Frauscher B, Gschliesser V, Hogl B, Poewe W, et al. Replication of restless legs syndrome loci in three European populations. Journal of medical genetics. 2009 May;46(5):315–8. doi: 10.1136/jmg.2008.062992. [DOI] [PMC free article] [PubMed] [Google Scholar]
- 22.Yang Q, Li L, Chen Q, Foldvary-Schaefer N, Ondo WG, Wang QK. Association studies of variants in MEIS1, BTBD9, and MAP2K5/SKOR1 with restless legs syndrome in a US population. Sleep medicine. 2011 Sep;12(8):800–4. doi: 10.1016/j.sleep.2011.06.006. [DOI] [PMC free article] [PubMed] [Google Scholar]
- 23.Ferri R, Manconi M, Lanuzza B, Cosentino FI, Bruni O, Ferini-Strambi L, et al. Age-related changes in periodic leg movements during sleep in patients with restless legs syndrome. Sleep medicine. 2008;9:790–8. doi: 10.1016/j.sleep.2007.08.020. [DOI] [PubMed] [Google Scholar]
- 24.Schormair B, Plag J, Kaffe M, Gross N, Czamara D, Samtleben W, et al. MEIS1 and BTBD9: genetic association with restless leg syndrome in end stage renal disease. Journal of medical genetics. 2011 Jul;48(7):462–6. doi: 10.1136/jmg.2010.087858. [DOI] [PMC free article] [PubMed] [Google Scholar]
- 25.Riviere JB, Xiong L, Levchenko A, St-Onge J, Gaspar C, Dion Y, et al. Association of intronic variants of the BTBD9 gene with Tourette syndrome. Archives of neurology. 2009 Oct;66(10):1267–72. doi: 10.1001/archneurol.2009.213. [DOI] [PubMed] [Google Scholar]
- 26.DeAndrade MP, Johnson RL, Jr., Unger EL, Zhang L, van Groen T, Gamble KL, et al. Motor restlessness, sleep disturbances, thermal sensory alterations and elevated serum iron levels in Btbd9 mutant mice. Hum Mol Genet. 2012 Sep 15;21(18):3984–92. doi: 10.1093/hmg/dds221. [DOI] [PMC free article] [PubMed] [Google Scholar]
- 27.Freeman A, Pranski E, Miller RD, Radmard S, Bernhard D, Jinnah HA, et al. Sleep fragmentation and motor restlessness in a Drosophila model of Restless Legs Syndrome. Curr Biol. 2012 Jun 19;22(12):1142–8. doi: 10.1016/j.cub.2012.04.027. [DOI] [PMC free article] [PubMed] [Google Scholar]
- 28.Schulte EC, Kousi M, Tan PL, Tilch E, Knauf F, Lichtner P, et al. Targeted resequencing and systematic in vivo functional testing identifies rare variants in MEIS1 as significant contributors to restless legs syndrome. Am J Hum Genet. 2014 Jul 3;95(1):85–95. doi: 10.1016/j.ajhg.2014.06.005. [DOI] [PMC free article] [PubMed] [Google Scholar]
- 29.Winkelman JW. Periodic limb movements in sleep--endophenotype for restless legs syndrome? The New England journal of medicine. 2007 Aug 16;357(7):703–5. doi: 10.1056/NEJMe078129. [DOI] [PubMed] [Google Scholar]
- 30.Berry RBBR, Gamaldo CE, Harding SM, Lloyd RM, Marcus CL, Vaughn BV, for the American Academy of Sleep Medicine . The AASM Manual for the Scoring of Sleep and Associated Events: Rules, Terminology and Technical Specifications, Version 2.0.2. American Academy of Sleep Medicine; Darien, IL: 2013. [Google Scholar]
- 31.Trotti LM, Bliwise DL, Greer SA, Sigurdsson AP, Gudmundsdottir GB, Wessel T, et al. Correlates of PLMs variability over multiple nights and impact upon RLS diagnosis. Sleep medicine. 2009 Jun;10(6):668–71. doi: 10.1016/j.sleep.2008.06.009. [DOI] [PubMed] [Google Scholar]