

Abstract
Recent advances in imaging technology have revealed oscillations of cyclic adenosine monophosphate (cAMP) in insulin-secreting cells. These oscillations may be in phase with cytosolic calcium oscillations or out of phase. cAMP oscillations have previously been modeled as driven by oscillations in calcium, based on the known dependence of the enzymes that generate cAMP (adenylyl cyclase) and degrade it (phosphodiesterase). However, cAMP oscillations have also been reported to occur in the absence of calcium oscillations. Motivated by similarities between the properties of cAMP and metabolic oscillations in pancreatic β cells, we propose here that in addition to direct control by calcium, cAMP is controlled by metabolism. Specifically, we hypothesize that AMP inhibits adenylyl cyclase. We incorporate this hypothesis into the dual oscillator model for β cells, in which metabolic (glycolytic) oscillations cooperate with modulation of ion channels and metabolism by calcium. We show that the combination of oscillations in AMP and calcium in the dual oscillator model can account for the diverse oscillatory patterns that have been observed, as well as for experimental perturbations of those patterns. Predictions to further test the model are provided.
Introduction
The electrical activity that raises Ca2+ to drive hormone secretion is in many cases triggered by hormone or peptide signals, which regulate ion channels and kinases via second messengers such as cyclic adenosine monophosphate (cAMP). Second messengers may also amplify the Ca2+ signal by enhancing trafficking of exocytotic vesicles to the plasma membrane (1–3). The main signal for insulin secretion from pancreatic β cells, in contrast, is glucose metabolism, which raises Ca2+ by closure of ATP-dependent K+ (K(ATP)) channels. Receptor-generated second messengers are important, but act mainly to enhance the effects of Ca2+ (4). In β cells, cAMP is increased potently by the gut-derived hormones glucagon-like peptide-1 and gastric inhibitory polypeptide, which are called incretins, because they mediate the increased secretion seen when glucose is delivered orally rather than by injection (5).
It has further been demonstrated that glucose itself increases the cAMP concentration; this has been shown in rat INS-1E insulinoma cells (6), MIN6 cells (7,8), primary rat β cells (9,10), mouse β cells (8,11), and human β cells (12). For the human cells, it was shown that lipotoxicity mediated by palmitate involves, at least in part, reduction of the glucose stimulation of cAMP. Thus, cAMP plays an important physiological role as a second messenger in insulin release from islets and is regulated by both hormones and glucose metabolism (13,14). Recent studies using FRET-based sensors (7) and evanescent-wave microscopy (8,15) have shown that the intracellular cAMP concentration oscillates in incretin-stimulated or glucose-stimulated β cells or cell lines. These oscillations range from fast (∼1 min period) (7,15) to slow (∼5 min period) (8,16). When measured simultaneously with intracellular Ca2+, the cAMP concentration has been observed to oscillate either in phase (8,15) or out of phase with fast Ca2+ oscillations (7). In addition, slow oscillations of cAMP have been reported in the presence of stimulatory glucose while the Ca2+ concentration is non-oscillatory (8), or Ca2+ entry is inhibited by EGTA or a Ca2+-channel blocker (8,16). Such oscillations are noteworthy, as they may contribute to pulsatile insulin secretion observed from islets in which the Ca2+ level is stable (17). Given these complex findings, the oscillation mechanism or mechanisms are not obvious.
The Ca2+ concentration in glucose-stimulated islets is typically oscillatory. These oscillations are due to bursting electrical activity, which itself exhibits both fast and slow oscillations. We have proposed that these two classes of oscillations result from two different mechanisms. One mechanism is Ca2+ feedback onto K+ channels (18–20). We refer to the resulting fast oscillations in Ca2+ concentration as electrical Ca2+ oscillations, and in this case the cytosolic levels of the adenine nucleotides ATP, ADP, and AMP remain relatively constant (21). The second mechanism for bursting electrical activity is oscillations in metabolism, possibly mediated by glycolytic oscillations (22–24). In this case, nucleotide levels exhibit significant oscillations, which would be reflected in the electrical activity due to the actions of ADP and ATP on K(ATP) channels. These oscillations in metabolism can persist when the Ca2+ concentration is stable, demonstrating that these metabolic oscillations (MOs) are not simply responding to oscillatory Ca2+, though they are strongly influenced by the Ca2+ level (25).
The finding that MOs can persist in the absence of Ca2+ oscillations is strikingly similar to the finding that cAMP oscillations can occur with a stable level of Ca2+. This leads us to propose in this report that the various data on cAMP oscillations in β cells and cell lines, including their relationship with the cytosolic Ca2+ concentration and their persistence in stable levels of Ca2+, can be accounted for by a single model that incorporates the two mechanisms for Ca2+ oscillations described above. Using this model, called the dual oscillator model (DOM) (23), we show that the slow (5 min) cAMP oscillations occur naturally as the result of MOs.
We hypothesize that this is mediated primarily by oscillations in AMP, which inhibits adenylyl cyclase (AC) (26–28). Although we propose that slow cAMP oscillations are due to MOs, the faster cAMP oscillations are likely due to Ca2+ oscillations. These cAMP oscillations could be either in phase or out of phase with Ca2+, depending on the Ca2+ affinities of the several forms of Ca2+-activated AC and phosphodiesterase (PDE) expressed in β cells (29–31). The possible phase relationships between Ca2+ and cAMP during fast oscillations have been explored previously (32). Our explanation is similar to the explanation in that article, although implemented differently (see the Discussion). If AC is more sensitive to changes in Ca2+ than PDE, then cAMP oscillations will be in phase with those of Ca2+; if PDE is more sensitive, then cAMP oscillations will be in antiphase with those of Ca2+.
In this article, we explore the range of possible cAMP oscillations, and their relationship to Ca2+ oscillations, given that both Ca2+ and AMP influence the cAMP concentration. This interpretation is made in the context of the DOM, and provides the most parsimonious explanation for the oscillatory cAMP in the full range of behaviors observed in islets, which are otherwise difficult to explain. This model for cAMP oscillations also generates predictions that can be tested experimentally.
Materials and Methods
We base our model for cAMP oscillations on the DOM, which accounts for both fast and slow Ca2+ oscillations in β cells (23,33). Although the metabolic and electrical components can oscillate independently, they are bidirectionally coupled, and oscillations in one component impact the other (see Fig. 7). In the DOM, the MOs are due to oscillations in glycolysis, which are conditional, i.e., they depend on the values of system parameters. When other parameters are permissive, the MOs generally occur only for an intermediate range of glucose levels. When slow MOs are absent, faster electrical Ca2+ oscillations may still occur.
Figure 7.
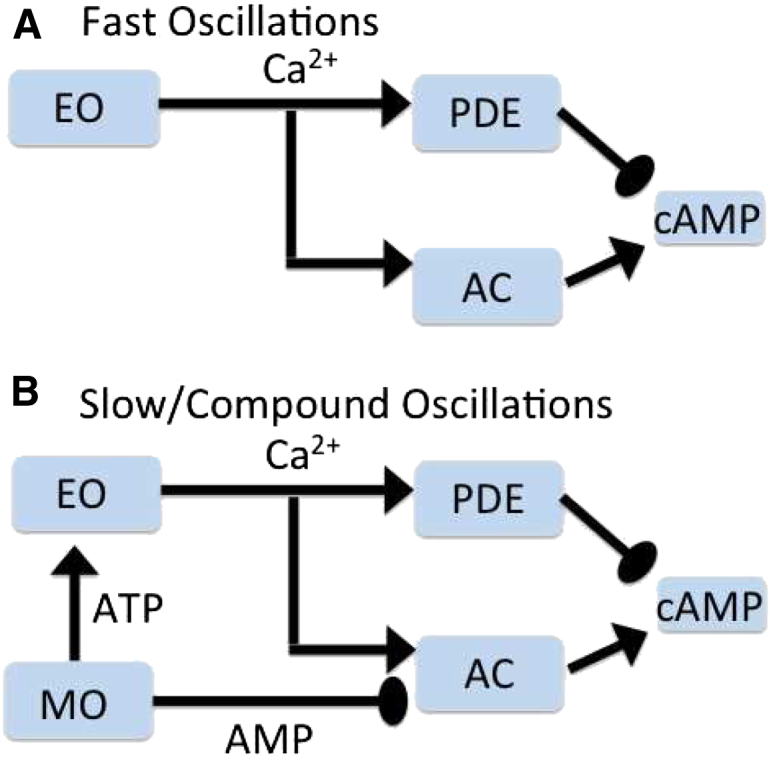
Central hypothesis. Pathways for fast oscillations (A) and slow or coumpound oscillations (B). Glucose activates glycolysis, which may either be steady or oscillate. Calcium oscillations are driven by either MOs or EOs or both. Calcium oscillations can lead to cAMP oscillations through calcium-sensitive ACs and PDEs. We propose in addition that oscillations in AMP, an inhibitor of AC, also directly and independently drive cAMP oscillations.
Alternatively, the fast and slow oscillations may coexist, producing compound bursting, which consists of episodes of fast oscillations separated by long periods of electrical silence (34–36). The driver of glycolytic oscillations in the DOM is the allosteric enzyme phosphofructokinase (PFK). This enzyme is stimulated by its product fructose 1,6-bisphosphate (FBP), causing a surge of FBP production (positive feedback) but also partially depleting its substrate, fructose 6-phosphate, which brings FBP back down (negative feedback). The substrate level is controlled by the enzyme glucokinase (GK) and is increased when the glucose level is increased. We therefore use the GK reaction rate as a surrogate for the glucose level (i.e., increases with glucose).
To address the proposition that the MOs are an independent driver of cAMP oscillations, we couple the DOM to dynamics for cAMP. We utilize an equation for cAMP adapted from the models of Yu et al. (37) for the neuron R15 in the sea slug Aplysia and of Fridlyand et al. (32) for the β cell. In those models, AC and PDE have both Ca2+-sensitive and Ca2+-insensitive components. In Yu et al. (37) and Lindskog et al. (38), AC and PDE were modeled as sensitive to Ca2+ through a calmodulin cascade, but we simplify this effect to a third-order saturating function of Ca2+ alone. This simplification has minimal effect on the output. We denote the AC and PDE affinities for Ca2+ as and , respectively. We adjust these sensitivities to high- and low-affinity values to consider the effect of different sensitivity levels on the phase between cAMP and Ca2+ during oscillations (see Table 1).
Table 1.
Base parameter values for the cAMP component of the model
| Kacamp = 200 μM | Kpdecamp = 3 μM |
| Kacca = 0.1 μM | Kpdeca = 0.1 μM |
| 0.0006 μM/ms | 0.0024 μM/ms |
The above parameters were used except as noted in the figure legends. Values were taken from Yu et al. (37), except for Kacca, Kdecca, and p, which are generated by fitting an equilibrated calcium/calmodulin expression in Yu et al. (37) to . Parameter changes for each figure are stated explicitly in the caption.
Studies of purified ACs have shown that they have high affinity for the substrate ATP (Km ∼ 100 μM) (39), and there is evidence that they provide the majority of basal cAMP in the INS-1E β-cell line (6). Davis and Lazarus (40) reported a somewhat larger Km (320 μM), and it is possible that the affinity for ATP may be lower in intact cells than in isolation, but in the absence of evidence for this, we assume that AC is saturated for ATP and that ATP does not play a major role in driving cAMP oscillations. We propose instead that AMP, an inhibitor for AC with affinity ∼200 μM (26–28), couples metabolism to cAMP production. We model AC as a decreasing function of AMP that has half-inhibition constant (Eq. 1). Because there is uncertainty about the importance of different AC isoforms and about the affinity in β cells, we explore, in the section on sensitivity analysis, a range of possible affinity values.
Combining these elements results in the following equations:
| (1) |
where
| (2) |
and
| (3) |
Base parameter values are listed in Table 1.
We do not incorporate the feedback of cAMP on Ca2+ present in the model of Ni et al. (41) as this is not needed to account for the experimental data we consider. In the Fridlyand study (32), the cAMP model of Yu et al. (37) was combined with an electrical model for the β cell and used to study Ca2+ modulation of cAMP production through AC and PDE. The maximal production rate of the Ca2+-dependent AC component was varied to simulate GLP-1 activation of AC and to demonstrate that when the effect on AC is dominant, Ca2+ and cAMP oscillate in phase. In contrast, when the effect of Ca2+ on PDE is dominant, the oscillations are out of phase. Below, we show similar effects by varying the AC and PDE sensitivities to Ca2+.
Our model is similar to the model of Fridlyand et al. (32) with respect to effects of Ca2+ on cAMP but can, in addition, account for cAMP oscillations in the absence of Ca2+ oscillations. This is achieved by combining Eqs. 1–3 with the DOM, which produces fast and slow Ca2+ oscillations and can produce slow MOs when Ca2+ is fixed. The version of the DOM used here is based on that of Watts et al. (42), with minor modifications to make AMP dynamic. Those changes are spelled out in the Appendix.
We solve the system using XPPAUT (43) and Matlab (The Mathworks, Natick, MA). Code may be found in the Supporting Material or downloaded from http://www.math.fsu.edu/∼bertram/software/islet.
Results
Slow oscillations in cAMP are due to MOs
The cAMP oscillations reported in the literature are sometimes slow, with a period of ∼5 min, and sometimes fast, with a period of ∼1 min or less. We begin by addressing the origin of the slow oscillations using the DOM.
The slow glycolytic oscillations in the DOM travel down the metabolic pathway, producing oscillations in the nucleotides AMP, ADP, and ATP. The latter two act on K(ATP) channels to produce periodic bursts of electrical activity. Each burst brings Ca2+ into the cell, resulting in oscillations in the intracellular Ca2+ concentration (Fig. 1 A).
Figure 1.

cAMP oscillations can occur without calcium oscillations. Application of Dz is simulated by setting the K(ATP) channel open fraction to 1 (Eq. 9). In the left column, GK activity (μM/s) is slightly larger than in the right column (μM/s). Although Ca2+ oscillations cease in both (A) and (B), FBP, AMP (E and F), and cAMP (G and H) oscillations may be abolished (left column) or persist (right column). = 16,000 pS.
The rise in ATP levels that accompanies each pulse of glycolytic activity comes at the expense of ADP and AMP. In particular, AMP declines when FBP rises (Fig. 1, C and E). Since AMP is an AC inhibitor, a decline in AMP causes an increase in the cAMP concentration (Fig. 1 G). In this way, slow glycolytic oscillations produce slow oscillations in the cAMP level that are in phase with slow Ca2+ oscillations.
The slow oscillations in cAMP shown in Fig. 1 G (first 20 min) have a period similar to cAMP oscillations measured using evanescent-wave fluorescence imaging in islet β cells (16) and in MIN6 cells (8) when stimulated with glucose. In addition, simultaneous measurements of cAMP and Ca2+ using this same technique showed that the two oscillated in phase with one another (Fig. 2 D in Dyachok et al. (8) and Fig. 5 B in Tianet al. (16)), as is the case in Fig. 1 here. Other studies showed out-of-phase oscillations of cAMP and Ca2+, but these oscillations were much faster (7). We consider the faster oscillations below (see Fig. 4).
Figure 2.

Glucose elevation, but not Ca2+ oscillations, are required for cAMP oscillations. Depolarization with KCl in the presence of Dz (simulated by raising the reversal potential for K+ from mV to 62.5 mV) is ineffective at generating oscillations in calcium (A) or cAMP (D). However, raising glucose to a stimulatory level (simulated by increasing from 0.03 μM/s to 0.12 μM/s) induces oscillations in FBP (B), AMP (C), and cAMP without oscillations in Ca2+. = 16,000 pS.
Figure 5.

Sensitivities of AC and PDE to changes in Ca2+ control the phase relationship of fast oscillations during compound bursting ( = 17,500 pS and μM/s). (A) Slow MOs combine with [Ca2+]i oscillations to produce compound AMP oscillations. (B and C) Two cases of AC and PDE sensitivity, as in the corresponding panels of Fig. 4. The slow AMP oscillations add a slow component to cAMP oscillations. The AMP teeth and fast [Ca2+]i bursts within each slow episode affect cAMP production as in the pure fast EOs in Fig. 4, resulting in cAMP oscillations that are in phase or out of phase with Ca2+.
Figure 4.

Sensitivities of AC and PDE to changes in Ca2+ control the phase relationship in fast EOs. (A) Electrical oscillations, obtained by setting μM/s and = 18,000 pS, drive the use of ATP, generating small-amplitude AMP oscillations. (B) When basal Ca2+ saturates AC , cAMP is out of phase with Ca2+, as in Landa et al. (7). (Out-of-phase oscillations can alternatively be produced by lowering from 3.0 to 1.0, similar to the procedure in the Landa study (7).) (C) When basal Ca2+ does not saturate AC , cAMP and Ca2+ are in phase, as in Dyachok et al. (15).
Membrane hyperpolarization can terminate cAMP oscillations by inhibiting glycolytic oscillations
It has been shown that cAMP oscillations can be inhibited by hyperpolarization of the plasma membrane in MIN6 and islet β cells (Fig. 3 in Dyachok et al. (8)). This hyperpolarization was achieved by the addition of diazoxide (Dz), a K(ATP) channel activator, to medium containing a stimulatory level of glucose. The most direct explanation for the lack of cAMP oscillations under these conditions is that the hyperpolarization terminates Ca2+ oscillations, which, through actions on AC and PDE, terminate cAMP oscillations. In Fig. 1, we present an alternative explanation for the termination of cAMP oscillations by membrane hyperpolarization, which is more complex but accounts for a wider range of phenomena. We begin with slow Ca2+ oscillations in Fig. 1 A that are terminated with the simulated application of Dz, which brings Ca2+ to a low, steady level. With the reduction of Ca2+ influx, less pumping is required to keep the cell in homeostasis, so that ATP utilization is reduced, the ATP concentration rises, and the corresponding AMP level drops. ATP is a well-known inhibitor of PFK (44,45), so the rise in ATP partially inhibits PFK and eventually terminates the glycolytic oscillations (Fig. 1 C) and, consequently, the oscillations in the ATP and AMP levels (Fig. 1 E). In our model, it is the termination of AMP oscillations that is responsible for the termination of cAMP oscillations (Fig. 1 G).
Figure 3.

Model prediction that depolarization can rescue cAMP oscillations. Sustained oscillations in Ca2+ (A), metabolism (B and C), and cAMP (D) in stimulatory glucose (μM/s) are suppressed by application of Dz. Ca2+ immediately stops oscillating and cAMP transiently rings to an elevated steady state. Depolarization with extracellular potassium (simulated by increasing the K+ Nernst potential, , to mV) is effective at generating oscillations in metabolism and cAMP (D), but not in Ca2+ (A). = 16,000 pS.
In the simulations in the left column of Fig. 1, Dz terminated both the Ca2+oscillations and the AMP oscillations, so in an experimental setting, it would not be apparent which factor is responsible for terminating the cAMP oscillations. The model, however, provides a way to determine this. It predicts that it is possible to maintain MOs with Dz-induced membrane hyperpolarization, which was confirmed experimentally in Merrins et al. (25). The DOM, now augmented with AMP-sensitive production of cAMP, makes a further prediction that cAMP oscillations can persist, in some cases, in the presence of Dz.
This is illustrated in the right column of Fig. 1, where the persistence of MOs is a consequence of a lower GK rate than in the left column. We expect, however, that in the presence of Dz, the oscillation amplitude would be reduced and the frequency possibly altered compared to glucose alone (Fig. 1 H). In fact, Dyachok et al. (8) reported that cAMP oscillations persisted with reduced amplitude in the presence of a Ca2+ channel blocker (their Fig. 2 A) and in EGTA (their Fig. 2 B).
Depolarization can rescue cAMP oscillations in the absence of Ca2+ oscillations
To test whether cAMP oscillations are due to Ca2+ oscillations, Dyachok et al. used a Ca2+ clamp protocol (8). They showed in MIN6 and islet β cells (Fig. 3, C and D, respectively, in the Dyachok study (8)) that cAMP oscillations were initiated when the glucose level was increased from 3 mM to 11 mM in the continued presence of Dz and KCl. That experiment is simulated in Fig. 2, where Dz is applied initially in the presence of a substimulatory level of glucose. This results in a low and stationary level of Ca2+ and no oscillations in metabolism or cAMP. The addition of KCl is simulated by raising the K+ Nernst potential. The depolarization increases Ca2+ but does not initiate either Ca2+ oscillations (Fig. 2 A) or oscillations in metabolism (Fig. 2, B and C) or cAMP. However, when the glucose level is raised to a stimulatory level (simulated by increasing the GK rate), slow oscillations are initiated in metabolism, which lead to oscillations in cAMP (Fig. 2 D). This occurs because the higher glucose level activates PFK sufficiently to initiate glycolytic oscillations. After glucose is lowered to a substimulatory level, the oscillations in metabolism and cAMP cease.
Although metabolism was not measured in the study of Dyachok et al. (8), their findings are consistent with the simulation in Fig. 2 and with the hypothesis that the mechanism for the glucose-stimulated initiation of cAMP oscillations in the absence of Ca2+ oscillations is activation of MOs. In fact, Fig. 2 makes a prediction that can be tested by measuring ATP and cAMP simultaneously.
Fig. 2 demonstrates the requirement for stimulatory glucose levels in the production of oscillatory cAMP. Fig. 3 demonstrates that Ca2+ levels also have an important effect, even though Ca2+ is not oscillating. Specifically, it shows that oscillations in cAMP that are terminated by hyperpolarization can often be rescued by elevated Ca2+. In this figure, glucose is at a stimulatory level throughout the simulation, prompting oscillations in glycolysis and subsequent Ca2+ and cAMP oscillations. Addition of Dz is then simulated, immediately terminating Ca2+ oscillations and terminating metabolic and cAMP oscillations. Finally, the cell is depolarized by simulated application of KCl. This raises Ca2+, but does not produce Ca2+ oscillations due to the presence of Dz. The increase in Ca2+ results in increased ATP utilization by Ca2+ pumps, lowering the mean ATP level and thereby disinhibiting PFK. In this example, the stimulation was sufficient to push PFK into a regime where oscillations occur, restarting the glycolytic oscillator, and thus restarting inhibitory AMP oscillations.
Figs. 2 and 3 together show that in our model, cAMP oscillations are possible without Ca2+ oscillations, provided that PFK is sufficiently active to support MOs. In Fig. 2, the needed stimulation was provided by raising glucose, whereas in Fig. 3, it was provided by raising Ca2+, which reduced ATP and disinhibited PFK.
The protocol of Fig. 3 was used successfully by Merrins et al. (25) to show that MOs in islets do not require Ca2+ oscillations. However, NAD(P)H was measured, not cAMP. The restarting of cAMP oscillations by depolarization with KCl is a new model prediction.
Phase relationships of Ca2+and cAMP
As noted above, Landa et al. (7) reported antiphase oscillations of cAMP and Ca2+, or, more precisely, that cAMP fell when Ca2+ rose. In contrast, Dyachok et al. (15) reported in-phase oscillations of cAMP and Ca2+. In both studies, the oscillations were fast (period ∼1 min), which we interpret to mean that the cAMP oscillations were driven by electrical oscillations (EOs) in Ca2+ rather than MOs. (Small, secondary oscillations of ATP are expected due to Ca2+-dependent consumption of ATP by pumps and Ca2+-dependent effects on the mitochondrial production of ATP, but these would not have much effect.) Fridlyand et al. (32), using a model in which oscillations are driven primarily by electrical mechanisms, varied the maximal rate of AC and PDE to show that antiphase oscillations are expected when the effects of Ca2+ on PDE are dominant and in-phase oscillations when the effects of Ca2+ on AC are dominant.
We show in Fig. 4 similar effects by varying the sensitivities of AC and PDE to Ca2+. For these simulations, glycolytic oscillations were suppressed by raising the activity of GK so that the substrate for PFK was never depleted sufficiently to bring down FBP, and hence glycolysis was elevated but steady. In Fig. 4 A, each pulse of Ca2+ leads to a reduction in ATP, due to utilization by Ca2+ pumps. Thus, AMP increases during each Ca2+ pulse. These oscillations in AMP are small, however, and the effects of Ca2+ on AC or PDE dominate. In Fig. 4 B, AC is nearly saturated at basal Ca2+ levels, but PDE is sensitive to the range of Ca2+, so cAMP is lowered by each Ca2+ pulse. (Out-of-phase oscillations of cAMP and Ca2+ can also be achieved by reducing the maximal rate of AC (not shown), as in Landa et al. (7).) In Fig. 4 C, both AC and PDE are sensitive to the range of Ca2+, and cAMP rises with each Ca2+ pulse.
In Fig. 5, we address the phase relationship between cAMP and Ca2+ during compound oscillations by varying the calcium sensitivity parameters in AC and PDE, exactly as was done for Fig. 4. In Fig. 5, glycolytic oscillations are present, so compound oscillations in electrical activity and Ca2+ are generated, consisting of periodic episodes of fast bursts. This results in compound AMP oscillations (Fig. 5 A). AMP tends to decline during the burst episode due to the increased metabolism that occurs during the upstroke of a glycolytic oscillation. Superimposed on this are rapid and large AMP increases due to the effects of increased Ca2+ concentration during the fast bursts, as in Fig. 4 A. In this example of compound bursting, the effects of glycolytic oscillations and those of Ca2+ are comparable, unlike the slow bursting shown in Fig. 1 (where glycolytic oscillations drive AMP oscillations) and the fast bursting shown in Fig. 4 (where Ca2+ oscillations drive AMP oscillations). This is because the amplitude of the MOs is much smaller during compound oscillations, at least with our parameters. For example, the amplitude of FBP is less than half of that in Fig. 1 (not shown). The cAMP level now responds to the compound AMP rhythm, as well as the Ca2+ pulses produced by the bursts. When PDE is the primary responder to Ca2+ fluctuations, the cAMP teeth will be downward during an episode of bursts (Fig. 5 B). The teeth are upward when AC is the primary responder to Ca2+ fluctuations (Fig. 5 C).
Thus, whereas glycolytic oscillations drive the slow component of the cAMP oscillations, the fast component is driven by Ca2+ acting on AC and PDE, and the cAMP time course can either be in phase (Fig. 5 C) or antiphase (Fig. 5 B) with the Ca2+ time course, depending on the affinities of AC and PDE to AMP and Ca2+. To date, compound cAMP oscillations have not been observed in islets, but neither, to our knowledge, have compound Ca2+ oscillations during dual Ca2+/cAMP measurements.
Sensitivity analysis
The most critical assumption in our model is that AC is inhibited by AMP and that AMP oscillates in a range to which AC is sufficiently sensitive. Data in the literature tend to support this (26–28) but are limited and not specific for β cells.
Therefore, in this section, we vary the affinity of AC for AMP and examine how sensitive the performance of the model is to that value. For the curves in Fig. 6, we consider AMP without taking Ca2+ into account, though the AMP amplitude is influenced by Ca2+. The relative contributions of Ca2+ and AMP to cAMP oscillations will be addressed in the Discussion. In our model, the inhibition of AC by AMP operates through the factor
| (4) |
in Eq. 1. In Fig. 6 A, we plot this factor for three different values of . As shown earlier, AMP oscillations produced by the DOM are smaller in amplitude during EOs than during MOs. In Fig. 6 A, we plot the extent of these oscillations as horizontal blue and magenta bars, respectively. The effect of AMP oscillations on AC over these ranges is shown on the vertical axis for both the EO and the MO. When μM (middle curve), the EO would produce a range of output of ∼0.23–0.24, or = 0.01 (right axis, blue triangles). The MO would produce output in the range ∼0.18–0.25, or (left axis, magenta triangles). The output range is smaller, however, when is decreased to 50 μM, since in this case, AC is largely inhibited at the AMP levels that would occur during either the EO or the MO. The output range is largest when is increased to 800 μM, with a range of during the MO and during the EO.
Figure 6.

The range of cAMP oscillations depends on AMP oscillations and AC sensitivity to AMP. (A) The portion of cAMP dynamics that depends on AMP (F in Eq. 4) is plotted versus AMP for three affinity values (thick black curves). The range of AMP values produced by an MO with the DOM is shown as the longer magenta bars. The range of AMP values produced by an EO is shown as the shorter blue bars. The change in F () during an MO is shown in magenta on the left axis, whereas the change that occurs during an EO is shown in blue on the right axis. (B) as a function of the AMP affinity parameter for either MOs or EOs.
It is apparent from Fig. 6 A that the effect of AMP oscillations on the AC output increases with . This is quantified in Fig. 6 B, where the output range, , of the AMP-dependent factor of AC is plotted against the parameter . This assumes the same range of variation of AMP for the EO and MO that was used in Fig. 6 A. For example, when M, the span of the output range is 0.01 for the EO and 0.07 for the MO, as indicated in Fig. 6 A. Presented in this way, it is evident that the influence of AMP oscillations on AC depends greatly on the AMP affinity of AC, but over a wide range of affinities the influence will be substantial. Thus, as long as the affinity of AC for AMP is near the range of AMP oscillation values, the latter oscillations are expected to produce nonnegligible oscillations in cAMP.
Discussion
It has long been known that cAMP is an important potentiator of glucose-stimulated insulin secretion, but only recently has it been possible to measure the dynamics of cAMP in β cells with high time resolution and learn that the cAMP concentration oscillates. However, the experimental record is equivocal as to the temporal relationship between Ca2+ and cAMP and the mechanism or mechanisms of the cAMP oscillations. A previous model (32) showed that cAMP could be out of phase with Ca2+ if the effects of Ca2+ on PDE were dominant and in phase with Ca2+ if the effects on AC were dominant. We have built on that base and shown that the same principle holds whether the variation in AC and PDE activity is the result of variation in the maximal rates or the affinities to Ca2+. Whereas the former is more likely to explain the observation of in-phase oscillations in GLP-1, the latter is a possibility in accounting for different cell lines or mouse strains.
The main motivation for this article, however, was observations of slow oscillations in cAMP in the presence of glucose without GLP-1 or glucagon. These oscillations have been reported to persist in conditions in which Ca2+ entry is inhibited or nonoscillatory (8,11,16). Although the database is limited, the data available indicate that these slow cAMP oscillations are in phase with Ca2+. Thus, the unifying theory that oscillations are in phase in the presence of GLP-1 and out of phase otherwise (7,32,46) does not extend to these more recent data.
We have proposed here an alternative explanation, that AC activity responds directly to glucose metabolism because AMP inhibits AC, and not only indirectly through the effects of metabolism on Ca2+ (Fig. 7). Although ATP influences AC as a substrate, AMP is present in much lower concentrations than ATP, which makes it a more sensitive metabolic signal. Relatively low concentration similarly means that ADP plays a bigger role than ATP in regulating K(ATP) channels during MOs, when glucose is high. The potency of AMP is further enhanced because it is produced by combining two ADP molecules, and hence its concentration is proportional at steady state to the square of ADP concentration (Eq. 7). It has been noted previously that this makes AMP an appropriate messenger for AMP-dependent kinase, which is a general integrator of the metabolic state of cells (47).
To reproduce the observations of cAMP oscillations in the absence of Ca2+ oscillations (Figs. 1, 2, and 3), it was necessary to employ a model in which MOs do not require Ca2+ oscillations, as is the case with the DOM (23). With AC and PDE added to this model, cAMP is in phase with Ca2+ during slow MOs. When MOs are suppressed, the effects of Ca2+ become manifest and generally concur with those in the model of Fridlyand et al. (32). Though AMP oscillations secondary to Ca2+ oscillations have some effect, this is smaller than the direct Ca2+ effect.
During slow oscillations, large-amplitude oscillations of both AMP and Ca2+ are generated. If the effect of AMP on cAMP is removed, large cAMP oscillations still occur, due entirely to Ca2+. These may be either in phase or out of phase with Ca2+, depending on the relative contributions of AC and PDE. The direct effect of AMP on AC in this case reduces the amplitude of cAMP oscillations by opposing the action of Ca2+, but it does not change the phase relationships. However, the AMP effect is needed to get cAMP oscillations without Ca2+ oscillations. Although the published experimental data match the model simulation in that cAMP and Ca2+ are in phase during slow oscillations, one could envision a case where with the right affinities the effect of Ca2+ on PDE dominates the effect of Ca2+ and AMP on AC, so that cAMP and Ca2+ would oscillate in antiphase during slow oscillations. This was demonstrated in model simulations for the case of compound oscillations in Fig. 5 B.
The model thus successfully accounts for the totality of observations to date, and it also makes predictions for further testing. The simulated experiment in Fig. 3 refines the protocol of Fig. 3 in (8) by allowing comparison of cAMP oscillations before termination with Dz and after rescue with KCl-induced depolarization; the model predicts that the amplitude would decrease, and that the rescued cAMP oscillations should be in phase with rescued ATP oscillations. In the study by Merrins and colleagues (25), NAD(P)H oscillations persisted in about one-third of islets exposed to Dz, and KCl restored NAD(P)H oscillations in around one-half of those where they had been terminated. A sufficiently large and representative sample size is therefore needed when testing this prediction. The osbservation of compound oscillations in cAMP would directly support the main claim of the model, that cAMP oscillations are controlled by distinct Ca2+ and metabolic mechanisms. Conversely, failure to observe compound cAMP oscillations in the presence of compound Ca2+ oscillations would argue against the model.
Finally, we suggest that cAMP oscillations in α cells, reported by Tian et al. (16), are also driven by MOs that do not require Ca2+ oscillations, as their period is slow, like the cAMP oscillations in β cells. The dependence of those oscillations on Ca2+ oscillations and the phase relationship between cAMP and Ca2+ have not been measured yet in α cells.
We have described multiple predictions that can be used to test the model, but its validity also depends critically on whether the oscillations in AMP are of sufficient magnitude and the affinity of AC for AMP is sufficiently low for the metabolic drive to be consequential. We have therefore undertaken the sensitivity analysis in Fig. 6 to explore this question. We found that the amplitude of the AMP-dependent component of the cAMP oscillations is optimal if AMP is comparable to the Km of AC, but it can still be significant even if the Km is below the optimum. To our knowledge, no measurements of AMP have been made in islets. However, measurements of dynamic changes in the ATP concentration in islets have been made using Perceval (48), and they show that the ATP level declines during the active phase of the burst when Ca2+ is high and rises during the silent phase when Ca2+ is low. From this, one would predict that AMP levels rise during the active phase and decline during the silent phase of the burst. Whether this is the case is yet to be determined.
Conclusions
In conclusion, the existence of slow oscillations in cAMP in β cells stimulated by glucose, as well as faster cAMP oscillations, is consistent with the DOM for β-cell activity. These data complement previous data supporting the model (24,25,33,49). In addition to accounting for a wide range of data, the model has implications for the organization of insulin secretion. Since insulin is secreted when Ca2+ is elevated, and since cAMP enhances exocytosis, in-phase oscillations of cAMP and Ca2+ in glucose-stimulated β cells may be optimal for evoking insulin secretion. The cAMP-elevating hormone GLP-1 would further enhance secretion without disturbing the phase relationship. We suggest that this beneficial arrangement arises from the coordination of Ca2+ and cAMP by MOs.
Author Contributions
All authors contributed to model development, simulations, and writing of the article.
Acknowledgments
A.S. was supported by the Intramural Research Program of the National Institutes of Health, National Institute of Diabetes and Digestive and Kidney Diseases. R.B. was supported by National Science Foundation grant DMS-0917664.
Editor: James Keener.
Footnotes
ODES computer codes are available at http://www.biophysj.org/biophysj/supplemental/S0006-3495(15)00607-4.
Appendix A: Modifications To The Dom
We use the model in Watts et al. (42) but make one modification beyond the addition of the cAMP equation. Whereas AMP was fixed for simplicity in some previous versions of the DOM, we allow AMP to vary here. Total adenosine, Atot, is taken to be 2500 μM and ATP is formed from mitochondria according to
| (A1) |
and ADP and AMP are conserved:
| (A2) |
| (A3) |
where
| (A4) |
and The nucleotide translocator form is defined as in Watts et al. (42), as are the parameters , ms−1, and μM/ms.
We also adjust maximal conductance for the KATP channel, which affects the voltage (V) equation,
with
| (A5) |
where is 1 when Dz is applied and 0 when it is not. As in previous versions of the DOM, variation in and is used to generate slow, fast, and compound oscillations; see figure legends for values. Code may be found in the Supporting Material or downloaded from http://www.math.fsu.edu/∼bertram/software/islet.
Supporting Material
References
- 1.Calejo A.I., Jorgacevski J., Zorec R. cAMP-mediated stabilization of fusion pores in cultured rat pituitary lactotrophs. J. Neurosci. 2013;33:8068–8078. doi: 10.1523/JNEUROSCI.5351-12.2013. [DOI] [PMC free article] [PubMed] [Google Scholar]
- 2.Dolenšek J., Skelin M., Rupnik M.S. Calcium dependencies of regulated exocytosis in different endocrine cells. Physiol. Res. 2011;60(Suppl 1):S29–S38. doi: 10.33549/physiolres.932176. [DOI] [PubMed] [Google Scholar]
- 3.Paco S., Margelí M.A., Aguado F. Regulation of exocytotic protein expression and Ca2+-dependent peptide secretion in astrocytes. J. Neurochem. 2009;110:143–156. doi: 10.1111/j.1471-4159.2009.06116.x. [DOI] [PubMed] [Google Scholar]
- 4.Braun M., Ramracheya R., Rorsman P. Exocytotic properties of human pancreatic β-cells. Ann. N. Y. Acad. Sci. 2009;1152:187–193. doi: 10.1111/j.1749-6632.2008.03992.x. [DOI] [PubMed] [Google Scholar]
- 5.Baggio L.L., Drucker D.J. Biology of incretins: GLP-1 and GIP. Gastroenterology. 2007;132:2131–2157. doi: 10.1053/j.gastro.2007.03.054. [DOI] [PubMed] [Google Scholar]
- 6.Ramos L.S., Zippin J.H., Levin L.R. Glucose and GLP-1 stimulate cAMP production via distinct adenylyl cyclases in INS-1E insulinoma cells. J. Gen. Physiol. 2008;132:329–338. doi: 10.1085/jgp.200810044. [DOI] [PMC free article] [PubMed] [Google Scholar]
- 7.Landa L.R., Jr., Harbeck M., Roe M.W. Interplay of Ca2+ and cAMP signaling in the insulin-secreting MIN6 β-cell line. J. Biol. Chem. 2005;280:31294–31302. doi: 10.1074/jbc.M505657200. [DOI] [PMC free article] [PubMed] [Google Scholar]
- 8.Dyachok O., Idevall-Hagren O., Tengholm A. Glucose-induced cyclic AMP oscillations regulate pulsatile insulin secretion. Cell Metab. 2008;8:26–37. doi: 10.1016/j.cmet.2008.06.003. [DOI] [PubMed] [Google Scholar]
- 9.Charles M.A., Fanska R., Grodsky G.M. Adenosine 3′,5′-monophosphate in pancreatic islets: glucose-induced insulin release. Science. 1973;179:569–571. doi: 10.1126/science.179.4073.569. [DOI] [PubMed] [Google Scholar]
- 10.Grill V., Cerasi E. Activation by glucose of adenyl cyclase in pancreatic islets of the rat. FEBS Lett. 1973;33:311–314. doi: 10.1016/0014-5793(73)80218-2. [DOI] [PubMed] [Google Scholar]
- 11.Kim J.W., Roberts C.D., Chaudhari N. Imaging cyclic AMP changes in pancreatic islets of transgenic reporter mice. PLoS One. 2008;3:e2127. doi: 10.1371/journal.pone.0002127. [DOI] [PMC free article] [PubMed] [Google Scholar]
- 12.Tian G., Sol E.R., Tengholm A. Impaired cAMP generation contributes to defective glucose-stimulated insulin secretion after long-term exposure to palmitate. Diabetes. 2015;64:904–915. doi: 10.2337/db14-1036. [DOI] [PubMed] [Google Scholar]
- 13.Seino S., Shibasaki T. PKA-dependent and PKA-independent pathways for cAMP-regulated exocytosis. Physiol. Rev. 2005;85:1303–1342. doi: 10.1152/physrev.00001.2005. [DOI] [PubMed] [Google Scholar]
- 14.Tengholm A. Cyclic AMP dynamics in the pancreatic β-cell. Ups. J. Med. Sci. 2012;117:355–369. doi: 10.3109/03009734.2012.724732. [DOI] [PMC free article] [PubMed] [Google Scholar]
- 15.Dyachok O., Isakov Y., Tengholm A. Oscillations of cyclic AMP in hormone-stimulated insulin-secreting β-cells. Nature. 2006;439:349–352. doi: 10.1038/nature04410. [DOI] [PubMed] [Google Scholar]
- 16.Tian G., Sandler S., Tengholm A. Glucose- and hormone-induced cAMP oscillations in α- and β-cells within intact pancreatic islets. Diabetes. 2011;60:1535–1543. doi: 10.2337/db10-1087. [DOI] [PMC free article] [PubMed] [Google Scholar]
- 17.Westerlund J., Gylfe E., Bergsten P. Pulsatile insulin release from pancreatic islets with nonoscillatory elevation of cytoplasmic Ca2+ J. Clin. Invest. 1997;100:2547–2551. doi: 10.1172/JCI119797. [DOI] [PMC free article] [PubMed] [Google Scholar]
- 18.Goforth P.B., Bertram R., Satin L.S. Calcium-activated K+ channels of mouse β-cells are controlled by both store and cytoplasmic Ca2+: experimental and theoretical studies. J. Gen. Physiol. 2002;120:307–322. doi: 10.1085/jgp.20028581. [DOI] [PMC free article] [PubMed] [Google Scholar]
- 19.Göpel S.O., Kanno T., Rorsman P. Activation of Ca2+-dependent K+ channels contributes to rhythmic firing of action potentials in mouse pancreatic β cells. J. Gen. Physiol. 1999;114:759–770. doi: 10.1085/jgp.114.6.759. [DOI] [PMC free article] [PubMed] [Google Scholar]
- 20.Düfer M., Gier B., Drews G. Enhanced glucose tolerance by SK4 channel inhibition in pancreatic β-cells. Diabetes. 2009;58:1835–1843. doi: 10.2337/db08-1324. [DOI] [PMC free article] [PubMed] [Google Scholar]
- 21.Detimary P., Gilon P., Henquin J.-C. Interplay between cytoplasmic Ca2+ and the ATP/ADP ratio: a feedback control mechanism in mouse pancreatic islets. Biochem. J. 1998;333:269–274. doi: 10.1042/bj3330269. [DOI] [PMC free article] [PubMed] [Google Scholar]
- 22.Tornheim K. Are metabolic oscillations responsible for normal oscillatory insulin secretion? Diabetes. 1997;46:1375–1380. doi: 10.2337/diab.46.9.1375. [DOI] [PubMed] [Google Scholar]
- 23.Bertram R., Sherman A., Satin L.S. Metabolic and electrical oscillations: partners in controlling pulsatile insulin secretion. Am. J. Physiol. Endocrinol. Metab. 2007;293:E890–E900. doi: 10.1152/ajpendo.00359.2007. [DOI] [PubMed] [Google Scholar]
- 24.Merrins M.J., Van Dyke A.R., Satin L.S. Direct measurements of oscillatory glycolysis in pancreatic islet β-cells using novel fluorescence resonance energy transfer (FRET) biosensors for pyruvate kinase M2 activity. J. Biol. Chem. 2013;288:33312–33322. doi: 10.1074/jbc.M113.508127. [DOI] [PMC free article] [PubMed] [Google Scholar]
- 25.Merrins M.J., Fendler B., Satin L.S. Metabolic oscillations in pancreatic islets depend on the intracellular Ca2+ level but not Ca2+ oscillations. Biophys. J. 2010;99:76–84. doi: 10.1016/j.bpj.2010.04.012. [DOI] [PMC free article] [PubMed] [Google Scholar]
- 26.Blume A.J., Foster C.J. Mouse neuroblastoma adenylate cyclase. Adenosine and adenosine analogues as potent effectors of adenylate cyclase activity. J. Biol. Chem. 1975;250:5003–5008. [PubMed] [Google Scholar]
- 27.Londos C., Preston M.S. Regulation by glucagon and divalent cations of inhibition of hepatic adenylate cyclase by adenosine. J. Biol. Chem. 1977;252:5951–5956. [PubMed] [Google Scholar]
- 28.Johnson R.A., Yeung S.M., Shoshani I. Cation and structural requirements for P site-mediated inhibition of adenylate cyclase. Mol. Pharmacol. 1989;35:681–688. [PubMed] [Google Scholar]
- 29.Cooper D.M.F., Mons N., Karpen J.W. Adenylyl cyclases and the interaction between calcium and cAMP signalling. Nature. 1995;374:421–424. doi: 10.1038/374421a0. [DOI] [PubMed] [Google Scholar]
- 30.Pyne N.J., Furman B.L. Cyclic nucleotide phosphodiesterases in pancreatic islets. Diabetologia. 2003;46:1179–1189. doi: 10.1007/s00125-003-1176-7. [DOI] [PubMed] [Google Scholar]
- 31.Han P., Werber J., Michaeli T. The calcium/calmodulin-dependent phosphodiesterase PDE1C down-regulates glucose-induced insulin secretion. J. Biol. Chem. 1999;274:22337–22344. doi: 10.1074/jbc.274.32.22337. [DOI] [PubMed] [Google Scholar]
- 32.Fridlyand L.E., Harbeck M.C., Philipson L.H. Regulation of cAMP dynamics by Ca2+ and G protein-coupled receptors in the pancreatic β-cell: a computational approach. Am. J. Physiol. Cell Physiol. 2007;293:C1924–C1933. doi: 10.1152/ajpcell.00555.2006. [DOI] [PubMed] [Google Scholar]
- 33.Bertram R., Satin L.S., Sherman A. Interaction of glycolysis and mitochondrial respiration in metabolic oscillations of pancreatic islets. Biophys. J. 2007;92:1544–1555. doi: 10.1529/biophysj.106.097154. [DOI] [PMC free article] [PubMed] [Google Scholar]
- 34.Beauvois M.C., Merezak C., Gilon P. Glucose-induced mixed [Ca2+]c oscillations in mouse β-cells are controlled by the membrane potential and the SERCA3 Ca2+-ATPase of the endoplasmic reticulum. Am. J. Physiol. Cell Physiol. 2006;290:C1503–C1511. doi: 10.1152/ajpcell.00400.2005. [DOI] [PubMed] [Google Scholar]
- 35.Valdeolmillos M., Santos R.M., Rosario L.M. Glucose-induced oscillations of intracellular Ca2+ concentration resembling bursting electrical activity in single mouse islets of Langerhans. FEBS Lett. 1989;259:19–23. doi: 10.1016/0014-5793(89)81484-x. [DOI] [PubMed] [Google Scholar]
- 36.Zhang M., Goforth P., Satin L. The Ca2+ dynamics of isolated mouse β-cells and islets: implications for mathematical models. Biophys. J. 2003;84:2852–2870. doi: 10.1016/S0006-3495(03)70014-9. [DOI] [PMC free article] [PubMed] [Google Scholar]
- 37.Yu X., Byrne J.H., Baxter D.A. Modeling interactions between electrical activity and second-messenger cascades in Aplysia neuron R15. J. Neurophysiol. 2004;91:2297–2311. doi: 10.1152/jn.00787.2003. [DOI] [PubMed] [Google Scholar]
- 38.Lindskog M., Kim M., Kotaleski J.H. Transient calcium and dopamine increase PKA activity and DARPP-32 phosphorylation. PLOS Comput. Biol. 2006;2:e119. doi: 10.1371/journal.pcbi.0020119. [DOI] [PMC free article] [PubMed] [Google Scholar]
- 39.Litvin T.N., Kamenetsky M., Levin L.R. Kinetic properties of “soluble” adenylyl cyclase. Synergism between calcium and bicarbonate. J. Biol. Chem. 2003;278:15922–15926. doi: 10.1074/jbc.M212475200. [DOI] [PubMed] [Google Scholar]
- 40.Davis B., Lazarus N.R. Insulin release from mouse islets. Effect of glucose and hormones on adenylate cyclase. Biochem. J. 1972;129:373–379. doi: 10.1042/bj1290373. [DOI] [PMC free article] [PubMed] [Google Scholar]
- 41.Ni Q., Ganesan A., Zhang J. Signaling diversity of PKA achieved via a Ca2+-cAMP-PKA oscillatory circuit. Nat. Chem. Biol. 2011;7:34–40. doi: 10.1038/nchembio.478. [DOI] [PMC free article] [PubMed] [Google Scholar]
- 42.Watts M., Fendler B., Sherman A. Calcium and metabolic oscillations in pancreatic islets: who’s driving the bus? SIAM J. Appl. Dyn. Syst. 2014;13:683–703. doi: 10.1137/130920198. [DOI] [PMC free article] [PubMed] [Google Scholar]
- 43.Ermentrout G. SIAM; Philadelphia, PA: 2002. Simulating, Analyzing, and Animating Dynamical Systems: A Guide to XPPAUT for Researchers and Students. [Google Scholar]
- 44.Zancan P., Almeida F.V., Sola-Penna M. Fructose-2,6-bisphosphate counteracts guanidinium chloride-, thermal-, and ATP-induced dissociation of skeletal muscle key glycolytic enzyme 6-phosphofructo-1-kinase: a structural mechanism for PFK allosteric regulation. Arch. Biochem. Biophys. 2007;467:275–282. doi: 10.1016/j.abb.2007.08.032. [DOI] [PubMed] [Google Scholar]
- 45.Marcondes M.C., Sola-Penna M., Zancan P. Clotrimazole potentiates the inhibitory effects of ATP on the key glycolytic enzyme 6-phosphofructo-1-kinase. Arch. Biochem. Biophys. 2010;497:62–67. doi: 10.1016/j.abb.2010.03.013. [DOI] [PubMed] [Google Scholar]
- 46.Holz G.G., Heart E., Leech C.A. Synchronizing Ca2+ and cAMP oscillations in pancreatic β-cells: a role for glucose metabolism and GLP-1 receptors? Focus on “Regulation of cAMP dynamics by Ca2+ and G protein-coupled receptors in the pancreatic β-cell: a computational approach. Am. J. Physiol. Cell Physiol. 2008;294:C4–C6. doi: 10.1152/ajpcell.00522.2007. [DOI] [PMC free article] [PubMed] [Google Scholar]
- 47.Kahn B.B., Alquier T., Hardie D.G. AMP-activated protein kinase: ancient energy gauge provides clues to modern understanding of metabolism. Cell Metab. 2005;1:15–25. doi: 10.1016/j.cmet.2004.12.003. [DOI] [PubMed] [Google Scholar]
- 48.Li J., Shuai H.Y., Tengholm A. Oscillations of sub-membrane ATP in glucose-stimulated β cells depend on negative feedback from Ca2+ Diabetologia. 2013;56:1577–1586. doi: 10.1007/s00125-013-2894-0. [DOI] [PMC free article] [PubMed] [Google Scholar]
- 49.Ren J., Sherman A., Satin L.S. Slow oscillations of KATP conductance in mouse pancreatic islets provide support for electrical bursting driven by metabolic oscillations. Am. J. Physiol. Endocrinol. Metab. 2013;305:E805–E817. doi: 10.1152/ajpendo.00046.2013. [DOI] [PMC free article] [PubMed] [Google Scholar]
Associated Data
This section collects any data citations, data availability statements, or supplementary materials included in this article.