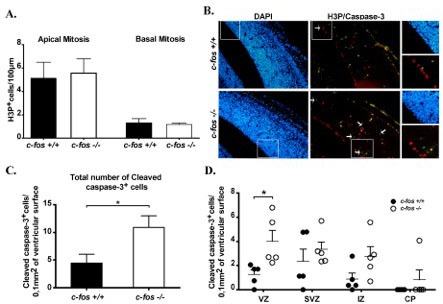
Figure 3. Mitosis and apoptosis in the neocortex.

A. Paraffin coronal sections of the neocortex were stained with the mitotic marker Phospho Histone H3 (H3P). H3P positive nuclei/100μm of length of the neocortex ventricular surface were quantified separately according to the mitosis they undergo as: apical mitosis (left panel) and basal mitosis (right panel). Results are the mean number of H3P positive nuclei/100μm ± SEM from 6 embryos of each genotype. No significant differences were observed between c-fos +/+ and c-fos −/− conditions. B. Photomicrographs for DAPI (blue), H3P (red) and cleaved caspase-3 (green) of brain coronal sections obtained from E14.5 c-fos +/+ and c-fos −/− embryos. Arrows indicate cells undergoing apoptosis (cleaved caspase-3 positive cells). Images were obtained with a fluorescence microscope (Olympus BX51) using a 40X objective. Magnification of boxed area is shown in the third column. C. Quantification of the total number of cleaved caspase-3 positive cells/0.1 mm2 of developing cerebral cortex surface for c-fos +/+ (black bar) and c-fos −/− (white bar) embryo. D. Quantification of the cleaved caspase-3 positive cells /0.1 mm2 of the cerebral cortex areas detailed below in c-fos +/+ (black circles) and c-fos −/− (white circles) mice: ventricular zone (VZ), sub-ventricular zone (SVZ), intermediate zone (IZ) and cortical plate (CP). Results are the mean number of the cleaved caspase-3 positive cells /0.1 mm2 cerebral cortex ± SEM from 4 embryos of each genotype. *p < 0.05 in c-fos −/− embryos with respect to the c-fos +/+ condition using unpaired t test with Welch's correction (mitosis analysis) and two way ANOVA with Bonferroni post-test (apoptosis analysis).
