

Abstract
Background and Purpose
An influx drug/proton antiporter of unknown structure has been functionally demonstrated at the blood–brain barrier. This transporter, which handles some psychoactive drugs like diphenhydramine, clonidine, oxycodone, nicotine and cocaine, could represent a new pharmacological target in drug addiction therapy. However, at present there are no known drugs/inhibitors that effectively inhibit/modulate this transporter in vivo.
Experimental Approach
The FLAPpharm approach was used to establish a pharmacophore model for inhibitors of this transporter. The inhibitory potency of 44 selected compounds was determined against the specific substrate, [3H]‐clonidine, in the human cerebral endothelial cell line hCMEC/D3 and ranked as good, medium, weak or non‐inhibitor.
Key Results
The pharmacophore model obtained was used as a template to screen xenobiotic and endogenous compounds from databases [Specs, Recon2, Human Metabolome Database (HMDB), human intestinal transporter database], and hypothetical candidates were tested in vitro to determine their inhibitory capacity with [3H]‐clonidine. According to the transporter database, 80% of the proton antiporter inhibitor candidates could inhibit P‐glycoprotein/MDR1/ABCB1 and specificity is improved by reducing inhibitor size/shape and increasing water solubility. Virtual screening results using HMDB and Recon2 for endogenous compounds appropriately scored tryptamine as an inhibitor.
Conclusions and Implications
The pharmacophore model for the proton‐antiporter inhibitors was a good predictor of known inhibitors and allowed us to identify new good inhibitors. This model marks a new step towards the discovery of this drug/proton antiporter and will be of great use for the discovery and design of potent inhibitors that could potentially help to assess and validate its pharmacological role in drug addiction in vivo.
Abbreviations
- ADE
absorption, distribution and elimination
- BBB
blood–brain barrier
- DPBS
Dulbecco's PBS
- DPH
diphenhydramine
- G‐I
good inhibitor
- Glob‐Prod flap
global product similarity score
- Glob‐Sum flap
global sum similarity score
- KH
Krebs–HEPES buffer
- M‐I
medium inhibitor
- N‐I
non‐inhibitor
- PCA
principal component analysis
- P‐gp
P‐glycoprotein
- PK
pharmacokinetics
- W‐I
weak inhibitor
Tables of Links
| TARGETS |
|---|
| ABC transporters |
| SLC transporters |
| LIGANDS | |||
|---|---|---|---|
| 5‐HT | Clonidine | Methadone | Quinine |
| Amitriptyline | Cocaine | Naloxone | TEA |
| Buprenorphine | Diphenhydramine | Nicotine | Tryptamine |
| Carnitine | Imipramine | Nortriptyline | Tryptophan |
| Oxycodone | |||
These Tables list key protein targets and ligands in this article which are hyperlinked to corresponding entries in http://www.guidetopharmacology.org, the common portal for data from the IUPHAR/BPS Guide to PHARMACOLOGY (Pawson et al., 2014) and are permanently archived in the Concise Guide to PHARMACOLOGY 2013/14 (Alexander et al., 2013).
Introduction
Drug transporters govern absorption, distribution and elimination (ADE), the key steps of drug disposition in the body that control therapeutic efficacy and adverse reactions. ABC and more recently SLC transporters have been found to play a key role in tissues involved in oral absorption and body elimination (Giacomini et al., 2010). Drug distribution into the brain parenchyma has been shown to be dependent on the histological and biochemical properties of the endothelial cells of the cerebral capillaries that constitute the blood–brain barrier (BBB) (Abbott et al., 2010). Efforts have been made to predict BBB permeability using physicochemical descriptors based on the assumption that drugs only cross membranes by passive diffusion (Seelig et al., 1994; Crivori et al., 2000). However, some hydrophilic compounds exhibiting CNS activity (e.g. clonidine) were considered to be exceptions to this general understanding (Seelig et al., 1994).
Studies of a few psychoactive drugs have shown a saturable uptake kinetic at the BBB that challenges the picture of the unique role of passive diffusion. Diphenhydramine (DPH) was the first drug found to involve an uptake transport mechanism at the BBB during in situ rat brain perfusion (Goldberg et al., 1987), but the functional characterization and identity of this transporter was not established. Brain microdialysis studies suggested that this DPH influx is present in rat, dog and non‐human primate BBB (Sadiq et al., 2011; Shaffer et al., 2014). In vitro studies of rodent and human immortalized brain endothelium and intestinal cell lines established the presence of a cationic drug/proton antiporter with unique properties that did not correspond to any known SLC transporters: OCT1‐3 (SLC22A1‐3), OCTN (SLC22A4‐5) and MATE1 (SLC47A1) (Fischer et al., 2006; Kuwayama et al., 2008; Okura et al., 2008; Chapy et al., 2014). In vivo/in situ studies definitively confirmed that a functional novel drug/proton antiporter, molecularly unknown, is physiologically active at the mouse BBB and blood–retina barrier (André et al., 2009; Chapy et al., 2015). This proton antiporter improves the in vivo understanding of drug disposition into the brain and the retina, and possibly at the intestinal barrier, as suggested by the in vitro Caco‐2 cells experiments. Clonidine has been characterized as a specific proton‐antiporter substrate at the mice BBB (André et al., 2009) and in various cell lines, including Caco‐2 cells (Fischer et al., 2006). This polyspecific transporter mediates the transport of at least nicotine and cocaine (André et al., 2009; Cisternino et al., 2013; Chapy et al., 2014), and ecstasy (MDMA) and heroin have also been suggested to be substrates (Chapy et al., 2014, 2015).
The handling of these drugs by a common transporter uncovers a new potential pharmacological target in addiction therapy. Neurobehavioral and molecular studies have demonstrated the positive correlation between the rate/speed of drugs of abuse (e.g. nicotine and cocaine) delivery to the brain and their reinforcing addictive properties (Samaha et al., 2004; Samaha and Robinson, 2005; Volkow et al., 2012). Indeed, the subjective ‘high’ is linked to the entry rate into the brain rather than the overall presence or extent of drug distribution into the brain (Volkow et al., 2000). Slowing the brain delivery rate of a drug of abuse represents a pharmacokinetic (PK) strategy, which is beneficial in drug addiction therapy (Gorelick, 2012). This strategy could possibly help abstinence or relapse by a long‐term treatment. The development of potent and selective inhibitors of the proton antiporter could reduce its transport activity and drop/lower the rate of substrates influx into the brain. Some CNS compounds, like imipramine, have been shown to be potent inhibitors of this transporter in vitro and/or in situ (Chapy et al., 2014). However, the high concentrations of these drugs needed to significantly inhibit this antiporter precludes any wanted or unwanted drug‐drug interactions induced by their systemic administration in vivo.
Using the human model of brain endothelial cell line hCMEC/D3 (Dauchy et al., 2009), the specificity of this proton antiporter for [3H]‐clonidine, [3H]‐cocaine and [3H]‐naloxone was studied, and/or the inhibitory potency of selected compounds was determined. The FLAPpharm approach was chosen to establish pharmacophore features according to the functional properties of a drug (Cross et al., 2012). Indeed, pharmacophore elucidations have already proved to be a valid strategy to explore chemical features of substrates or inhibitors for a number of transporters, such as P‐glycoprotein (P‐gp, ABCB1), MATE1 and OCT2 (Ekins et al., 2002; Penzotti et al., 2002; Astorga et al., 2012; Xu et al., 2013). In this study, the pharmacophore model was used as a template in a virtual screening search for new proton‐antiporter inhibitors, and a number of hypothetical hit compounds were acquired. After their inhibitory potency had been determined by their ability to affect [3H]‐clonidine transport in hCMEC/D3 cells, the hit compounds showed good inhibitory potency, consequently validating the first pharmacophoric model of this novel drug/proton antiporter.
Methods
Cell culture
hCMEC/D3 cells were cultured (25 000 cells·cm−2) on T‐flask coated with type I collagen, in EBM‐2 medium (Lonza, Basel, Switzerland) supplemented as described previously (Dauchy et al., 2009). For experiments, cells seeded in multiwell dishes (25 000 cells·cm−2) were used 3–4 days after seeding and between passages 28 and 35.
In vitro transport experiment
hCMEC/D3 cells in multiwell dishes were first preincubated 30 min with Krebs–HEPES (KH) incubation buffer (in mmol·L−1: 128 NaCl, 24 NaHCO3, 4.2 KCl, 2.4 NaH2PO4, 1.5 CaCl2, 0.9 MgSO4, 10 HEPES and 9 d‐glucose). Experiments were performed as described by Chapy et al. (2014). Cells were incubated with KH incubation buffer containing (3.7 kBq·mL−1, ~3 nmol·L−1; 37°C) [3H]‐clonidine, [3H]‐naloxone or [3H]‐cocaine, in the presence or absence of a selected unlabelled compound. In trans‐stimulation studies, cells were pre‐incubated for 30 min with KH and loaded 5 min with KH containing [3H]‐clonidine before incubation with a KH buffer with or without (control) unlabelled compound (DPH, oxycodone, TEA or carnitine). After 5 min of incubation, cells were placed on ice, and ice‐cold Dulbecco's PBS (DPBS) was added to stop the experiments. Cells were then rapidly washed twice (ice‐cold DPBS) and lysed (SDS 10%; 30 min; 37°C). Cell lysate was kept to quantify proteins (micro‐BCA protein assay kit, Pierce, Sigma). Lysates were mixed with Ultima gold XR (Perkin Elmer) and 3H was counted in a Tri‐Carb counter (Perkin Elmer).
Transport parameters and IC50 determinations
The compound cellular uptake velocity (nmol·min−1·mg−1) is composed of a saturable (Michaelis–Menten term) and a passive unsaturable component:
| (1) |
where C tot (mmol·L−1) is the total compound concentration in the incubation buffer, V max (nmol·min−1·mg−1) the maximal velocity of transport and K m (mmol·L−1) the concentration at the half‐maximal carrier velocity. K passive (μL·min−1·mg−1) is an unsaturable component depicting the rate of passive diffusion. The data were fitted using nonlinear regression analysis (WinNonlin® software; Pharsight, Certera, Princeton, NJ, USA).
The observed quantity of intracellular substrate with concentrations of the various inhibitors was fitted to the following equation:
| (2) |
where C i is the inhibitor concentration (µmol·L−1), Y 0 the quantity of intracellular 3H substrate without inhibitor (C i = 0), Y max the quantity of intracellular 3H substrate at the maximum inhibition (C i = ∞), IC50 (µmol·L−1) the inhibitor concentration at which the inhibitory effect is at 50% (or when the intracellular quantity of substrate is equal to ((Y 0 + Y max))/2) and γ the Hill coefficient. This coefficient was estimated and found to be ~1 (0.6–1.4).
Data transport analysis
Data are presented as means ± SD. ANOVA and a post hoc test (Dunnett) were used to identify significant differences, unless specified otherwise. Statistical significance was set at P < 0.05. The transport parameters (K m, V max, K passive) were estimated by plotting the drug flux data against total concentration using Eq. 1 and nonlinear regression with WinNonlin®. The errors associated with these parameters are asymptotic standard errors returned by the nonlinear regression routine. IC50 values were estimated using Eq. 2 with WinNonlin®.
Pharmacophore generation
A principal component analysis (PCA) model of compounds in Table 1 was generated using volsurf+ (www.moldiscovery.com) (Cruciani et al., 2000). The 128 volsurf+ descriptors were used as variables. Chemical structures were imported at their more abundant protomeric state at pH 7.4. The second principal component was able to discriminate among good descriptors, and thus, it was used for compound selection.
Table 1.
Inhibitory potency of selected organic compounds on clonidine transport in hCMEC/D3 cells
| Compound | IC50 (µmol·L−1) | Compound | IC50 (µmol·L−1) |
|---|---|---|---|
| Nortriptyline | 0.80 ± 0.21 | Clonidine | 49.1 ± 3.9 |
| Desipramine | 1.82 ± 0.43 | Codeine | 63.5 ± 5.2 |
| Imipramine* | 1.86 ± 0.35 | Oxymorphone | 78.1 ± 5.9 |
| Amitriptyline | 2.39 ± 0.20 | Hydromorphone | 93.2 ± 19.5 |
| Quinine | 5.24 ± 0.37 | Naloxone | 95.5 ± 45.7 |
| Methadone | 9.44 ± 2.3 | Nicotine | 225 ± 52 |
| Verapamil* | 9.95 ± 1.6 | Morphine | 475 ± 296 |
| MDMA | 12.3 ± 3.1 | Dihydromorphine | 1587 ± 619 |
| Buprenorphine* | 14.6 ± 2.4 | Cotinine | N‐I |
| Desomorphine | 15.0 ± 1.0 | Ecgonine | N‐I |
| Norbuprenorphine* | 16.2 ± 2.2 | Tetraethylammonium | N‐I |
| Diphenhydramine | 19.2 ± 2.8 | Benzoylecgonine | N‐I |
| Cocaethylene | 20.5 ± 2.6 | Choline | N‐I |
| Norcocaine | 23.7 ± 3.4 | l‐Carnitine | N‐I |
| 6‐Acetylcodeine | 29.0 ± 5.1 | Guanidine | N‐I |
| Hydrocodone | 32.6 ± 7.4 | MPP | N‐I |
| Cocaine | 34.6 ± 4.2 | Histamine | N‐I |
| 6‐MAM | 35.3 ± 2.7 | Serotonin | N‐I |
| Tramadol | 36.4 ± 3.8 | Dopamine | N‐I |
| Nalbuphine | 37.8 ± 3.7 | Agmatine | N‐I |
| Heroine | 43.9 ± 5.1 | l‐Dopa | N‐I |
| Oxycodone | 46.8 ± 8.4 | Cimetidine | N‐I |
Determination of IC50 for selected compounds on [3H]‐clonidine uptake in hCMEC/D3 cells. The [3H]‐clonidine uptake was measured for 5 min in hCMEC/D3 cells and plotted against the inhibitor at seven selected concentrations (0.1, 1, 10, 50, 100, 1000 and 2000 µmol·L−1 depending on the compound solubility) in Krebs–HEPES incubation medium (pHe 7.40; 37°C). Experimental results were fitted according to Eq. 2. Compounds were classified depending on their IC50: good inhibitor (G‐I) ≤ 20 µmol·L−1, medium inhibitor (M‐I) < 45 µmol·L−1, weak inhibitor < 2000 µmol·L−1 and non‐inhibitor (N‐I) no effect from 0.1 to 2000 µmol·L−1.
6‐MAM, 6‐monoacetylmorphine; MDMA, 3,4‐methylene‐dioxy‐methamphetamine; MPP, 1‐methyl‐4‐phenylpyridinium.
Compounds were tested at lower concentration due to lack of solubility: <500 µmol·L−1 for buprenorphine and <1 mmol · L−1 for norbuprenorphine, imipramine and verapamil.
FLAPpharm (www.moldiscovery.com) (Cross et al., 2012) was used to generate the pharmacophores automatically. Compounds were aligned in their most abundant protonation states as predicted by moka 2.5 (www.moldiscovery.com) (Milletti et al., 2010). Thirty conformers for each structure were generated to perform the alignment. No constraints were applied in pharmacophore generation.
Virtual screening
Virtual screenings were performed using the flap 2.0 software (Molecular Discovery Ltd, London, UK) (Baroni et al., 2007). To validate the pharmacophore models, a flap database was generated from the available dataset of 44 compounds (Table 2). A number of conformers (50) was generated for each compound, and each protonation state with an abundance over 20% was added to the database. Virtual screenings were performed using the pharmacophore as a template (medium accuracy, ‘fields’ mode).
Table 2.
Dataset used for pharmacophore validation and virtual screening based on the flap global similarity score (Glob‐Prod) descriptor
| Candidate | Typea | Similarity score | Candidate | Typea | Similarity score | ||
|---|---|---|---|---|---|---|---|
| 1 | Imipramine | G‐I | 0.36 | 23 | MDMA | G‐I | 0.23 |
| 2 | Methadone | G‐I | 0.34 | 24 | Hydromorphone | W‐I | 0.23 |
| 3 | Diphenhydramine | G‐I | 0.30 | 25 | Norcocaine | M‐I | 0.23 |
| 4 | Desipramine | G‐I | 0.30 | 26 | Clonidine | W‐I | 0.22 |
| 5 | Heroin | M‐I | 0.28 | 27 | Desomorphine | G‐I | 0.22 |
| 6 | Amitriptyline | G‐I | 0.28 | 28 | Cimetidine | N‐I | 0.22 |
| 7 | Cocaethylene | G‐I | 0.27 | 29 | Nicotine | W‐I | 0.21 |
| 8 | Hydrocodone | M‐I | 0.28 | 30 | Dihydromorphine | W‐I | 0.21 |
| 9 | 6‐Acetylcodeine | M‐I | 0.27 | 31 | Oxymorphone | W‐I | 0.21 |
| 10 | Cocaine | M‐I | 0.27 | 32 | Morphine | W‐I | 0.20 |
| 11 | Quinine | G‐I | 0.26 | 33 | l‐Dopa | N‐I | 0.19 |
| 12 | Verapamil | G‐I | 0.26 | 34 | Ecgonine | N‐I | 0.19 |
| 13 | Buprenorphine | G‐I | 0.25 | 35 | Agmatine | N‐I | 0.18 |
| 14 | Nalbuphine | M‐I | 0.25 | 36 | Serotonin | N‐I | 0.17 |
| 15 | 6‐MAM | M‐I | 0.24 | 37 | Dopamine | N‐I | 0.17 |
| 16 | Tramadol | M‐I | 0.24 | 38 | l‐Carnitine | N‐I | 0.16 |
| 17 | Benzoylecgonine | N‐I | 0.24 | 39 | Cotinine | N‐I | 0.15 |
| 18 | Norbuprenorphine | G‐I | 0.24 | 40 | MPP | N‐I | 0.15 |
| 19 | Naloxone | W‐I | 0.24 | 41 | Histamine | N‐I | 0.14 |
| 20 | Oxycodone | W‐I | 0.24 | 42 | Guanidine | N‐I | 0.0 |
| 21 | Codeine | W‐I | 0.23 | 43 | Tetraethylammonium | N‐I | 0.0 |
| 22 | Nortriptyline | G‐I | 0.23 | 44 | Choline | N‐I | 0.0 |
6‐MAM, 6‐monoacetylmorphine; MDMA, 3,4‐methylene‐dioxy‐methamphetamine; MPP, 1‐methyl‐4‐phenylpyridinium.
G‐I (good inhibitor), M‐I (medium inhibitor), W‐I (weak inhibitor) and N‐I (non‐inhibitor) classification comes from in vitro studies in hCMEC/D3 cells.
For Specs database virtual screening, the pharmacophore model based on imipramine, methadone and buprenorphine was used as a template. A prefiltering screening in flap bit‐string mode (Baroni et al., 2007) was initially performed. A MW filter was applied, processing only compounds with a MW in the range 150–500. Based on the consideration that the known inhibitors all contained a positively charged donor atom (protonated amine) at physiological pH, a ‘donor‐charged’ constraint was applied, using all the protomers with an abundance greater than 20% (moka) for each structure of the Specs database (Specs‐SC_20mg_total_Nov2013.sdf from the vendor). At the end of the prefiltering run, compounds were ranked by global sum (Glob‐Sum) similarity score, which is produced by summing all of the individual scores together. Thus, the 200 top‐ranked compounds were used to generate a flap database with the following setting: protomers abundance (pH 7.4) = 20; conformers = 50 (other setting by default). Then as for the pharmacophore validation procedures, a new virtual screening was performed using the pharmacophore as a template (medium accuracy, ‘fields’ mode). Compounds were ranked by their Glob‐Prod molecular similarity score, which is produced by multiplying all the scores of the individual probes together. The Glob‐Prod score, which is not available in the bit‐string mode, was preferred over the Glob‐Sum score in the second screening, being the most performant score in the validation of the pharmacophore model (see Results). Thus, compounds with a Glob‐Prod >0.25 were selected for a total of 93 compounds. Among them, 10 were selected based on their chemical diversity.
Projection of good proton‐antiporter inhibitors in the P‐gp‐inhibition PLS‐DA model
A partial least squares discriminant analysis (PLS‐DA) model for P‐gp inhibition was generated, based on a published database for P‐gp inhibition (Broccatelli et al., 2011), using volsurf+. The 128 volsurf+ descriptors were used as variables. Chemical structures were imported at their more abundant protomeric state (pH 7.4). Compounds out of the 99% confidence of the model were discarded, and a new model was generated. The discarded compounds were mainly non‐inhibitor (N‐I) antibiotics. The method was validated using the leave‐one‐out method. The 25 good inhibitors (G‐I) (Table 2, 3, 4) were projected in the model (at their most abundant protomeric state, pH 7.4), and their predicted activities were evaluated.
Table 3.
List of 10 inhibitor candidates for the proton antiporter, based on the virtual screening results in Specs database, and IC50 measured using [3H]‐clonidine on hCMEC/D3 cells
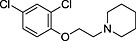
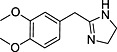
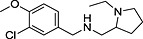
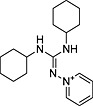
| ID | Specs code | Structure | Similarity scorea | IC50 a (µmol·L−1) |
|---|---|---|---|---|
| 1 | AG‐690/11629084 |
|
0.34 | 4.2 ± 0.9 |
| 2 | AO‐365/42320587 |
|
0.31 | 7.0 ± 1.6 |
| 3 | AI‐204/31729011 |
|
0.30 | 5.9 ± 1.2 |
| 4 | AO‐365/42033227 |
|
0.28 | 7.2 ± 1.9 |
| 5 | AJ‐292/13998281 |
|
0.27 | 2.6 ± 0.4 |
| 6 | AJ‐292/41721907 |
|
0.29 | 2.0 ± 0.3 |
| 7 | AE‐848/36959133 |
|
0.25 | N‐I |
| 8 | AE‐641/00604022 |
|
0.25 | 500b |
| 9 | AN‐465/43421955 |
|
0.25 | 1.1 ± 0.2 |
| 10 | AQ‐405/42300085 |
|
0.25 | N‐I |

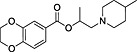
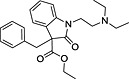
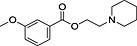
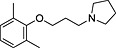

Similarity score generated by the flap 2.0 software.
Determination of IC50 for selected compounds on [3H]‐clonidine uptake in hCMEC/D3. Uptake was measured for 5 min in hCMEC/D3 cells and plotted against the inhibitor at seven selected concentrations (0.01, 0.1, 1, 10, 100, 500 and 1000 µmol·L−1) in Krebs–HEPES incubation medium (pHe 7.40; 37°C). Experimental results were fitted according to Eq. 2. N‐Is had no effect on clonidine transport from 0.01 µmol·L−1 to 1 mmol·L−1.
Selected concentration for inhibition screening meant IC50 value according to Eq. 2 could not be determined.
Table 4.
Inhibitory potency of selected organic compounds from the drug and endogenous databases, on [3H]‐clonidine transport in hCMEC/D3 cells
| Name | Database | Structure | Predicted inhibition effect | IC50 (µmol·L−1) |
|---|---|---|---|---|
| Chlorpromazine | (a) |
|
I | 0.50 ± 0.06 |
| Clomipramine | (a) |
|
I | 2.09 ± 0.22 |
| Doxepin | (a) |
|
I | 3.96 ± 0.37 |
| Pheniramine | (a) |
|
I | 4.62 ± 1.28 |
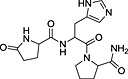
| TRH | (b) |
|
I | N‐I |
| Tryptamine | – |
|
I | 2.63 ± 0.65 |
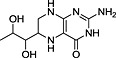
| 5,6,7,8‐Tetrahydro‐l‐biopterine | (b) |
|
N‐I | N‐I |
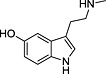
| N‐Methylserotonin | (b) |
|
N‐I | N‐I |
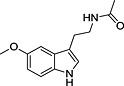
| Melatonin | (b) |
|
N‐I | N‐I |


TRH, thyrotropin‐releasing hormone; N‐I, non‐inhibitor; I, inhibitor.
Determination of IC50 for selected compounds on [3H]‐clonidine uptake in hCMEC/D3. Uptake was measured for 5 min in hCMEC/D3 cells and plotted against the inhibitor at seven selected concentration (0.01, 0.1, 1, 10, 100, 500 and 1000 µmol·L−1) in Krebs–HEPES incubation medium (pHe 7.40; 37°C). Experimental results were fitted according to Eq. 2. No inhibition effect was observed from 0.01 µmol·L−1 to 1 mmol·L−1. (a) Tropsha's human intestinal transporter database (b) Recon2 database.
Drugs and chemicals
[3H]‐clonidine (2.27 MBq·mmol−1), [3H]‐naloxone (2.06 MBq·mmol−1) and [3H]‐(−)cocaine (1.31 MBq·mmol−1) were purchased from Perkin Elmer (Courtaboeuf, France). Drugs were obtained as reported (Chapy et al., 2014). Compounds 1 to 10 were purchased from Specs (Delft, the Netherlands), and other chemicals were from Sigma (Saint Quentin‐Fallavier, France).
Results
Characterization of the clonidine and naloxone transport in hCMEC/D3 cells
The specificity of the substrate probes for this molecularly unknown proton antiporter has been first established in the hCMEC/D3 cell line. The functional characterization for clonidine and naloxone was explored using concentration‐dependence, proton‐dependence and inhibition profile with inhibitors known to interact with distinct transporters (e.g. OCT, OCTN and MATE). Clonidine transport was concentration‐dependent and consists of passive (K passive 4.3 ± 0.3 μL·min−1·mg−1) and carrier‐mediated influx (K m 0.15 ± 0.02 mmol·L−1, Vmax 11.9 ± 0.8 nmol·min−1·mg−1) counting for 94.7% of total clonidine transport (Figure 1A). Clonidine transport was trans‐stimulated by proton and other known substrates of the proton antiporter such as oxycodone and DPH (Figure 1B–C). Inhibition profile studies have shown that known OCT inhibitors (e.g. TEA, carnitine and choline) have no effect on [3H]‐clonidine transport but others inhibited [3H]‐clonidine uptake with various potencies (Table 1).
Figure 1.
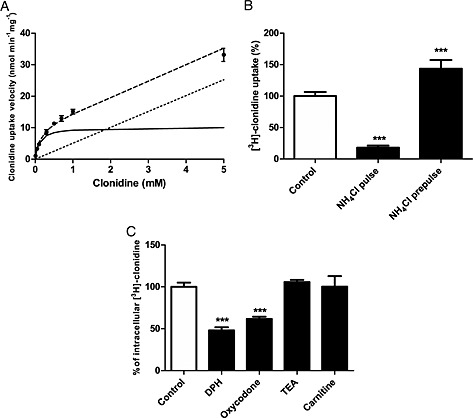
(A) Passive and carrier‐mediated flux of clonidine in hCMEC/D3 cells. Total uptake (nmol·min−1·mg−1) represented by dashed line was measured in hCMEC/D3 cells and plotted against total clonidine concentration in KH incubation buffer at extracellular pH (pHe) 7.40. The straight dotted line represents the passive transport of clonidine (K passive 4.3 ± 0.3 μL·min−1·mg−1at pH 7.40). The solid line represents the graph obtained by subtracting the passive flux from the total flux and fitting this to the carrier‐mediated Michaelis–Menten term (Eq. 1) by nonlinear least‐square regression. Estimated parameters for clonidine transport in hCMEC/D3 cells are as follows: K m, 0.154 ± 0.025 mmol·L−1 and V max, 11.9 ± 0.8 nmol·min−1·mg−1. Data represent means ± SD of experiments performed in triplicate. (B) Effect of modulation of intracellular pH (pHi) on [3H]‐clonidine transport in hCMEC/D3 cells with NH4Cl. In pulse condition (cellular alkalinization): after 30 min of the usual preincubation, a solution (pHe 7.40) containing NH4Cl (30 mmol·L−1) and [3H]‐clonidine was added for 5 min. The NH4Cl prepulse condition (cellular acidification) was obtained by pre‐incubating cells with the incubation buffer (pHe 7.40) plus NH4Cl (30 mmol·L−1) for 15 min. The incubation medium was then replaced by the usual KH buffer without NH4Cl for 5 min. [3H]‐clonidine uptake was measured in the usual KH incubation buffer for 5 min (n = 4). ***: P < 0.001 compared with controls. (C) Trans‐stimulation studies of [3H]‐clonidine transport in hCMEC/D3 cells. hCMEC/D3 cells were loaded with [3H]‐clonidine for 5 min and then incubated with KH buffer alone (control) or with 10 µmol·L−1 of unlabelled compound (TEA, carnitine, diphenhydramine or oxycodone) in KH buffer. Data represent means ± SD performed in quadruplicate. ***: P < 0.001 compared with control.
[3H]‐naloxone uptake in hCMEC/D3 cells is mediated by passive diffusion (K passive 3.4 ± 0.3 μL·min−1·mg−1), and carrier‐mediated influx (K m 0.19 ± 0.05 mmol·L−1; V max 2.9 ± 0.5 nmol·min−1·mg−1, 81.8%) (Figure S1). Proton‐dependence and inhibition profile suggest that this proton antiporter is unrelated to OCT/OCTN or MATE transporters (Table S1). Functional characterization of a specific cocaine transport by this proton antiporter was reported (Chapy et al., 2014). Clonidine was chosen to determine and rank the inhibition potencies of a wide range of selected organic compounds.
IC50 determination of selected compounds for [3H]‐clonidine, [3H]‐naloxone or [3H]‐cocaine uptake in hCMEC/D3 cells
The concentration‐dependence of selected compounds against [3H]‐clonidine uptake in hCMEC/D3 cells was determined. IC50 was estimated (Eq. 2) and used to arbitrarily classify inhibitors into four categories (clonidine, Table 1; cocaine and naloxone, Table S2): G‐I (IC50 < 20 µmol·L−1), medium inhibitor (M‐I) (IC50 < 45 µmol·L−1), weak inhibitor (W‐I) (IC50 < 2000 µmol·L−1) and N‐I (IC50 > 2000 µmol·L−1). All the N‐I compounds for clonidine (Table 1) also had no effect on [3H]‐naloxone and [3H]‐cocaine hCMEC/D3 cell uptake, and selected G‐I are also G‐I against them (Tables S1–S2).
Generation and validation of a pharmacophore model for inhibitors of the proton‐antiporter
A pharmacophore model for compounds inhibiting the proton‐antiporter protein was generated using the FLAPpharm algorithm (Cross et al., 2012). FLAPpharm initially searches for the best superimposition of active ligands using the GRID MIFs of each ligand to drive the alignment. Following this, the resulting alignment model is used to derive the common pharmacophore. The FLAPpharm pharmacophore can be described as a ‘pseudomolecule’, which is composed of common pharmacophoric interaction fields (PIFs), common atom‐centred pseudopharmacophoric fields (pseudoPIFs) and common pharmacophoric points at the centroid of these pseudoPIFs, and can be used as a template for virtual screening in the FLAP software (Sirci et al., 2012; Goracci et al., 2014).
FLAPpharm requires at least three active molecules for pharmacophore generation. The structural three‐dimensional difference among the aligned compounds rather than their number is important in generating an optimal FLAP pharmacophore. In order to select three representative compounds, a PCA model was generated on compounds reported in Table 1 described with holistic descriptors obtained from volsurf+ (Cruciani et al., 2000). Based on the PCA results (Figure 2), the first principal component (PC1) distinguishes inhibitors and N‐I. Among the volsurf+ descriptors, G‐Is show greater LogP and %FU10 values than N‐Is, where the %FU10 descriptor represents the fraction of unionized compound at pH 10. Thus, lipophilicity and basicity are critical parameters for discrimination. volsurf+ descriptors for intestinal and BBB permeability (CACO2 and LgBB, respectively) also showed high values for G‐I, suggesting that these drugs should more readily cross membranes by passive diffusion. In contrast, the second component (PC2) distinguishes the inhibitors by volume, MW and hydrophobicity. Therefore, imipramine, buprenorphine and methadone (Figure 2) were selected, as they are strong inhibitors whose second principal component is different (y‐axis in Figure 2).
Figure 2.
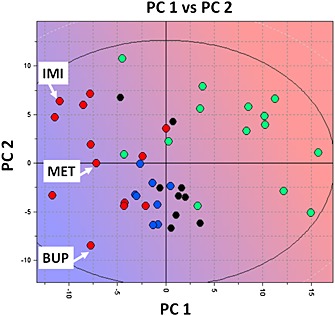
PCA t1–t2 score plot for the inhibitors and non‐inhibitors of the proton antiporter using the volsurf+ descriptors where G‐I is represented by red circles, M‐I by blue circles, W‐I by black circles and N‐I by green circles. The background colour refers to the LogP descriptor space where blue refers to high LogP value and red to low LogP value. It suggests that strong inhibitors have preferentially high LogP and %FU10 values (LogP mean value for G‐I = 3.6, for N‐I = −1.0; %FU10 mean value for G‐I = 78, for N‐I = 22). IMI, imipramine; MET, methadone; BUP, buprenorphine.
The three strong inhibitors selected, whose chemical structures are reported in Figure 3A, were automatically aligned by FLAPpharm (Figure 3B). The highest scoring pharmacophore model derived from the alignment is reported in Figure 3C. The pharmacophore is composed of a hydrophobic core (green region and points) and an H‐bond donor region in which the protonated amino groups of imipramine and methadone converge. Concerning the buprenorphine‐aligned structure, although it also possesses a charged nitrogen atom, the best alignment is obtained when the hydroxyl group in the 3,3‐dimethylbutan‐2‐ol moiety points towards the H‐bond donor region. Based on the proposed model, this suggests that a positive charge is required for interaction with the proton‐antiporter structure, but the hydrogen bond donor rather than an electrostatic interaction is a more important factor among those causing an inhibition effect. A different alignment of buprenorphine, imipramine and methadone, generating the second‐ranked pharmacophore model, gave similar pharmacophoric features (Figure S2). Moreover, an additional attempt was performed, selecting three other drugs differently located along the second principal component (amitriptyline, DPH and quinine), and again, a similar pharmacophore was obtained (Figures S3 and S4).
Figure 3.
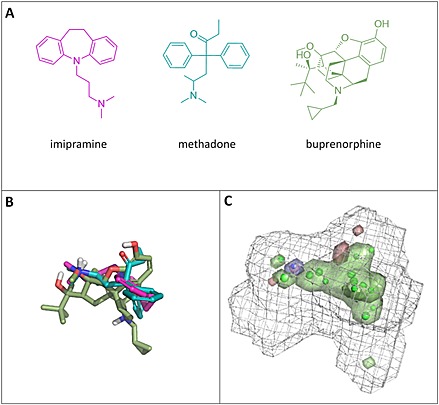
Pharmacophore for the proton‐antiporter inhibitor generated using FLAP. (A) Chemical structures of compounds selected from the PCA model shown in Figure 2. (B) Alignment obtained for imipramine, methadone and buprenorphine. (C) Pharmacophore obtained upon alignment in terms of common atom‐centred pseudoPIFs: the green areas represent the hydrophobic moieties, the blue area represents the H‐bond donor region, the red areas represent the H‐bond acceptor regions and the grey wireframe surface defines the shape of the pharmacophore. The green and blue points represent the most relevant common pharmacophoric points at the centroid of the pseudoPIFs.
In order to validate the discrimination capability of the pharmacophore model, a test set composed of drugs with known inhibition effect towards the proton antiporter was necessary. Therefore, the 44 compounds in Table 1 were used as a test set. Although three of these compounds were used for pharmacophore generation, the pharmacophore model has no records of the molecules from which it is derived. Therefore, the test set virtual screening of all compounds in Table 1 was performed using the pharmacophore previously generated as a template. Results were ranked by Glob‐Prod score (Table 2).
The enrichment plots for the test set virtual screenings are reported in Figure 4. In a first attempt, only G‐Is were classified as ‘positive’, while the other compounds were classified as ‘negative’ responses (Figure 4A). In a second attempt, G‐I and M‐I were classified as ‘positives’ (Figure 4B). The pharmacophore model proved to be an efficient tool for identifying G‐I and M‐I, with an AUC value of 0.84 and 0.95 respectively. In particular, it emerges from Table 2 that the majority of the early enrichment plot failures detected, when only G‐I compounds are considered, are actually M‐I.
Figure 4.
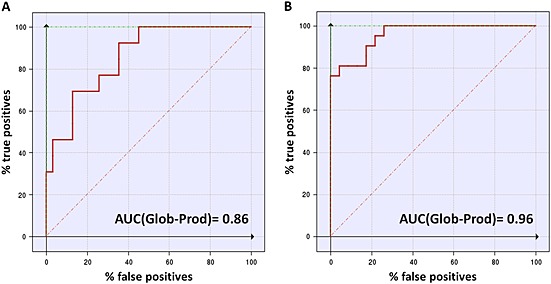
Enrichment plots comparison. Enrichment plots (ROC curves) for virtual screening on the pharmacophore model when G‐I only (A) or when G‐I and M‐I (B) are marked as ‘positive’ compounds. The true positive rate (sensitivity) in an ROC graph is plotted as a function of the false positive rate (100‐specificity). The area under the ROC graph (AUC) is a measure of how well a parameter can distinguish between two diagnostic groups (inhibitors/non‐inhibitors).
Pharmacophore‐based selection of possible novel inhibitors by virtual screening and evaluation of their inhibitory effect
The quality of the proposed pharmacophore model was further tested using external compounds. A virtual screening of a commercially available database of compounds from Specs (www.specs.netSC_specs_20mg_Nov2013, accessed November 2013) was performed. Compounds having a Glob‐Prod score greater than 0.25 (based on validation results reported in Table 2) were selected in order to maximize the probability of finding new G‐Is. Zwitterionic, neutral or negatively charged compounds were filtered out on the basis of the preliminary observation that all of the known inhibitors were positively charged at pH 7.4 (Table S3). After filtering, the remaining 93 compounds were projected in the PCA model shown in Figure 2, and the projection results are reported in Figure 5A. The majority of the hit compounds from virtual screening are located in the G‐I region, showing similar LogP and %FU10 behaviours, and none of them lays in the N‐I region. Ten compounds (Table 3, Figure 5B) were selected from the 93 compounds. They were selected for their high similarity score, commercial availability and by visual inspection to avoid selecting very similar structural three‐dimensional compounds. Looking at the protonable moiety, seven out of ten compounds (1, 2, 3, 4, 5, 6 and 9) bear a tertiary amine group, which may or may not be cyclic, two compounds (7 and 8) possess a 4,5‐dihydro‐1H‐imidazole group such as clonidine and compound 10 possesses a pyridinium group. Due to its nature and despite the pH, only the latter is permanently positively charged. In particular, hit compounds 7 and 10 were selected although they are borderline with N‐I according the PCA model, to evaluate prediction of the PCA model built using physical–chemical and ADE‐related descriptors.
Figure 5.
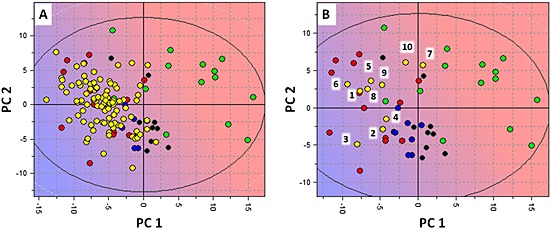
Projection of the virtual Specs screening hit compounds in the PCA model for proton‐antiporter inhibition. (A) Projection of the overall 93 hit compounds in the PCA t1–t2 score plot for the inhibitors and non‐inhibitors of the proton antiporter using the volsurf+ descriptors where G‐I is represented by red circles, M‐I by blue circles, W‐I by black circles, N‐I by green circles and projected compounds by yellow circles. The background colour refers to the LogP descriptor space where blue refers to high LogP value and red to low LogP value. Similarly to G‐I, the projected compounds commonly have high LogP and %FU10 values (LogP mean value = 3.1; %FU10 mean value = 85). (B) Disposition of the 10 selected compounds in the PCA t1–t2 score plot.
The IC50 values of the 10 inhibitor candidates obtained from virtual screening (Table 3) were determined using [3H]‐clonidine uptake. The inhibitor concentrations selected (0.01, 0.1, 1, 10, 100, 500 and 1000 µmol·L−1) allow G‐I to be discriminated. Compounds 1, 2, 3, 4, 5, 6 and 9 were classified as G‐I (Table 3). Interestingly, these G‐I compounds even have an IC50 below 10 µmol·L−1. Compound 9 was the most potent inhibitor reported in Table 3, with a similar IC50 value to nortriptyline. Compound 8 was classified in the W‐I group and two compounds, 7 and 10, as N‐I.
Virtual screening in databases of known drugs/natural/endogenous compounds and evaluation of their inhibitory effect
The screening performed on the Specs database proved useful for validating the pharmacophore generated from imipramine, buprenorphine and methadone. A further virtual screening session was performed using three databases that might provide further knowledge about this drug/proton antiporter. The databases selected are the following:
The Tropsha's human intestinal transporter database (Sedykh et al., 2013): a database of drugs and chemicals interacting with transport proteins (3768 unique chemicals and the interaction data associated with them for 12 membrane transport proteins);
Recon2 (based on MODEL 1109130000 data (Thiele et al., 2013)): a database for endogenous compounds in human (1133 structures); and
Human Metabolome Database (HMDB; from http://www.hmdb.ca/ 3.0; Wishart et al., 2013): a second database of small‐molecule metabolites found in the human body (41 992 compounds).
The screening of the database (a) could provide important information on the possible interaction of inhibitors of the proton antiporter with other transport proteins. Databases (b) and (c) were screened to identify endogenous compounds able to interact with the target. The chemical structures were standardized and ionized at pH 7.4. Only compounds within MW of 150 to 500 were kept for virtual screening. The aforementioned pharmacophore was used as a template. This time, attention was focused on the risk of clonidine inhibition. Therefore, clonidine was added to the database when not already present, and compounds ranked higher than clonidine were selected (no restriction on the number of compounds). Only compounds predicted to be mostly positively charged at pH 7.4 according to the most abundant species predicted by moka were kept, based on the observation that a positive charge should be fundamental for the interaction with the target.
The lists of the compounds selected by the virtual screening of the three databases are reported in Tables S4–S6. Most of the compounds retrieved from these databases and predicted as clonidine‐transport inhibitor are neuro‐active or psychoactive without targeting any specific pharmacological class. The following were listed among the most predicted possible inhibitors: opioids (e.g. naltrexone and methadone), other alkaloids (e.g. quinidine, quinine and cocaine derivatives), tryptophan pathway compounds (e.g. dimethyltryptamine), antidepressants and antipsychotics (e.g. phenothiazine, thioxanthene, tricyclic and venlafaxine derivatives), anticholinergic drugs (e.g. atropine and biperiden), antihistaminic drugs (e.g. promethazine and pheniramine) and muscarinic drugs (e.g. pridinol). Some of these compounds have already been reported as being inhibitors of this proton antiporter (Tables 1, S4–S5). Some scaffolds seem to be linked to the ability of clonidine transport inhibition, e.g. tricyclic antidepressant, thioxantene antipsychotics, pheniramine, indole scaffolds or tryptan derivatives (e.g. sumatriptan), were most of the derivatives predicted as inhibitors of clonidine transport.
The frequency of interaction with other drug transporters clinically relevant in ADE was evaluated for compounds selected from the database (a) (Table S4); 80% of the selected compounds are reported to interact with MDR1/ABCB1, and 19% with OCT1/SLC22A1. Other targets are BCRP/ABCG2 and MRP2/ABCC2 (12% and 11% respectively). A few compounds also interacted with ASBT/SLC10A2, OATP2B1/SLC21A9 and MRP1/ABCC1.
The IC50 against [3H]‐clonidine for some new virtual screening G‐I was measured for positively charged tricyclic antidepressants (clomipramine, doxepin), antipsychotic (chlorpromazine) and antiallergic (pheniramine) (Table S4). Among the endogenous compounds from the Recon2 database (Table S5), only thyrotropin‐releasing hormone (TRH) showed both a high Glob‐Prod score and a positive charge at pH 7.4 and so was selected for testing. In addition, three filtered‐out compounds, 5,6,7,8‐tetrahydrobiopterine, melatonin and N‐methylserotonin, were also tested to evaluate the N‐I predictivity (Table S5). Dimethyltryptamine was selected from the HMDB database (Table S6) but is less relevant as endogenous compound. Tryptamine, a precursor for dimethyltryptamine, is also part of the tryptophan pathway, like 5‐HT, N‐methyl‐5‐HT and melatonin, and represents a more relevant endogenous compound (Stone and Darlington, 2002). Because tryptamine and dimethyltryptamine showed an almost identical pharmacophore alignment (Figure S5), tryptamine was tested. Predictions were verified against [3H]‐clonidine (IC50 < 10 µmol·L−1) (Table 4). Over the selected endogenous compounds, only tryptamine inhibited [3H]clonidine transport (G‐I), confirming that the filtered‐out endogenous neutral compound are N‐I (Tables 4 and S5). TRH was found to be N‐I. We tested tyramine implicated in tryptamine neurotransmission (Borowsky et al., 2001), but filtered‐out by our MW restriction. Tyramine inhibits [3H]clonidine transport as a W‐I (IC50 ~ 160 µmol·L−1).
Discussion and conclusions
Functional experiments have already established the role played by a polyspecific bidirectional carrier‐mediated system, in several body barriers including the BBB (André et al., 2009; Cisternino et al., 2013; Chapy et al., 2014; Fischer et al., 2010; Okura et al., 2008). This system is described as a molecularly unknown drug/proton antiporter and presents analogies with proton–drug transporters known from the major facilitator system (MFS) in prokaryotes and eukaryotes (Law et al., 2008; Sa‐Correia et al., 2009; Madej et al., 2013).
The drug rate access into the brain depends on the drug ability to cross the BBB, which depends both on the drug physicochemical and biochemical properties. Clinical and preclinical studies have demonstrated the critical role of the rate of drug of abuse delivery to the brain in the neuronal plasticity, reward effects and addiction liability (Samaha and Robinson, 2005; Seleman et al., 2014; Volkow et al., 2012). The use of an inhibitor of the proton antiporter could reduce the brain entry rate of drugs/substrates. It will represent also a valuable tool for discovering and illustrating the proton‐antiporter role as a pharmacological target and may be beneficial in sustaining drug abstinence. Quite similarly, the PK strategies to decrease/slow the access of the brain parenchyma to drugs of abuse has been clinically investigated by vaccine/immune strategy promoting the specific trapping by drug‐antibody reaction limiting its access to the brain or by increasing drug metabolism (Gorelick, 2012). We suggest a third PK strategy by using new and potent inhibitors of this proton antiporter that may be efficient at achievable in vivo plasma concentrations administered by the usual routes (e.g. oral and transcutaneous). Even if a relatively broad diversity of chemical structures and pharmacological compounds has been shown to inhibit this transporter by in vitro/in situ strategies, their potency remains too low to lead to a significant in vivo effect. This paper reports the development and validation of a pharmacophore inhibition model for this new human BBB proton antiporter, which was successfully used to identify new inhibitors.
It is remarkable that the pharmacophore was generated by the alignment of only three compounds, opportunely selected to cover the chemical diversity of the strong inhibitors known at the time. Virtual screening of a large database commercially available from Specs (171 493 compounds) was run using the pharmacophore as a template. Ten top‐ranked compounds were tested on the 93 identified, and interesting information emerged. First of all, seven out of ten selected hits were strong inhibitors, with an IC50 value < 10 µmol·L−1. Only seven compounds were already known to inhibit the transporter with the same strength (Table 1), and compound 9 displayed a very low IC50 value of 1.1 µmol·L−1, comparable only with the antidepressant tricyclic nortriptyline.
The projection of virtual screening compounds in the PCA generated from compounds in Table 1 using the volsurf+ descriptors (Figure 5) was able to predict the potential low inhibitory effect of compounds 7 and 10. This indicates that a refinement of the virtual screening results by a PCA model based on physical–chemical and ADE‐related descriptors represents a valuable strategy. A closer inspection of the results reported in Table 3 reveals that only compounds bearing a cyclic or non‐cyclic tertiary amine induced the inhibitory effect, while compounds possessing a 4,5‐dihydro‐1H‐imidazole (compounds 7 and 8) displayed very weak or no activity, and compound with a pyridinium ring (compound 4), like 1‐methyl‐4‐phenylpyridinium (MPP), displayed no activity. Compounds 7 and 8 can be considered to have the same cyclic ring as clonidine, which is indeed classified as W‐I (Table 1). Regarding compound 10, the permanent positive charge might be responsible for the non‐interaction.
The screening of the Tropsha's database of chemicals interacting with transporters confirmed the four drugs selected for testing, as they resulted to be all G‐I of the proton antiporter. In particular, chlorpromazine displayed an IC50 (0.50 µmol·L−1) value lower than nortriptyline (0.80 µmol·L−1). Despite their diverse therapeutic uses (chlorpromazine, phenothiazine antipsychotic; clomipramine and doxepin, tricyclic antidepressants; pheniramine, antihistaminic), theses four drugs are chemically classified as ‘cationic amphiphilic drugs’ (CAD). Other CAD, such as nortriptyline, desipramine, imipramine and amitriptyline, were also found to be G‐I (Table 1), suggesting that drugs from the tricyclic antidepressant class are likely G‐I of the proton antiporter. Two pharmacophores for CAD have been recently published (Goracci et al., 2014; Slavov et al., 2014), having some common features with the proton‐antiporter pharmacophore (i.e. extended hydrophobic moiety and a protonated nitrogen). Although the pharmacophore was built according to the interaction of selected drugs with the substrate probe [3H]‐clonidine, experiments with two other substrates ([3H]‐cocaine, [3H]‐naloxone) confirmed that G‐I were similarly top‐ranked with a tendency for lower values of IC50 when using [3H]‐cocaine as substrate.
The virtual screenings performed on the two databases for endogenous compounds (HMDB and Recon2) show an overall lower match with the pharmacophore. Two possible inhibitors and three possible non‐inhibitors were tested in vitro. Based on these experimental [3H]‐clonidine IC50 determinations, our method allowed us to predict correctly four out of five compounds, with TRH being a false positive. The high polarity of this latter compound (LogP < −2) according to volsurf+ prediction (Mannhold et al., 2006) can be responsible for non‐inhibition. In addition, the protonated nitrogen in TRH should be located in the imidazole ring. Compounds 7 and 8 and clonidine, bearing a 4,5‐dihydro‐1H‐imidazole group, were already defined as N‐I or W‐I. Thus, taking into account that an aromatic imidazole ring is less basic than a 4,5‐dihydro‐1H‐imidazole group, the effect for TRH is reasonable. Among the endogenous compounds, tryptamine was found to be a G‐I. This is the first example of a primary amine with strong inhibitory effect in our series. Tryptamine was previously described as an inhibitor of this transporter in Caco‐2 cells (Fischer et al., 2006), but no endogenous substrate has been identified yet. Tryptamine, like tyramine, is a compound involved in the tryptophan/5‐HT pathway and known as a neurotransmitter acting on specific receptors at trace level and its potential to reach an IC50 and inhibit this proton antiporter in vivo is unlikely (Borowsky et al., 2001).
Despite the wide chemical and pharmacological diversity of compounds also known to interact with the ABC efflux transporter P‐gp (MDR1, ABCB1), their main common property is their cationic/neutral property. Therefore, it is less surprising that screened cationic inhibitors could interact with P‐gp. To better evaluate the possible relationship and selectivity between the P‐gp and the proton‐antiporter, a PLS‐DA model for P‐gp inhibition was generated using a previously published database (1275 compounds) of P‐gp inhibitors and N‐Is (Broccatelli et al., 2011), and the volsurf+ descriptors as variables (Mannhold et al., 2006). The 25 proton‐antiporter G‐Is reported in the present study (Tables 2, 3, 4) were projected in the P‐gp model (Figure 6A). Among the 25 G‐Is, 5 drugs are predicted as dual inhibitors (Table S7), of which 3 (chlorpromazine, clomipramine and verapamil) were confirmed as P‐gp inhibitors by the literature. The remaining compounds were classified as possible P‐gp N‐I, including some confirmed by literature. Quinine was the only compound predicted as P‐gp N‐I, although it is a known P‐gp inhibitor (Broccatelli et al., 2011). Compared with the most part of P‐gp inhibitors, the PLS‐DA coefficients suggest that the proton‐antiporter inhibitors possess reduced size/shape features and are in general more water‐soluble (Figure 6B).
Figure 6.
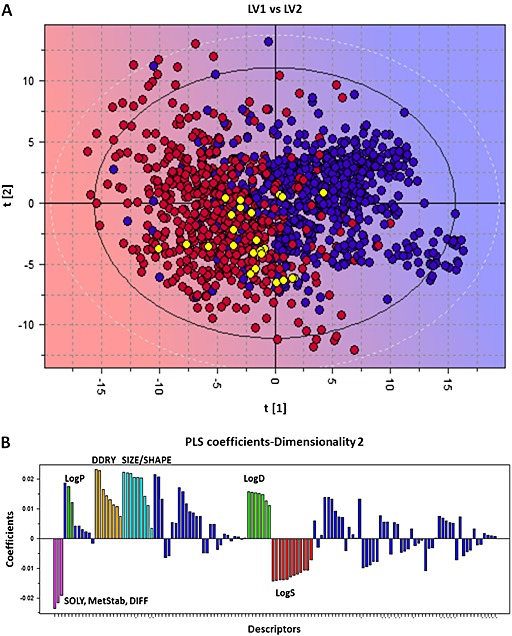
Projection of the good proton‐antiporter inhibitors to the PLS‐DA t/t score plot for P‐gp inhibitors. (A) Blue circles = P‐gp inhibitors, red circles = P‐gp non‐inhibitors and yellow circles = projected proton‐antiporter inhibitors. The background colour refers to the P‐gp inhibitory effect where blue refers to inhibitors and red to non‐inhibitors. (B) Coefficients plot of the PLS‐DA model. Descriptors at the upper part directly correlate with P‐gp inhibition. Descriptors at the lower part inversely correlate with P‐gp inhibition. The higher the bar, the more important the descriptor. Some descriptors blocks that play a main role in the PLS‐DA model were coloured. Cyano: size/shape descriptors, including molecular weight, volume and surface. Orange: DDRY descriptors, related to the overall hydrophobicity of the compounds. Green: LogP (dark green) and LogD (pale green) descriptors. Pink: descriptors related to solubility, such as SOLY (solubility), MetStab (metabolic stability) and DIFF (diffusivity). Red: other solubility descriptors.
The SLC/MFS transporter OCT1 exhibits the narrowest range of compound interactions as compared with P‐gp, highlighting the greatest proximity of the proton‐antiporter chemical interactions with P‐gp than with OCT. Although OCT and MATE inhibitor compounds were shown to overlap (Wittwer et al., 2013), these two major MFS are also known to interact with distinct proton‐antiporter inhibitors and substrates drugs. OCT interact with chemical structures like neurotransmitters (e.g. dopamine and 5‐HT), pyridinium compounds (e.g. MPP) or permanent protonated nitrogen (e.g. TEA, MPP and choline) (Koepsell et al., 2007; André et al., 2012), which are unable to inhibit this molecularly unknown proton antiporter. These distinct properties greatly help to discriminate this novel proton antiporter at least from OCT/MATE transporter functions. Other transporters (e.g. OATP, ASBT and MRP) marginally overlap with the identified inhibitors in accordance with their known ability to interact mainly with anionic compounds.
Although inhibitory potency is the first important criterion to identify a valuable compound, the unbound plasma fraction (f u) is another critical parameter that impacts the free active fraction and could modulate the inhibition efficacy in vivo. According to the guidelines established by the International Transporter Consortium for inhibition of drug transporters, the ratio between the unbound plasma maximal concentration of the inhibitor and IC50 established by in vitro assay should be greater than or equal to 0.1 to expect a hypothetical drug–drug interaction in vivo (Giacomini et al., 2010). Among the G‐Is with reported PK in human, we did not find any drug reaching this threshold at maximal non‐toxic concentrations for clonidine or cocaine interaction. Besides the inhibition potency that can be relative, the pharmacological effect of the inhibitor should be specific to avoid any confounding effect when evaluating the pharmacodynamic of a co‐administered substrate/drug.
This FLAPpharm approach proved helpful in identifying positive and false negative screening hits and was able to identify additional inhibitors of this novel drug/proton antiporter. This will be of great use for the discovery and design of stronger inhibitors.
Author contribution
H. C., L. G., P. V., Y. P., P. A. C., X. D., J. M. S., S. C. and G. C. designed the research study and approved the MS. H. C., L. G., P. V., S. C. and G. C. performed the research. H. C., L. G., P. V., S. C. and G. C. analysed the data. H. C., L. G., S. C. and G. C. wrote the paper.
Conflict of interest
None.
Supporting information
Table S1 Effects of selected organic compounds on [3H]‐clonidine (A) and [3H]‐naloxone (B)uptake in hCMEC/D3 cells.
Table S2 Inhibition potency of selected organic compounds against [3H]‐cocaine (A) and [3H]‐naloxone (B) transport in hCMEC/D3 cells.
Table S3 Predicted pKa value and charge of the most abundant species at pH=7.4.
Table S4 Virtual screening selected hits from the Tropsha et al. database (Sedykh et al.,2013).
Table S5 Virtual screening selected compounds from the Recon 2 database.
Table S6 Virtual screening selected hits fromtheHMDBdatabase.
Table S7 Predicted P‐gp inhibition effect for the protonantiporter good‐inhibitors according to the VolSurf+ PLS‐DA model.
Figure S1 Passive and carrier‐mediated flux of naloxone in hCMEC/D3 cells. Total uptake (nmol·min-1·mg-1; black dashed line) was measured in hCMEC/D3 cells and plotted against total naloxone concentration in the Krebs‐HEPES (KH) incubation buffer at pHe 7.40. The straight dotted line represents the passive transport of naloxone (Kpassive 3.4 ± 0.3 µL·min-1·mg-1 at pH 7.40). The solid line represents the curve obtained by subtracting the passive flux from the total flux and fitting to the carrier‐mediated Michaelis‐Menten term (see Eq. 1) by nonlinear least‐square regression. Estimated parameters for naloxone transport in hCMEC/D3 cells are: Km, 0.19 ± 0.05 mmol·l-1, Vmax, 2.9 ± 0.5 nmol·min-1·mg-1. Datarepresentmeans ± SDof experiments performed in triplicate.
Figure S2 Second ranked pharmacophore model generated from a different alignment of imipramine, methadone and buprenorphine. A. Chemical structures of the selected compounds. B. Alignment obtained for imipramine (purple), methadone (cyan), and buprenorphine (green). C. Pharmacophore obtained upon alignment in terms of common atom‐centered pharma cophoric pseudo fields (pseudoPIFs): the green areas represent the hydrophobic moieties, the blue area represents the H‐bond donor region, the red areas represent the H‐bond acceptor regions, and the light‐blue wireframe surface defines the shape of the Pharmacophore. The green and blue points represent the most relevant common pharmacophoric points at the centroid of the pseudoPIFs.
Figure S3 Selection of other three drugs based on the PCA t1‐t2 score plot for the inhibitors and noninhibitors of the proton antiporter, generated using the VolSurf+ descriptors (G‐I, red circles; M‐I, blue circles; W‐I, black circles; N‐I, green circles). The background color refers to the LogP descriptor space (blue=high LogP and red = low LogP value). It suggests that strong inhibitors have preferentially high logP and %FU10 values (LogP mean value for G‐I= 3.6, for N‐I= ‐1.0; %FU10 mean value for G‐I= 78, for N‐I= 22). AMI=amitriptyline, DIP=diphenhydramine, QUI=quinine.
Figure S4 Pharmacophore for proton‐antiporter inhibitor generated using FLAP compounds selected in Figure S3. A. Chemical structures of the selected compounds. B. Alignment obtained for amitriptyline (orange), diphenhydramine (pink), and quinine (grey). C. Pharmacophore obtained upon alignment in terms of common atom‐centered pharmacophoric pseudo fields (pseudoPIFs): the green areas represent the hydrophobic moieties, the blue area represents the H‐bond donor region, the red areas represent the H‐bond acceptor regions, and the light‐blue wireframe surface defines the shape of the Pharmacophore. The green and blue points represent the most relevant common pharmacophoric points at the centroid of the pseudoPIFs.
Figure S5 Alignment of dymethyl‐tryptamine (orange) and tryptamine (cyano) on the pharmacophore. The green spheres and the blue sphere represent the main features of the pharmacophore translated in atomic coordinates (green=hydrophobic; blue= H‐bond donor).
Supporting info item
Acknowledgements
We thank Dr Pierre‐Olivier Couraud (Institut Cochin, Paris, France) for providing hCMEC/D3 cells. We thank the Paris Descartes University Foundation and Servier Laboratories for the financial support granted to Hélène Chapy.
Chapy, H. , Goracci, L. , Vayer, P. , Parmentier, Y. , Carrupt, P.‐A. , Declèves, X. , Scherrmann, J.‐M. , Cisternino, S. , and Cruciani, G. (2015) Pharmacophore‐based discovery of inhibitors of a novel drug/proton antiporter in human brain endothelial hCMEC/D3 cell line. British Journal of Pharmacology, 172: 4888–4904. doi: 10.1111/bph.13258.
References
- Abbott NJ, Patabendige AA, Dolman DE, Yusof SR, Begley DJ (2010). Structure and function of the blood–brain barrier. Neurobiol Dis 37: 13–25. [DOI] [PubMed] [Google Scholar]
- Alexander SPH, Benson HE, Faccenda E, Pawson AJ, Sharman JL, Spedding M et al. (2013). The concise guide to pharmacology 2013/14: transporters. Br J Pharmacol 170: 1706–1796. [DOI] [PMC free article] [PubMed] [Google Scholar]
- André P, Debray M, Scherrmann JM, Cisternino S (2009). Clonidine transport at the mouse blood–brain barrier by a new H+ antiporter that interacts with addictive drugs. J Cereb Blood Flow Metab 29: 1293–1304. [DOI] [PubMed] [Google Scholar]
- Andre P, Saubamea B, Cochois‐Guegan V, Marie‐Claire C, Cattelotte J, Smirnova M et al. (2012). Transport of biogenic amine neurotransmitters at the mouse blood–retina and blood–brain barriers by uptake1 and uptake2. J Cereb Blood Flow Metab 32: 1989–2001. [DOI] [PMC free article] [PubMed] [Google Scholar]
- Astorga B, Ekins S, Morales M, Wright SH (2012). Molecular determinants of ligand selectivity for the human multidrug and toxin extruder proteins MATE1 and MATE2‐K. J Pharmacol Exp Ther 341: 743–755. [DOI] [PMC free article] [PubMed] [Google Scholar]
- Baroni M, Cruciani G, Sciabola S, Perruccio F, Mason JS (2007). A common reference framework for analyzing/comparing proteins and ligands. Fingerprints for Ligands and Proteins (FLAP): theory and application. J Chem Inf Model 47: 279–294. [DOI] [PubMed] [Google Scholar]
- Borowsky B, Adham N, Jones KA, Raddatz R, Artymyshyn R, Ogozalek KL et al. (2001). Trace amines: identification of a family of mammalian G protein‐coupled receptors. Proc Natl Acad Sci U S A 98: 8966–8971. [DOI] [PMC free article] [PubMed] [Google Scholar]
- Broccatelli F, Carosati E, Neri A, Frosini M, Goracci L, Oprea TI et al. (2011). A novel approach for predicting P‐glycoprotein (ABCB1) inhibition using molecular interaction fields. J Med Chem 54: 1740–1751. [DOI] [PMC free article] [PubMed] [Google Scholar]
- Chapy H, Andre P, Declèves X, Scherrmann JM, Cisternino S (2015). Polyspecific drug proton‐antiporter mediates diphenhydramine and clonidine transport at the mouse blood–retina barrier. Br J Pharmacol. doi:10.1111/bph.13246. [DOI] [PMC free article] [PubMed] [Google Scholar]
- Chapy H, Smirnova M, Andre P, Schlatter J, Chiadmi F, Couraud P et al. (2014). Carrier‐mediated cocaine transport at the blood–brain barrier as a putative mechanism in addiction liability. Int J Neuropsychopharmacol 18. doi:10.1093/ijnp/pyu001. [DOI] [PMC free article] [PubMed] [Google Scholar]
- Cisternino S, Chapy H, Andre P, Smirnova M, Debray M, Scherrmann JM (2013). Coexistence of passive and proton antiporter‐mediated processes in nicotine transport at the mouse blood–brain barrier. AAPS J 15: 299–307. [DOI] [PMC free article] [PubMed] [Google Scholar]
- Crivori P, Cruciani G, Carrupt PA, Testa B (2000). Predicting blood–brain barrier permeation from three‐dimensional molecular structure. J Med Chem 43: 2204–2216. [DOI] [PubMed] [Google Scholar]
- Cross S, Baroni M, Goracci L, Cruciani G (2012). GRID‐based three‐dimensional pharmacophores I: FLAPpharm, a novel approach for pharmacophore elucidation. J Chem Inf Model 52: 2587–2598. [DOI] [PubMed] [Google Scholar]
- Cruciani C, Crivori P, Carrupt PA, Testa B (2000). Molecular fields in quantitative structure‐permeation relationships: the VolSurf approach. J Mol Struc‐Theochem 503: 17–30. [Google Scholar]
- Dauchy S, Miller F, Couraud PO, Weaver RJ, Weksler B, Romero IA et al. (2009). Expression and transcriptional regulation of ABC transporters and cytochromes P450 in hCMEC/D3 human cerebral microvascular endothelial cells. Biochem Pharmacol 77: 897–909. [DOI] [PubMed] [Google Scholar]
- Ekins S, Kim RB, Leake BF, Dantzig AH, Schuetz EG, Lan LB et al. (2002). Three‐dimensional quantitative structure‐activity relationships of inhibitors of P‐glycoprotein. Mol Pharmacol 61: 964–973. [DOI] [PubMed] [Google Scholar]
- Fischer W, Bernhagen J, Neubert RH, Brandsch M (2010). Uptake of codeine into intestinal epithelial (Caco‐2) and brain endothelial (RBE4) cells. Eur J Pharm Sci 41: 31–42. [DOI] [PubMed] [Google Scholar]
- Fischer W, Metzner L, Hoffmann K, Neubert RH, Brandsch M (2006). Substrate specificity and mechanism of the intestinal clonidine uptake by Caco‐2 cells. Pharm Res 23: 131–137. [DOI] [PubMed] [Google Scholar]
- Giacomini KM, Consortium IT, Huang SM, Tweedie DJ, Benet LZ, Brouwer KL et al. (2010). Membrane transporters in drug development. Nature Rev Drug Discovery 9: 215–236. [DOI] [PMC free article] [PubMed] [Google Scholar]
- Goldberg MJ, Spector R, Chiang CK (1987). Transport of diphenhydramine in the central nervous system. J Pharmacol Exp Ther 240: 717–722. [PubMed] [Google Scholar]
- Goracci L, Buratta S, Urbanelli L, Ferrara G, Di Guida R, Emiliani C et al. (2014). Evaluating the risk of phospholipidosis using a new multidisciplinary pipeline approach. Eur J Med Chem 92C: 49–63. [DOI] [PubMed] [Google Scholar]
- Gorelick DA (2012). Pharmacokinetic strategies for treatment of drug overdose and addiction. Future Med Chem 4: 227–243. [DOI] [PMC free article] [PubMed] [Google Scholar]
- Koepsell H, Lips K, Volk C (2007). Polyspecific organic cation transporters: structure, function, physiological roles, and biopharmaceutical implications. Pharm Res 24: 1227–1251. [DOI] [PubMed] [Google Scholar]
- Kuwayama K, Inoue H, Kanamori T, Tsujikawa K, Miyaguchi H, Iwata Y et al. (2008). Uptake of 3,4‐methylenedioxymethamphetamine and its related compounds by a proton‐coupled transport system in Caco‐2 cells. Biochim Biophys Acta 1778: 42–50. [DOI] [PubMed] [Google Scholar]
- Law CJ, Maloney PC, Wang DN (2008). Ins and outs of major facilitator superfamily antiporters. Annu Rev Microbiol 62: 289–305. [DOI] [PMC free article] [PubMed] [Google Scholar]
- Madej MG, Dang S, Yan N, Kaback HR (2013). Evolutionary mix‐and‐match with MFS transporters. Proc Natl Acad Sci U S A 110: 5870–5874. [DOI] [PMC free article] [PubMed] [Google Scholar]
- Mannhold R, Berellini G, Carosati E, Benedetti P (2006). Use of MIF‐based VolSurf descriptors in physicochemical and pharmacokinetic studies In. Molecular Interaction Fields: Applications in Drug Discovery and ADME Prediction, edn, Vol. 27: Wiley‐VCH: New York: pp 173–196. [Google Scholar]
- Milletti F, Storchi L, Goracci L, Bendels S, Wagner B, Kansy M et al. (2010). Extending pKa prediction accuracy: high‐throughput pKa measurements to understand pKa modulation of new chemical series. Eur J Med Chem 45: 4270–4279. [DOI] [PubMed] [Google Scholar]
- Okura T, Hattori A, Takano Y, Sato T, Hammarlund‐Udenaes M, Terasaki T et al. (2008). Involvement of the pyrilamine transporter, a putative organic cation transporter, in blood–brain barrier transport of oxycodone. Drug Metab Dispos 36: 2005–2013. [DOI] [PubMed] [Google Scholar]
- Pawson AJ, Sharman JL, Benson HE, Faccenda E, Alexander SP, Buneman OP et al. (2014). The IUPHAR/BPS Guide to PHARMACOLOGY: an expert‐driven knowledgebase of drug targets and their ligands. Nucl. Acids Res. 42: D1098–106. [DOI] [PMC free article] [PubMed] [Google Scholar]
- Penzotti JE, Lamb ML, Evensen E, Grootenhuis PD (2002). A computational ensemble pharmacophore model for identifying substrates of P‐glycoprotein. J Med Chem 45: 1737–1740. [DOI] [PubMed] [Google Scholar]
- Sa‐Correia I, dos Santos SC, Teixeira MC, Cabrito TR, Mira NP (2009). Drug:H+ antiporters in chemical stress response in yeast. Trends Microbiol 17: 22–31. [DOI] [PubMed] [Google Scholar]
- Sadiq MW, Borgs A, Okura T, Shimomura K, Kato S, Deguchi Y et al. (2011). Diphenhydramine active uptake at the blood–brain barrier and its interaction with oxycodone in vitro and in vivo . J Pharm Sci 100: 3912–3923. [DOI] [PubMed] [Google Scholar]
- Samaha AN, Mallet N, Ferguson SM, Gonon F, Robinson TE (2004). The rate of cocaine administration alters gene regulation and behavioral plasticity: implications for addiction. J Neurosci 24: 6362–6370. [DOI] [PMC free article] [PubMed] [Google Scholar]
- Samaha AN, Robinson TE (2005). Why does the rapid delivery of drugs to the brain promote addiction? Trends Pharmacol Sci 26: 82–87. [DOI] [PubMed] [Google Scholar]
- Sedykh A, Fourches D, Duan J, Hucke O, Garneau M, Zhu H et al. (2013). Human intestinal transporter database: QSAR modeling and virtual profiling of drug uptake, efflux and interactions. Pharm Res 30: 996–1007. [DOI] [PMC free article] [PubMed] [Google Scholar]
- Seelig A, Gottschlich R, Devant RM (1994). A method to determine the ability of drugs to diffuse through the blood–brain barrier. Proc Natl Acad Sci U S A 91: 68–72. [DOI] [PMC free article] [PubMed] [Google Scholar]
- Seleman M, Chapy H, Cisternino S, Courtin C, Smirnova M, Schlatter J et al. (2014). Impact of P‐glycoprotein at the blood–brain barrier on the uptake of heroin and its main metabolites: behavioral effects and consequences on the transcriptional responses and reinforcing properties. Psychopharmacology (Berl) 231: 3139–3149. [DOI] [PubMed] [Google Scholar]
- Shaffer CL, Osgood SM, Mancuso JY, Doran AC (2014). Diphenhydramine has similar interspecies net active influx at the blood–brain barrier. J Pharm Sci; 103: 1557–1562. [DOI] [PubMed] [Google Scholar]
- Sirci F, Goracci L, Rodriguez D, van Muijlwijk‐Koezen J, Gutierrez‐de‐Teran H, Mannhold R (2012). Ligand‐, structure‐ and pharmacophore‐based molecular fingerprints: a case study on adenosine A(1), A (2A), A (2B), and A (3) receptor antagonists. J Comput Aided Mol Des 26: 1247–1266. [DOI] [PubMed] [Google Scholar]
- Slavov SH, Wilkes JG, Buzatu DA, Kruhlak NL, Willard JM, Hanig JP et al. (2014). Computational identification of a phospholipidosis toxicophore using (13)C and (15)N NMR‐distance based fingerprints. Bioorg Med Chem 22: 6706–6714. [DOI] [PubMed] [Google Scholar]
- Stone TW, Darlington LG (2002). Endogenous kynurenines as targets for drug discovery and development. Nat Rev Drug Discov 1: 609–620. [DOI] [PubMed] [Google Scholar]
- Thiele I, Swainston N, Fleming RM, Hoppe A, Sahoo S, Aurich MK et al. (2013). A community‐driven global reconstruction of human metabolism. Nat Biotechnol 31: 419–425. [DOI] [PMC free article] [PubMed] [Google Scholar]
- Volkow ND, Wang GJ, Fischman MW, Foltin R, Fowler JS, Franceschi D et al. (2000). Effects of route of administration on cocaine induced dopamine transporter blockade in the human brain. Life Sci 67: 1507–1515. [DOI] [PubMed] [Google Scholar]
- Volkow ND, Wang GJ, Fowler JS, Tomasi D (2012). Addiction circuitry in the human brain. Annu Rev Pharmacol Toxicol 52: 321–336. [DOI] [PMC free article] [PubMed] [Google Scholar]
- Wishart DS, Jewison T, Guo AC, Wilson M, Knox C, Liu Y et al. (2013). HMDB 3.0—the Human Metabolome Database in 2013. Nucleic Acids Res 41: D801–807. [DOI] [PMC free article] [PubMed] [Google Scholar]
- Wittwer MB, Zur AA, Khuri N, Kido Y, Kosaka A, Zhang X et al. (2013). Discovery of potent, selective multidrug and toxin extrusion transporter 1 (MATE1, SLC47A1) inhibitors through prescription drug profiling and computational modeling. J Med Chem 56: 781–795. [DOI] [PMC free article] [PubMed] [Google Scholar]
- Xu Y, Liu X, Li S, Zhou N, Gong L, Luo C et al. (2013). Combinatorial pharmacophore modeling of organic cation transporter 2 (OCT2) inhibitors: insights into multiple inhibitory mechanisms. Mol Pharm 10: 4611–4619. [DOI] [PubMed] [Google Scholar]
Associated Data
This section collects any data citations, data availability statements, or supplementary materials included in this article.
Supplementary Materials
Table S1 Effects of selected organic compounds on [3H]‐clonidine (A) and [3H]‐naloxone (B)uptake in hCMEC/D3 cells.
Table S2 Inhibition potency of selected organic compounds against [3H]‐cocaine (A) and [3H]‐naloxone (B) transport in hCMEC/D3 cells.
Table S3 Predicted pKa value and charge of the most abundant species at pH=7.4.
Table S4 Virtual screening selected hits from the Tropsha et al. database (Sedykh et al.,2013).
Table S5 Virtual screening selected compounds from the Recon 2 database.
Table S6 Virtual screening selected hits fromtheHMDBdatabase.
Table S7 Predicted P‐gp inhibition effect for the protonantiporter good‐inhibitors according to the VolSurf+ PLS‐DA model.
Figure S1 Passive and carrier‐mediated flux of naloxone in hCMEC/D3 cells. Total uptake (nmol·min-1·mg-1; black dashed line) was measured in hCMEC/D3 cells and plotted against total naloxone concentration in the Krebs‐HEPES (KH) incubation buffer at pHe 7.40. The straight dotted line represents the passive transport of naloxone (Kpassive 3.4 ± 0.3 µL·min-1·mg-1 at pH 7.40). The solid line represents the curve obtained by subtracting the passive flux from the total flux and fitting to the carrier‐mediated Michaelis‐Menten term (see Eq. 1) by nonlinear least‐square regression. Estimated parameters for naloxone transport in hCMEC/D3 cells are: Km, 0.19 ± 0.05 mmol·l-1, Vmax, 2.9 ± 0.5 nmol·min-1·mg-1. Datarepresentmeans ± SDof experiments performed in triplicate.
Figure S2 Second ranked pharmacophore model generated from a different alignment of imipramine, methadone and buprenorphine. A. Chemical structures of the selected compounds. B. Alignment obtained for imipramine (purple), methadone (cyan), and buprenorphine (green). C. Pharmacophore obtained upon alignment in terms of common atom‐centered pharma cophoric pseudo fields (pseudoPIFs): the green areas represent the hydrophobic moieties, the blue area represents the H‐bond donor region, the red areas represent the H‐bond acceptor regions, and the light‐blue wireframe surface defines the shape of the Pharmacophore. The green and blue points represent the most relevant common pharmacophoric points at the centroid of the pseudoPIFs.
Figure S3 Selection of other three drugs based on the PCA t1‐t2 score plot for the inhibitors and noninhibitors of the proton antiporter, generated using the VolSurf+ descriptors (G‐I, red circles; M‐I, blue circles; W‐I, black circles; N‐I, green circles). The background color refers to the LogP descriptor space (blue=high LogP and red = low LogP value). It suggests that strong inhibitors have preferentially high logP and %FU10 values (LogP mean value for G‐I= 3.6, for N‐I= ‐1.0; %FU10 mean value for G‐I= 78, for N‐I= 22). AMI=amitriptyline, DIP=diphenhydramine, QUI=quinine.
Figure S4 Pharmacophore for proton‐antiporter inhibitor generated using FLAP compounds selected in Figure S3. A. Chemical structures of the selected compounds. B. Alignment obtained for amitriptyline (orange), diphenhydramine (pink), and quinine (grey). C. Pharmacophore obtained upon alignment in terms of common atom‐centered pharmacophoric pseudo fields (pseudoPIFs): the green areas represent the hydrophobic moieties, the blue area represents the H‐bond donor region, the red areas represent the H‐bond acceptor regions, and the light‐blue wireframe surface defines the shape of the Pharmacophore. The green and blue points represent the most relevant common pharmacophoric points at the centroid of the pseudoPIFs.
Figure S5 Alignment of dymethyl‐tryptamine (orange) and tryptamine (cyano) on the pharmacophore. The green spheres and the blue sphere represent the main features of the pharmacophore translated in atomic coordinates (green=hydrophobic; blue= H‐bond donor).
Supporting info item