

Abstract
Background and Purpose
NO is a crucial regulator of energy and lipid metabolism, whose homeostasis is compromised during obesity. Combination of citrulline and atorvastatin potentiated NO production in vitro. Here we have assessed the effects of this combination in mice with diet‐induced obesity (DIO).
Experimental Approach
C57BL/6J male mice were given a standard diet (control) or a high fat–high sucrose diet (DIO) for 8 weeks. DIO mice were then treated with DIO alone, DIO with citrulline, DIO with atorvastatin or DIO with citrulline and atorvastatin (DIOcit–stat) for 3 weeks. Thereafter, body composition, glucose tolerance, insulin sensitivity and liver fat metabolism were measured.
Key Results
DIOcit–stat mice showed lower body weight, fat mass and epididymal fat depots compared with other DIO groups. Unlike other DIO groups, glucose tolerance and insulin sensitivity of DIOcit–stat, along with blood glucose and insulin concentrations in response to feeding, were restored to control values. Refeeding‐induced changes in liver lipogenic activity were also reduced in DIOcit–stat mice compared with those of DIO animals. This was associated with decreased gene expression of the transcription factor SREBP‐1, liver X receptor α, ChREBP and of target lipogenic enzymes in the liver of DIOcit–stat mice compared with those of other DIO groups.
Conclusions and Implications
The citrulline–atorvastatin combination prevented fat mass accumulation and maintained glucose homeostasis in DIO mice. Furthermore, it potentiated inhibition of hepatic de novo lipogenesis activity. This combination has potential for preservation of glucose homeostasis in patients receiving statin therapy.
Abbreviations
- ACC1 and Acc1
acetyl‐CoA carboxylase 1
- AMPKα
AMP‐activated protein kinase α
- ChREBP and Chrebp
carbohydrate‐responsive element‐binding protein
- FAS and Fasn
fatty acid synthase
- GPAM and Gpam
glycerol‐3‐phosphate acyltransferase
- LXRα and Lxrα
liver X receptor α
- RQ
respiratory quotient
- SCD1 and Scd1
stearoyl‐Coenzyme A desaturase 1
- SREBP‐1 and Srebf1
sterol regulatory element‐binding transcription factor 1
- VCO2
carbon dioxide production
- VO2
oxygen consumption
Tables of Links
| TARGETS |
|---|
| Enzymes a |
| Akt |
| AMPKα, AMP‐activated protein kinase α |
| Nuclear hormone receptors b |
| LXRα, liver X receptor α (NR1H3) |
| PPARα (NR1C1) |
| PPARγ (NR1C3) |
| LIGANDS |
|---|
| Arginine |
| Atorvastatin |
| Citrulline |
| Glucose |
| Insulin |
| L‐NAME |
These Tables list key protein targets and ligands in this article which are hyperlinked to corresponding entries in http://www.guidetopharmacology.org, the common portal for data from the IUPHAR/BPS Guide to PHARMACOLOGY (Pawson et al., 2014) and are permanently archived in the Concise Guide to PHARMACOLOGY 2013/14 ( abAlexander et al., 2013a, 2013b).
Introduction
Obesity is a major risk factor for metabolic diseases including type 2 diabetes and non‐alcoholic steatohepatitis. It has become a global public health priority because its prevalence has begun to rise worldwide. Today, between 15 and 30% of the population is obese, and over 45% of adults are overweight in industrialized countries (World Health Organization, 2014).
NO is a critical regulator of energy and lipid metabolism body composition and insulin sensitivity (Sansbury and Hill, 2014). NO synthesis plays a major role in the peripheral effects of insulin as it directly promotes insulin transport by vascular endothelial cells and insulin delivery to peripheral tissues (Wang et al., 2013). However, NO homeostasis is compromised during obesity. Its bioavailability is decreased in obese and diabetic patients (Higashi et al., 2001) and animal models (Kim et al., 2008). Furthermore, mouse models of partial or total endothelial NO synthase (eNOS) knockout exhibit insulin resistance and glucose intolerance but also visceral obesity and liver steatosis (Duplain et al., 2001; Cook et al., 2004; Schild et al., 2008). At the tissue level, dysregulation of NO production by liver endothelial cells exacerbates hepatic insulin resistance and several associated metabolic disorders, including liver steatosis (Tateya et al., 2011).
To restore NO synthesis, clinical data have shown that nutritional supplementation with arginine is effective in the short term (Bode‐Böger et al., 2003) but presents adverse effects in the longer term (Schulman et al., 2006). Furthermore, it is now known that citrulline supplementation is more efficient and more reliable than arginine. Citrulline is characterized by improved gastrointestinal tolerance (Grimble, 2007) and greater bioavailability (Moinard et al., 2008) than arginine. It induces a greater increase in the plasma concentration of arginine than arginine itself (Schwedhelm et al.; 2008) and it is a better precursor of NO than arginine (Tangphao et al., 1999). Finally, it is recognized for being safe. Several mechanisms may explain the improvement of NO synthesis with citrulline. First, citrulline inhibits the enzyme arginase, which metabolizes arginine to ornithine and urea and which is induced in diabetes (Kashyap et al., 2008). Second, citrulline increases the arginine/asymmetric dimethylarginine ratio, thus diminishing the inhibitory pressure of arginine/asymmetric dimethylarginine on eNOS (Schwedhelm et al., 2008). Third, arginine is subject to a splanchnic first pass process whereas citrulline is neither metabolized in the intestine nor taken up by the liver (Curis et al., 2005).
Citrulline is a non‐protein amino acid with antioxidant properties and is particularly present in watermelons. It is also synthesized in enterocytes. Several studies describe a modification of its circulating concentration in obesity and diabetes (Sailer et al., 2013; Zhou et al., 2013), but little information is currently available to understand the importance of its endogenous synthesis in the aetiology of metabolic disorders associated with obesity. Although citrulline is known to exert regulatory effects on lipid, energy and protein metabolisms (Faure et al., 2012; Faure et al., 2013; Joffin et al., 2014), few studies have examined the potential effects of citrulline in preventing insulin resistance and diabetes. In Zucker diabetic fatty rats, one study showed a 22% reduction in blood glucose after receiving watermelon juice (Wu et al., 2007). In humans, one 7‐day‐long study showed no effect of citrulline supplementation on fasting insulin in healthy adults (Thibault et al., 2011). Interestingly, combining citrulline with atorvastatin was recently shown to potentiate NO production in endothelial cells (Berthe et al., 2011). This was mediated through an increased bioavailability of arginine, due to citrulline, and to an enhanced activity of the NO‐generating enzyme eNOS because the statins, apart from their ability to decrease cholesterol synthesis, also increase eNOS expression and activity (Berthe et al., 2011).
Our aim was thus to investigate in vivo the benefits of combining citrulline to atorvastatin in a mouse model of diet‐induced obesity (DIO) known to develop glucose intolerance and insulin resistance within 8 to 10 weeks (Bonnard et al., 2008). The primary objective of our study was to explore the individual and combined effects of citrulline and atorvastatin on body weight and composition and on glucose tolerance and insulin resistance. Our secondary objective was to explore the individual and combined effects of citrulline and atorvastatin on liver fat metabolism, which is closely interrelated with glucose homeostasis (Bechmann et al. 2012).
Methods
Animals and experimental protocols
All animal care and experimental procedures complied with the guidelines formulated by the European Community for the use of experimental animals (L358‐86/609/EEc) and were approved by the local ethical committee (agreement no. A633‐239). INRA animal facilities were approved (C634514) by the French veterinary department. All studies involving animals are reported in accordance with the ARRIVE guidelines for reporting experiments involving animals (Kilkenny et al., 2010; McGrath et al., 2010). A total of 160 animals were used in the experiments described here.
Male C57BL/6J mice (5 weeks old) (Janvier Labs, France) were housed in individual cages, subjected to a 12 h light/dark cycle at a temperature of 22 ± 2°C. All animals had ad libitum access to food and water. After 1 week of acclimatization under the control diet (20% protein, 70% carbohydrates and 10% fat), 40 mice were maintained on the control diet for a further 12 weeks (control group). The remaining 120 mice (DIO groups) were fed a high fat–high sucrose diet (20% protein, 18% carbohydrates, 17% sucrose and 45% fat). During the last 3 weeks of the dietary intervention, DIO mice were randomized into four groups. Each group received either DIO alone (n = 40), or DIO enriched with citrulline (2.5 g∙kg−1; DIOcit, n = 20), atorvastatin (10 mg∙kg−1; DIOstat, n = 20) or the combination of citrulline (2.5 g∙kg−1) and atorvastatin (10 mg∙kg−1; DIOcit–stat, n = 40). This dose of 10 mg atorvastatin has been repeatedly shown to be effective on lipid metabolism in mice, especially in mouse models of inflammation (Chen et al., 2014a, b). In addition, our own work has demonstrated that 1 to 5 g∙kg−1∙day−1 citrulline is required in order to induce metabolic effects in rodents (Moinard et al., 2009; Faure et al., 2012, 2013).
Body weight and food intake were measured every 2 weeks. At the end of the experiment, most animals were examined after an overnight fast. Twenty animals from control, DIO and DIOcit–stat groups were used to explore the effect of refeeding. Briefly after an overnight fast, mice were refed (or not) with their diet during 2 h before killing.
Measurement of food intake: Mice were given ad libitum access to a known amount of pellets for 1 week. At the end of the test, leftover food was weighed, and mean daily food intake was calculated in g per day.
Indirect calorimetry method: Oxygen consumption (VO2) and carbon dioxide production (VCO2) were measured using a four‐chamber TSE systems PhenoMaster/LabMaster (Bad Homburg, Germany). Temperature was maintained at 28°C to reach the animals' thermoneutrality and the light was on from 08:00 to 20:00 h. System settings included a flow‐rate of 0.6 L∙min−1, a sample purge of 5 min and a measurement period of 5 min every 25 min. Sixteen hours prior to data collection, mice were placed in separate calorimetry chambers (each with a volume of 2.5 L), with free access to food and water. Then VO2 and VCO2 were monitored during 24 h while food was available ad libitum. Energy expenditure was calculated using Brouwer's equation (1965). The respiratory quotient (RQ) was calculated as the ratio of VCO2 to VO2. Daily energy expenditure and RQ were computed over the 24 h period.
Body composition determination: Fat and lean masses (g) were assessed in vivo in fasted mice (n = 5 per group) using the EchoMRI‐100 instrument (Echo Medical Systems LLC, Houston, USA).
Glucose homeostasis: Each group was divided into two subgroups for exploring either insulin sensitivity or glucose tolerance after 4 h of fasting. For insulin sensitivity assessment, basal blood glucose was measured in a drop of blood from the tail using a glucometer (SureStep, Life Line Screening, Independence, USA) and an insulin dose of 0.75 mUI∙g−1 was then injected i.p.. Blood glucose was measured after 15, 30, 45, 60 and 120 min. Insulin sensitivity was evaluated from the increase in blood glucose compared with basal glucose, which is the blood glucose area over the curve. To assess glucose tolerance, after basal blood glucose measurement, a dose of glucose (2 mg∙g−1) was injected i.p., and blood glucose was measured after 15, 30, 60 and 120 min. Glucose tolerance was evaluated from blood glucose area under the curve.
Plasma and tissue collection: Animals were anaesthetized with pentobarbital (90μg∙g−1, i.p. ). Blood was collected (EDTA as anticoagulant) and centrifuged, and plasma was aliquoted and frozen at −80°C. Liver, epidydimal adipose tissue and leg muscles (quadriceps + gastrocnemius + tibialis) were dissected and weighed. The liver was frozen in liquid nitrogen and kept at −80°C until subsequent analysis.
Plasma metabolites and hormones: Blood was collected in EDTA‐coated tubes. Insulin was assessed using an enzyme‐linked immunosorbent assay kit (Alpco Diagnostics, Salem, USA). Fasting glucose, triglycerides and free fatty acids were assessed using an automated system (Konelab 20, Kone, Helsinki, Finland). Reagents were obtained from Randox (Crumlin, UK) and ThermoElectron Corporation (Waltham, USA).
To assess plasma concentrations of amino acids, blood was collected into heparinized tubes. Plasma was then deproteinized with sulfosalicylic acid (10%), frozen and stored at −80°C. Plasma amino acids were separated and quantified by ion‐exchange chromatography with spectrophotometric detection after ninhydrin derivatization using an AminoTac JLC‐500/V AA analyser (Jeol, Croissy‐sur‐Seine, France).
Cell culture
Human HuH7 hepatocarcinoma cells (from Creative Bioarray, Shirley, NY, USA) were grown at 37°C in a 5% CO2 atmosphere in a medium composed of DMEM containing 1 g∙L−1 glucose and supplemented with 10% fetal calf serum, 1% glutamine and 1% antibiotics (5 U∙mL−1 penicillin and 50 µg∙mL−1 streptomycin). At ~70% confluence, cells were incubated for 24 h with a medium enriched with citrulline (5 mM) and/or atorvastatin (0.02 or 0.05 mM) and/or the NOS inhibitor, l‐NAME (0.5 mM); DMSO concentration was the same under all conditions. Thereafter, cells were lysed at 4°C in a lysis buffer (50 mM HEPES pH 7.4, 150 mM NaCl, 10 mM EDTA, 10 mM NaPPi, 25 mM β‐glycerophosphate, 100 mM NaF, 2 mM Na3VO4, 10% glycerol, 1% Triton X‐100 and 0.5% of a protease‐inhibitor cocktail) for further Western blotting analyses. For the exploration of insulin signalling, DMEM was depleted of fetal calf serum for 3 h; cells were then incubated with 10−7 M insulin for 15 min and lysed as described above.
Cell and liver metabolic adaptations to diets
Quantification of lipid content: Lipids from livers were extracted according to Folch and coworkers (Folch et al., 1957). Triglyceride content was assessed colorimetrically using the Triglyceride Colorimetric Assay kit (Cayman, Ann Arbor, USA).
Real‐time quantitative RT‐PCR analysis: Total RNA was extracted with Tri‐Reagent® Solution (Sigma). Target RNA levels were measured by reverse transcriptase followed by real‐time PCR using a Rotor‐Gene Q system (Qiagen, Courtaboeuf, France). A standard curve was generated from a mixture of all native cDNA and serial dilutions. Hprt was used as a reference gene and results are expressed relative to Hprt expression. Primer sequences are shown in Table 1.
Immunoblotting: Livers were homogenized in the ice‐cold lysis buffer described above. After centrifugation, protein content of supernatants was determined using MicroBCA™ Protein assay kit (Thermo Scientific, Rockford, USA). Lysate proteins were solubilized in 4X Laemmli's buffer, boiled at 95°C for 5 min, resolved by SDS‐PAGE and transferred to PVDF membranes (1 h, 100 V) (Merck Millipore, Darmstadt, Germany). Membranes were blocked for 1 h in 5% BSA‐TBS 50 mM Tris‐Cl, 150 mM NaCl, pH 7.6/Tween 0.01% and then incubated with the specific primary antibodies. Signal was detected with a horseradish peroxidase‐conjugated secondary antibody and revealed with an enhanced chemiluminescence system (Pierce, Thermo Scientific). Results are expressed as a ratio of total protein or α‐tubulin expression. Adjustment was made to internal control on each gel and to controls in HuH7 cells and DIOcit–stat in mice.
Table 1.
Quantitative reverse transcription PCR primers
| Gene name | Forward primer | Reverse primer |
|---|---|---|
| Acc1 | ACCTGGTGGAGTGGCTGGAG | ATGGCGACTTCTGGGTTGGC |
| Chrebp | GGAGAGCCTGGTACATTCAG | GCTTCCAGTAATTACCCTCCAG |
| eNOS | GAGAGCGAGCTGGTGTTTG | CTGTGATGGCTGAACGAAGA |
| Fasn | GGCTGCTGTTGGAAGTCAG | TGCCTCTGAACCACTCACAC |
| Gpam | AGTTCCCGAGTCTGAGTACC | GTCTCTTTGAAAACCCCGATG |
| Hprt | TTGCTGACCTGCTGGATTAC | AGTTGAGAGATCATCTCCAC |
| Lxrα | GGAGTGTCGACTTCGCAAAT | GCAGGACTTGAGGAGGTGAG |
| Pepck | CCCGAAGGCAAGAAGAAATA | CGTTTTCTGGGTTGATAGCC |
| Pgc‐1α | GAAGTGGTGTAGCGACCAATC | AATGAGGGCAATCCGTCTTCA |
| PPAR α | TGTGGCTGCTATAATTTGCTGTGG | CCCTCCTGCAACTTCTCAATGTAG |
| PPAR γ | CAAGAATACCAAAGTGCGATCAA | GAGCTGGGTCTTTTCAGAATAATAAG |
| Scd1 | CCTCCTGCAAGCTCTACACC | CAGCCGTGCCTTGTAAGTTC |
| Srebf1 | CACCACCCGTACAGCTCAG | GTGGCTGCTGAGTGTTTCCT |
Hprt, hypoxanthine guanine phosphoribosyl transferase; Pepck; phosphoenolpyruvate carboxykinase; Pgc‐1α, peroxisome proliferator‐activated receptor gamma coactivator 1‐α.
Data analyses
All data are presented as means ± SEM. A one‐way anova was performed to test the effect of the experimental conditions using the Statview software (SAS Institute, USA). When a significant effect was detected at p < 0.05, Fisher's test was used to analyse pairwise differences.
Materials
DMEM was from Sigma (St Louis, USA). Fetal calf serum and heat‐inactivated horse serum were purchased from PAN‐Biotech GmbH (Aidenbach, Germany). Antibiotics were supplied by Gibco‐Invitrogen (Carlsbad, USA). Atorvastatin was a generic product from Pfizer, NY, USA. Insulin Actrapid® was from Novo Nordisk (Bagsvaerd, Denmark). Primary antibodies were against phospho(Ser473)‐Akt (Cell Signaling, Danvers, USA, #9271), total‐Akt (Cell Signaling, #9272), phospho(Thr172)‐AMP‐activated protein kinase α (AMPKα) (Cell Signaling, #2531), total‐AMPKα (Cell Signaling, #2532), sterol regulatory element‐binding transcription factor 1 (SREBP‐1) (Santa Cruz Biotechnology, Dallas, USA, #sc‐8984) and α‐tubulin (Sigma, #T5168). Appropriate secondary antibodies were obtained from Cell Signaling and Dako (Glostrup, Denmark). Other chemicals used were of the highest grade commercially available. Citrulline was a gift from Citrage© (Créteil, France).
Results
Otherwise stated, results presented below apply to fasted conditions.
Citrulline and atorvastatin combination alters plasma amino acid concentrations
Citrulline supplementation was accompanied by a specific increase in plasma citrulline, arginine, ornithine and proline concentrations. However, these modifications disappeared when treatment with atorvastatin was combined with citrulline (Table 2). In addition, the plasma concentrations of branched‐chain amino acids (valine, leucine and isoleucine) and essential amino acids (phenylalanine and threonine) were decreased in the four DIO groups compared with controls (Table 2).
Table 2.
Plasma amino acid concentration (µmol L−1)
| Control | DIO | DIOcit–stat | DIOstat | DIOcit | |
|---|---|---|---|---|---|
| Citrulline and related amino acids | |||||
| Citrulline | 49 ± 2 | 49 ± 3 | 51 ± 6 | 46 ± 2 | 84 ± 19* |
| Arginine | 89 ± 5 | 94 ± 4 | 96 ± 11 | 94 ± 2 | 134 ± 22* |
| Ornithine | 45 ± 4 | 35 ± 2* | 31 ± 2* | 32 ± 1* | 52 ± 7$ |
| Glutamine | 538 ± 24 | 521 ± 18 | 481 ± 17 | 510 ± 22 | 472 ± 21 |
| Proline | 64 ± 3 | 62 ± 6 | 53 ± 3 | 53 ± 3 | 87 ± 15* |
| Branched‐chain amino acids | |||||
| Valine | 242 ± 20 | 180 ± 8* | 145 ± 7* | 165 ± 5* | 195 ± 11* |
| Isoleucine | 100 ± 6 | 80 ± 4* | 66 ± 4* | 79 ± 4* | 78 ± 5* |
| Leucine | 185 ± 14 | 137 ± 7* | 111 ± 9* | 136 ± 7* | 133 ± 10* |
| Other essential amino acids | |||||
| Phenylalanine | 78 ± 4 | 66 ± 3.6* | 59 ± 3* | 63 ± 2.2* | 67 ± 3.1* |
| Methionine | 54 ± 3 | 53 ± 4 | 43 ± 2 | 46 ± 2 | 56 ± 5 |
| Lysine | 241 ± 7 | 251 ± 14 | 214 ± 9 | 230 ± 8 | 256 ± 18 |
| Threonine | 182 ± 10 | 168 ± 13 | 144 ± 8* | 156 ± 8 | 191 ± 15* |
| Histidine | 61 ± 3 | 57 ± 3 | 50 ± 2 | 55 ± 2 | 60 ± 4 |
| Other non‐essential amino acidsA | |||||
| Serine | 102 ± 4 | 103 ± 7 | 92 ± 4 | 93 ± 3 | 126 ± 17* |
| Asparagine | 38 ± 2 | 35 ± 2 | 31 ± 1* | 33 ± 1.4y | 39 ± 2 |
Results are means ± SEM (n = 10 per group). Dietary interventions: standard diet (control), high fat–high sucrose diet (DIO) and DIO enriched in citrulline (2.5 g∙kg−1) (DIOcit), atorvastatin (10 mg∙kg−1) (DIOstat) or citrulline and atorvastatin (DIOcit–stat).
Only non‐essential amino acids significantly altered by the dietary interventions are shown.
P < 0.05, significantly different from controls;
P < 0.05, significantly different from control and other DIO groups.
Citrulline and atorvastatin combination prevents weight gain but did not alter daily energy balance
BW and body composition: Before the pharmaco‐nutritional intervention started,i.e. after 8 weeks of control of DIO diet, the DIO mice gained 8% more body weight than controls (p < 0.01, Figure 1A). After 4 weeks of treatment, the weight of DIOcit–stat mice was significantly lower than those of the other DIO groups whereas it was not significantly different from the controls (p < 0.05, Figure 1A). Weights of DIO, DIOcit and DIOstat animals was significantly higher than controls (p < 0.001, Figure 1A). EchoMRI showed that differences in weight were linked to differences in fat mass, lean mass being similar between the five groups (Table 3). Fat mass of DIOcit–stat mice was 22% lower than other DIO groups (p < 0.05) but remained 46% higher than controls (p < 0.05, Table 3). These results were confirmed by weighing epidydimal fat depots at the end of the experiment (Figure 1B, Table 3).
Daily energy balance was similar between DIOcit–stat and other DIO groups. Daily food intake averaged 3 g per day in the five groups, which represents a mean intake of 56 and 78 kJ∙day−1 for the control and DIO groups respectively. Furthermore, daily energy expenditure of DIOcit–stat mice was similar to other DIO groups but was 13% lower than controls because of a reduced spontaneous physical activity (p < 0.01, Table 3). Finally, daily RQ of DIOcit–stat mice was similar to other DIO groups and was significantly lower than controls (p < 0.0001, Table 3).
Figure 1.
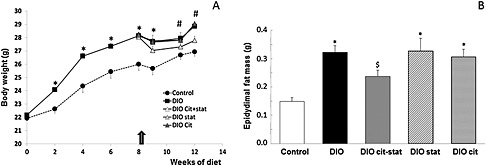
(A) Changes in body weight during the dietary intervention. The arrow indicates the beginning of the pharmaco‐nutritional intervention with citrulline (cit) and/or atorvastatin (stat) in the DIO mice. (B) Differences in epidydimal fat mass at the end of the protocol. * P < 0.05, significantly different from controls; # P < 0.05, significantly different from controls and DIOcit–stat group; $ P < 0.05, significantly different from control and other DIO groups.
Table 3.
Characterization of the animals according to the dietary intervention
| Control | DIO | DIOcit–stat | DIOstat | DIOcit | |
|---|---|---|---|---|---|
| Body composition (otherwise stated, n = 5 per group) | |||||
| Lean mass (g)A | 22.85 ± 0.85 | 24.07 ± 0.65 | 23.58 ± 0.59 | 22.13 ± 0.47 | 23.10 ± 0.73 |
| Fat mass (g)A | 1.17 ± 0.11 | 2.51 ± 0.17* | 1.79 ± 0.12$ | 2.18 ± 0.19* | 2.34 ± 0.24* |
| Liver (mg)B | 853 ± 39 | 972 ± 34 | 925 ± 12 | 1000 ± 72 | 1019 ± 51 |
| Leg muscle (mg)B | 743 ± 29 | 752 ± 23 | 762 ± 4 | 728 ± 17 | 759 ± 7 |
| Epidydimal fat (mg)B (n = 20 per group) | 149 ± 14 | 333 ± 97* | 254 ± 26$ | 337 ± 46* | 313 ± 28* |
| Calorimetric chamber measurements (n = 4 per group) | |||||
| Daily EE (kJ g−1 LM−1 day−1) | 1.31 ± 0.03 | 1.10 ± 0.06* | 1.14 ± 0.01* | 1.18 ± 0.03* | 1.20 ± 0.03* |
| Daily RQ | 0.97 ± 0.01 | 0.82 ± 0.03* | 0.86 ± 0.01* | 0.82 ± 0.01* | 0.85 ± 0.01* |
| Plasma concentrations (n = 10 per group) | |||||
| Triglycerides (g L−1) | 0.40 ± 0.02 | 0.52 ± 0.04$ | 0.42 ± 0.02 | 0.45 ± 0.01 | 0.44 ± 0.01 |
| Free fatty acids (mM) | 0.53 ± 0.02 | 0.71 ± 0.03* | 0.57 ± 0.05 | 0.63 ± 0.02* | 0.64 ± 0.01* |
| Glucose (g L−1) | 1.31 ± 0.05 | 1.70 ± 0.10$ | 1.28 ± 0.05 | 1.32 ± 0.05 | 1.47 ± 0.10 |
| Insulin (ng mL−1) | 0.50 ± 0.03 | 1.03 ± 0.12$ | 0.63 ± 0.04 | 0.53 ± 0.03 | 0.48 ± 0.03 |
Results are means ± SEM. Dietary interventions: standard diet (control), high fat–high sucrose diet (DIO), and DIO enriched in citrulline (2.5 g∙kg−1) (DIOcit), atorvastatin (10 mg∙kg−1) (DIOstat) or citrulline and atorvastatin (DIOcit–stat). Leg muscle mass is the sum of the two tibialis, soleus, gastrocnemius and quadriceps muscle mass; Daily EE, energy expenditure measured over 24 h; Daily RQ, respiratory quotient measured over 24 h; LM, lean mass.
Measured using EchoMRI;
Measured at death.
P < 0.05, significantly different from controls;
P < 0.05, significantly different from control and other DIO groups.
Citrulline and atorvastatin combination improves glucose homeostasis in vivo and in vitro
Plasma metabolites and hormones: Fasting glucose, insulin, triglycerides and free fatty acid plasma concentrations of DIOcit–stat animals were significantly lower than DIO animals (p < 0.05, Table 3). In addition, they were not significantly different from controls and from DIOcit and DIOstat groups (Table 3).
In vivo, DIOcit–stat was the only intervention that improved glucose tolerance and insulin sensitivity in comparison with that of DIO and DIOcit (p < 0.05) and maintained them at control values (Figure 2). To support the improved glucose homeostasis in response to the combined supplementation, we explored blood glucose and insulin concentrations 2 h after refeeding. Blood glucose and insulin concentrations in fed DIOcit–stat mice were significantly lower than in DIO (p < 0.05) and were similar to controls (Figure 3A and B). These results suggested an improved inhibition of hepatic gluconeogenesis in response to feeding. To support this hypothesis, the hepatic gene expression of phosphoenolpyruvate carboxykinase, a rate‐controlling step of gluconeogenesis, was significantly down‐regulated 2 h after refeeding in DIOcit–stat and in control mice (p < 0.05, Figure 3C). This down‐regulation was not observed in DIO animals, which exhibited no significant alteration of phosphoenolpyruvate carboxykinase gene expression after refeeding (Figure 3C).
In vitro, the effects of citrulline and atorvastatin on the insulin signalling pathway were examined in HuH7 cells using the ratio tested in the preclinical study, that is, using citrulline 5 mM and atorvastatin 0.02 mM. Whereas citrulline tended to reduce the insulin‐induced Akt phosphorylation compared with that of controls (p > 0.10), atorvastatin significantly decreased the insulin‐induced Akt phosphorylation compared with that of controls (p < 0.05, Figure 3D). Interestingly, combining citrulline with atorvastatin significantly increased the insulin‐induced Akt phosphorylation compared with that of citrulline and atorvastatin alone (p < 0.05), thus restoring Akt phosphorylation to control values (Figure 3D).
Figure 2.
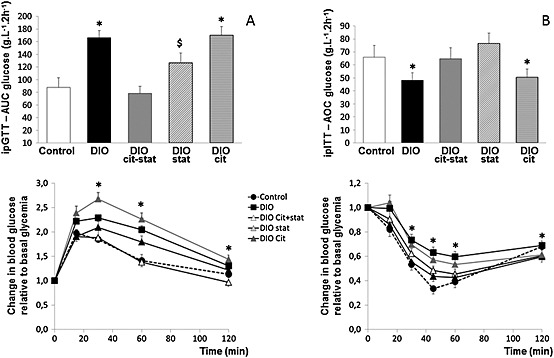
(A) Glucose tolerance [intraperitoneal glucose tolerance test (ipGTT)] and glycemic response to ipGTT, and (B) insulin sensitivity [intraperitoneal insulin sensitivity tolerance test (ipITT)] and glycemic responses to ipITT in diet‐induced obese (DIO) mice treated or not with citrulline (cit) and/or atorvastatin (stat) compared with control lean mice. Glycemic responses are expressed relative to basal blood glucose. * P < 0.05, significantly different from controls; $ P < 0.05, significantly different from DIOcit–stat group.
Figure 3.
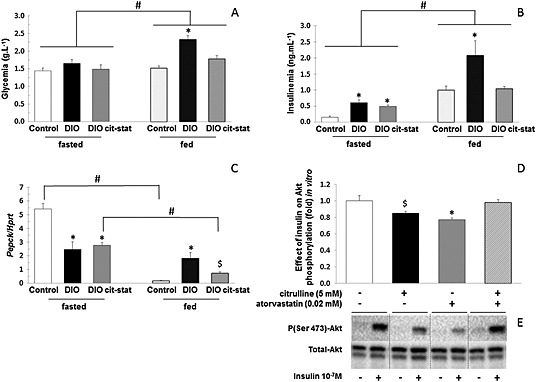
(A) Glycaemia and (B) insulinaemia in fasted and 2 h refed diet‐induced obese (DIO) mice treated or not with citrulline (cit) and atorvastatin (stat) and in control lean mice. (C) phosphoenolpyruvate carboxykinase (PEPCK) gene expression in liver of fasted and 2 h refed DIO mice treated or not with citrulline (cit) and/or atorvastatin (stat) and in control lean mice. (D) Impact of citrulline, atorvastatin and combination of the two on insulin‐induced changes in phospho(Ser473)‐Akt/total Akt in human HuH7 hepatocarcinoma cells and (E) related Western blot images. For A–C: * P < 0.05, significantly different from controls; # P < 0.05, significantly different fasted conditions; $ P < 0.05, significantly different from control and DIO groups. For D: *P < 0.05, significantly different from controls and citrulline–atorvastatin combination; $ P < 0.05, significantly different from citrulline–atorvastatin combination. HPRT, hypoxanthine guanine phosphoribosyl transferase.
Citrulline and atorvastatin combination reduces the lipogenic activity in the liver through AMPKα activation and down‐regulation of SREBP‐1
The triglycerides content of liver was not significantly different between groups, particularly between DIOcit–stat and DIO, although DIOcit–stat was close to control values (Figure 4A). However, in response to refeeding, the increase in liver triglyceride content was 27% lower in DIOcit–stat compared with DIO (p < 0.05), but still 41% higher than in controls (p < 0.05, Figure 4B).
AMPK is a cellular energy sensor that, among its many actions, integrates diverse physiological signals to restore energy balance. In particular, it suppresses SREBP‐1 cleavage and nuclear translocation and represses SREBP‐1 target gene expression leading to reduced lipogenesis and lipid accumulation in hepatocytes (Li et al., 2011). In vivo, hepatic AMPKα phosphorylation was significantly higher in DIOcit–stat than in DIO (p < 0.05, Figure 4D), DIOcit and DIOstat animals being intermediary (p > 0.10, Figure 4B). In addition, AMPKα phosphorylation was similar between DIOcit–stat and controls (Figure 4D).In vitro, studies with HuH7 cells showed that citrulline, like atorvastatin (Sun et al., 2006), activated AMPKα (Figure 5A) and decreased SREBP‐1 protein content (Figure 5B). Yet at the ratio used in the preclinical study (citrulline 5 mM/atorvastatin 0.02 mM), citrulline did not further potentiate the atorvastatin‐induced activation of AMPKα and decrease in SREBP‐1 protein content (data not shown). Treatment with l‐NAME, a NOS inhibitor, tended to reduce citrulline‐induced AMPKα phosphorylation and significantly reduced atorvastatin‐induced activation of AMPKα (Figure 5C).
Figure 4.
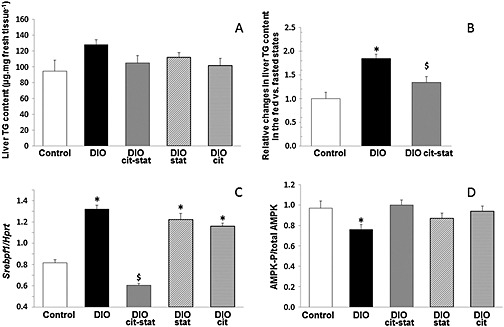
(A) Triglycerides (TG) content, (B) relative changes in liver TG content in 2 h refed mice compared with overnight fasted animals, (C) SREBf1 mRNA content and (D) phospho(Thr172)‐AMPKα/total AMPKα, in livers of DIO mice treated or not with citrulline (cit) and/or atorvastatin (stat) and compared with control lean mice. * P < 0.05, significantly different from controls; $ P < 0.05, significantly different from controls and other DIO groups. Hprt, hypoxanthine guanine phosphoribosyl transferase.
Figure 5.
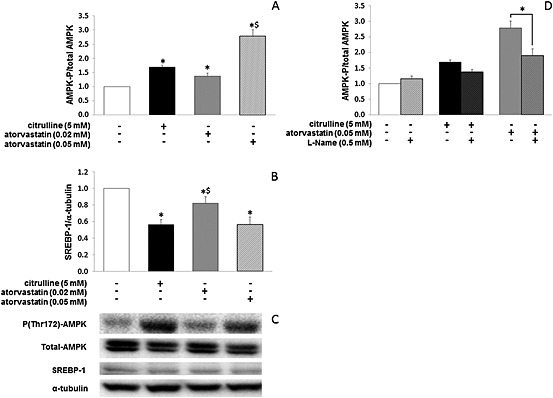
Citrulline and atorvastatin‐induced changes in (A) phospho(Thr172)‐AMPKα/total AMPKα and (B) SREBP‐1 protein expression in human HuH7 hepatocarcinoma cells. (C) Western blot images of phospho(Thr172)‐AMPKα, total AMPKα and SREBP‐1 protein expression from (A) and (B). (D) l‐NAME, a NOS inhibitor, reduces citrulline and atorvastatin‐induced changes in phospho(Thr172)‐AMPKα/total AMPKα. * P < 0.05, significantly different from controls; $ P < 0.05, significantly different from control and other treated groups.
We then analysed the gene expression of SREBP‐1 and of major nuclear and transcription factors involved in the regulation of hepatic lipid metabolism. Hepatic Srebf1 (Figure 4C) and liver X receptor α (Lxrα) (Table 4) mRNA content was significantly lower in DIOcit–stat compared with all other groups, including controls (p < 0.05). Furthermore, the mRNA for the carbohydrate‐responsive element‐binding protein (Chrebp) was ~42% lower in DIOcit–stat compared with other DIO groups (p < 0.01) and reached control values (Table 4). Regarding the gene expression of other regulators of hepatic lipid metabolism, PPARα mRNA content was similar between DIOcit–stat, DIOstat and controls, whereas that it was almost twofold higher in DIO and DIOcit groups compared with that of controls (p < 0.01, Table 4). PPARγ mRNA content of DIOcit–stat was 44 to 62% lower than other DIO groups (p < 0.05) and was similar to controls (Table 4). Finally, PPARγ coactivator1‐α gene expression was significantly reduced in DIOcit–stat, as in DIO and DIOstat, in comparison to controls and DIOcit (−28%, p < 0.05, Table 4).
Table 4.
mRNA content of major proteins involved in the regulation of liver de novo lipogenesis
| Control | DIO | DIOcit–stat | DIOstat | DIOcit | |
|---|---|---|---|---|---|
| Lxrα | 0.95 ± 0.14 | 1.37 ± 0.13* | 0.61 ± 0.08$ | 1.26 ± 0.11 | 1.08 ± 0.12 |
| Chrebp | 0.98 ± 0.15 | 1.73 ± 0.26* | 0.99 ± 0.15 | 1.68 ± 0.19* | 1.72 ± 0.17* |
| PPAR α | 0.92 ± 0.09 | 1.32 ± 0.15 | 0.67 ± 0.10* | 0.78 ± 0.10* | 1.41 ± 0.18 |
| Pgc‐1α | 1.37 ± 0.20 | 1.02 ± 0.12* | 0.98 ± 0.08* | 0.81 ± 0.07* | 1.55 ± 0.25 |
| PPAR γ | 0.73 ± 0.09 | 1.31 ± 0.27* | 0.60 ± 0.06# | 1.08 ± 0.11 | 1.16 ± 0.11* |
| Acc1 | 1.07 ± 0.10 | 0.92 ± 0.08* | 0.68 ± 0.03$ | 1.41 ± 0.14 | 1.29 ± 0.07 |
| Fasn | 1.83 ± 0.24 | 1.21 ± 0.10* | 0.71 ± 0.06$ | 1.18 ± 0.11* | 1.14 ± 0.08* |
| Scd1 | 1.64 ± 0.21 | 1.80 ± 0.44 | 0.36 ± 0.03$ | 0.86 ± 0.14 | 1.02 ± 0.13 |
| Gpam | 1.13 ± 0.11 | 1.14 ± 0.12 | 1.02 ± 0.16 | 1.15 ± 0.11 | 1.23 ± 0.07 |
| eNOS | 1.60 ± 0.21 | 1.14 ± 0.11* | 0.96 ± 0.09* | 0.91 ± 0.12* | 0.99 ± 0.10* |
Pgc‐1α, peroxisome proliferator‐activated receptor gamma coactivator 1‐α.
Results are expressed relative to Hprt gene expression (mean ± SEM, n = 10 per group). Dietary interventions: standard diet (control), high fat–high sucrose diet (DIO) and DIO enriched in citrulline (2.5 g∙kg−1) (DIOcit), atorvastatin (10 mg∙kg−1) (DIOstat) or citrulline and atorvastatin (DIOcit–stat).
P < 0.05, significantly different from controls;
P < 0.05, significantly different from control and other DIO groups.
P < 0.05, significantly different from other DIO groups.
In response to refeeding, Srebf1 mRNA content was not altered in DIOcit–stat animals contrasting with DIO and control mice (Table 5). By contrast, Lxrα, Chrebp, PPARγ coactivator1‐α, PPAR α and PPAR γ were similarly altered in DIOcit–stat, DIO and controls (Table 5).
Table 5.
Impact of refeeding on mRNA content of major proteins involved in the regulation of liver de novo lipogenesis
| Control | DIO | DIOcit–stat | |
|---|---|---|---|
| Srebf1 | 4.54 ± 0.95* | 0.60 ± 0.09#, * | 0.90 ± 0.09$ |
| Lxrα | 1.37 ± 0.17 | 0.98 ± 0.17 | 1.08 ± 0.13 |
| Chrebp | 0.84 ± 0.12 | 0.69 ± 0.07* | 0.81 ± 0.07 |
| PPAR α | 0.33 ± 0.05* | 0.53 ± 0.09* | 0.46 ± 0.04* |
| Pgc‐1α | 0.48 ± 0.05* | 0.41 ± 0.07* | 0.46 ± 0.10* |
| PPAR γ | 0.96 ± 0.21 | 0.70 ± 0.14 | 0.86 ± 0.12 |
| Fasn | 2.96 ± 0.99* | 1.07 ± 0.08# | 2.18 ± 0.32* |
| Acc1 | 3.03 ± 0.93* | 1.12 ± 0.21 | 1.61 ± 0.27 * |
| Scd1 | 0.48 ± 0.07* | 0.81 ± 0.23 | 1.03 ± 0.34 |
| Gpam | 1.30 ± 0.07 | 0.84 ± 0.08# | 0.75 ± 0.03#* |
| eNOS | 0.89 ± 0.15 | 1.10 ± 0.10 | 1.14 ± 0.22 |
Hprt, hypoxanthine guanine phosphoribosyl transferase; Pgc‐1α, peroxisome proliferator‐activated receptor gamma coactivator 1‐α.
Results are expressed relative to fasted values (mean ± SEM; n = 5 to 7 samples per group). Dietary interventions: standard diet (control), high fat–high sucrose diet (DIO) and DIO enriched in citrulline (2.5 g∙kg−1 body weight) and atorvastatin (10 mg∙kg−1 body weight) (DIOcit–stat).
P < 0.05, significantly different from fasted values;
P < 0.05, significantly different from control and DIO;
P < 0.05, significantly different from control.
Fatty acid synthase (FAS), acetyl‐CoA carboxylase‐1 (ACC1), stearoyl‐CoA desaturase‐1 (SCD1) and glycerol‐3‐phosphate acyltransferase (GPAM) are key lipogenic enzymes. They are established targets of the LXRα/SREBP‐1 pathway but also of ChREBP and PPARs (Poupeau and Postic, 2011). As expected from alterations in Srebf1 gene expression, Acc1, Fasn and Scd1 mRNA content was significantly lower in DIOcit–stat compared with that of all other groups, including controls (p < 0.05, Table 4). By contrast, Gpam gene expression was similar between all conditions (Table 4). Furthermore, in response to refeeding, Fasn and Acc1 mRNA contents were enhanced in refed DIOcit–stat as in controls (p < 0.05), whereas Scd1 and Gpam gene expression were differently altered between the two groups (Table 5).
Discussion
We aimed at exploring whether the combination of nutrition and pharmacology could have a synergistic effect on major metabolic traits associated with obesity and risk of type 2 diabetes. In a murine model of DIO, the combination of citrulline with atorvastatin synergistically improved glucose homeostasis in comparison with DIO groups receiving each compound alone. Furthermore, the combination also synergistically affected fat metabolism. This was characterized by a lower fat accumulation, notably in epidydimal depots, and a marked inhibition of hepatic Srebf1 gene expression and de novo lipogenesis activity in DIOcit–stat mice compared with other DIO groups.
Our results could be of particular value for patients treated with statins, because long‐term treatment with statins has been associated with several side‐effects including alteration of glucose homeostasis and increased risk of developing type 2 diabetes (Food and Drug Administration, 2012). In this respect, the relevancy of our results is strengthened by the fact that they were obtained in a model of DIO. Indeed, the risks for developing diabetes with statins are higher in individuals expressing signs of cardiometabolic disorders compared with those without such risk factors (Waters et al., 2011). Because the ability of statins to decrease major cardiovascular events and mortality outweighs the risk of incident diabetes, the American College of Cardiology/American Heart Association Task Force has recommended not to change clinical practice and not to discontinue statin treatment (Stone et al., 2014). Therefore, it is clearly necessary to develop strategies to minimize the negative metabolic effects of statins and to maintain glucose homeostasis, especially in pre‐diabetic patients and in patients at high cardiometabolic risk.
The improved glucose tolerance we observed in response to the pharmaco‐nutritional intervention is likely to involve a combination of several beneficial adaptations. In vivo and in vitro data supported a synergistic effect of the pharmaco‐nutritional combination on the improvement of liver insulin sensitivity. These adaptations were further supported by the favourable impact of the product combination on fat mass, especially on the intra‐abdominal fat depots, because a high level of visceral adipose tissue is associated in humans with a deterioration of glucose tolerance (Després, 1993). Another mechanism of citrulline–atorvastatin action may also involve an improved hepatic lipid metabolism, although it is still debated whether the correlation between hepatic de novo lipogenesis, lipid accumulation and insulin resistance is due to a causal relationship (Farese et al., 2012). Data showed in the liver that the combination of citrulline and atorvastatin specifically blunted the DIO‐induced expression of SREBP‐1 and of its downstream targets. In agreement with Li et al. (2011), our in vivo and in vitro data suggested that SREBP‐1 down‐regulation was mediated by the activation of AMPKα. These synergistic effects of the combination were unexpected. Indeed, the effects of statins on liver lipid metabolism has been little investigated. In rats fed with fructose (Roglans et al., 2002; Rodríguez‐Calvo et al., 2009) or high fat (Ji et al., 2011) to induce hepatic de novo lipogenesis, a high dose of atorvastatin (30 mg∙kg−1), but not a low dose (5 mg∙kg−1), significantly reduced the liver triglyceride content. Because animals from the present study received a low dose of atorvastatin, our data suggest that citrulline is required to increase the hepatic adaptations during statin therapy.
Data are also scarce concerning the effects of statins on adipose tissue mass. Aguirre et al. (2013) showed in obese Zucker rats that subcutaneous adipose tissue was significantly increased after treatment with atorvastatin. By contrast, citrulline supplementation was shown to reduce visceral fat depots in old rats (Moinard et al., 2009). Experiments on visceral adipose tissue explants from overweight rats showed that citrulline directly induced phosphorylation of hormone‐sensitive lipase and downregulated glyceroneogenesis, allowing an increased fatty acid release from the adipose tissue (Joffin et al., 2014). Surprisingly, these effects were not observed in the present study because mice receiving citrulline alone did not show any reduction in fat mass in comparison with DIO mice. The direct effect of citrulline on adipose tissue fatty acid release may partly explain why in our model, fat mass was significantly reduced in DIOcit–stat animals whereas daily energy balance was not significantly altered. However, the combination of citrulline and atorvastatin appears necessary to attain a significant reduction in fat mass accretion under DIO conditions.
We hypothesized that the synergistic effects of the combination involved an improved production of NO by eNOS as described by Berthe et al. (2011) in endothelial cells. In the present study, the metabolic adaptations induced in vivo by the combination of citrulline and atorvastatin were consistent with those observed on glucose homeostasis, visceral obesity and liver steatosis, when NO production was enhanced (Duplain et al., 2001; Cook et al., 2004; Schild et al., 2008). Our observations on adipose tissue mass are also in agreement with those obtained in overweight rats (Joffin et al., 2014). In that study, citrulline stimulated visceral adipose tissue lipolysis, and the effect was abolished by pretreatment of explants with l‐NAME (Joffin et al., 2014). Furthermore, our observations on plasma amino acid concentrations showed that atorvastatin interferes with citrulline and arginine metabolism, thus corroborating a possible increase in NO production. Finally, NO is known to induce AMPKα phosphorylation in several tissues (Cardaci et al., 2012; Abudukadier et al., 2013). In vitro using HuH7 cells, we confirmed that atorvastatin induced AMPKα phosphorylation (Sun et al., 2006) and showed for the first time that citrulline can also activate this kinase. Experiments using l‐NAME also suggest that NO may mediate part of the effect of citrulline and atorvastatin on AMPK phosphorylation. These observations suggest but do not demonstrate the potential involvement of NO in the metabolic adaptations described in vivo in the present study. Thus, a limitation of our work lies in the fact that we did not directly look at the involvement of NO in the in vivo metabolic adaptations. Additional researches, using NOS inhibitors or through the infusion of citrulline and arginine labelled with stable isotopes (Castillo et al. 1996; Fitzgerald et al. 2007), are required to gain insight into the effect of the treatment on NO synthesis at the whole‐body and tissue levels.
In conclusion, combination treatment with citrulline and atorvastatin preserved glucose homeostasis and prevented fat mass accumulation in a mouse model of DIO. Furthermore, it potentiated the inhibition of SREBP‐1 mediated de novo lipogenesis activity in the liver, partly by up‐regulating phosphorylation of AMPKα. Citrulline–atorvastatin combinations are thus a promising treatment for preventing the alteration of glucose homeostasis and minimizing the risk of developing type 2 diabetes in patients treated with statins and presenting cardiometabolic risk factors.
Author contributions
F. C., G. C., L. C., C. M. and B. M. contributed to the study conception and design, acquisition of data or analysis and interpretation of data, to drafting the article or revising it critically, and gave final approval of the version to be published. J.‐P. B. contributed to the article revision. E. P., J.‐P. R., S. L. P., C. D. and C. J. contributed to the study conception, acquisition of data and analysis and interpretation of data.
Conflict of interest
Christophe Moinard, Luc Cynober, Jean‐Pascal de Bandt and Servane Le Plenier are shareholders of CITRAGE© (Créteil, France), suppliers of citrulline.
Acknowledgements
The authors thank Etienne Lefai for his scientific advice and Brigitte Laillet, Florence Blandel and Nadia Bendridi for their skillful technical help. The work was supported by the authors' institutions, INRA and Paris‐Descartes University.
Capel, F. , Chabrier, G. , Pitois, E. , Rigaudière, J.‐P. , Plenier, S. L. , Durand, C. , Jouve, C. , de Bandt, J.‐P. , Cynober, L. , Moinard, C. , and Morio, B. (2015) Combining citrulline with atorvastatin preserves glucose homeostasis in a murine model of diet‐induced obesity. British Journal of Pharmacology, 172: 4996–5008. doi: 10.1111/bph.13269.
References
- Abudukadier A, Fujita Y, Obara A, Ohashi A, Fukushima T, Sato Y et al. (2013). Tetrahydrobiopterin has a glucose‐lowering effect by suppressing hepatic gluconeogenesis in an endothelial nitric oxide synthase‐dependent manner in diabetic mice. Diabetes 62: 3033–3043. [DOI] [PMC free article] [PubMed] [Google Scholar]
- Aguirre L, Hijona E, Macarulla MT, Gracia A, Larrechi I, Bujanda L et al. (2013). Several statins increase body and liver fat accumulation in a model of metabolic syndrome. J Physiol Pharmacol 64: 281–288. [PubMed] [Google Scholar]
- Alexander SPH, Benson HE, Faccenda E, Pawson AJ, Sharman JL, Spedding M et al. (2013a). The Concise Guide to PHARMACOLOGY 2013/14: Enzymes. Br J Pharmacol 170: 1797–1867. [DOI] [PMC free article] [PubMed] [Google Scholar]
- Alexander SPH, Benson HE, Faccenda E, Pawson AJ, Sharman JL, Spedding M et al. (2013b). The Concise Guide to PHARMACOLOGY 2013/14: Nuclear Hormone Receptors. Br J Pharmacol 170: 1652–1675. [DOI] [PMC free article] [PubMed] [Google Scholar]
- Bechmann LP, Hannivoort RA, Gerken G, Hotamisligil GS, Trauner M, Canbay A (2012). The interaction of hepatic lipid and glucose metabolism in liver diseases. J Hepatol 56: 952–964. [DOI] [PubMed] [Google Scholar]
- Berthe MC, Bernard M, Rasmusen C, Darquy S, Cynober L, Couderc R (2011). Arginine or citrulline associated with a statin stimulates nitric oxide production in bovine aortic endothelial cells. Eur J Pharmacol 670: 566–570. [DOI] [PubMed] [Google Scholar]
- Bode‐Böger SM, Muke J, Surdacki A, Brabant G, Böger RH, Frölich JC (2003). Oral 1‐arginine improves endothelial function in healthy individuals older than 70 years. Vasc Med 8: 77–81. [DOI] [PubMed] [Google Scholar]
- Bonnard C, Durand A, Peyrol S, Chanseaume E, Chauvin MA, Morio B et al. (2008). Mitochondrial dysfunction results from oxidative stress in the skeletal muscle of diet‐induced insulin‐resistant mice. J Clin Invest 118: 789–800. [DOI] [PMC free article] [PubMed] [Google Scholar]
- Brouwer E. (1965). Report of sub‐committee on constants and factors In: Blaxter KL. (ed.). Energy Metabolism: Proc. 3rd Symp. EAAP Publ. No. 11. Academic Press: London, UK, 441–443. [Google Scholar]
- Cardaci S, Filomeni G, Ciriolo MR (2012). Redox implications of AMPK‐mediated signal transduction beyond energetic clues. J Cell Sci 125: 2115–2125. [DOI] [PubMed] [Google Scholar]
- Castillo L, Beaumier L, Ajami AM, Young VR (1996). Whole body nitric oxide synthesis in healthy men determined from [15 N] arginine‐to‐[15 N]citrulline labeling. Proc Natl Acad Sci U S A 93: 11460–11465. [DOI] [PMC free article] [PubMed] [Google Scholar]
- Chen Y, Zhao L, Li Q, Wheeler DC, Varghese Z, Moorhead JF et al. (2014a). Inflammatory stress reduces the effectiveness of statins in the kidney by disrupting HMGCoA reductase feedback regulation. Nephrol Dial Transplant 29: 1864–1878. [DOI] [PubMed] [Google Scholar]
- Chen Y, Ku H, Zhao L, Wheeler DC, Li LC, Li Q et al. (2014b). Inflammatory stress induces statin resistance by disrupting 3‐hydroxy‐3‐methylglutaryl‐CoA reductase feedback regulation. Arterioscler Thromb Vasc Biol 34: 365–376. [DOI] [PubMed] [Google Scholar]
- Cook S, Hugli O, Egli M, Ménard B, Thalmann S, Sartori C et al. (2004). Partial gene deletion of endothelial nitric oxide synthase predisposes to exaggerated high‐fat diet‐induced insulin resistance and arterial hypertension. Diabetes 53: 2067–2072. [DOI] [PubMed] [Google Scholar]
- Curis E, Nicolis I, Moinard C, Osowska S, Zerrouk N, Bénazeth S et al. (2005). Almost all about citrulline in mammals. Amino Acids 29: 177–205. [DOI] [PubMed] [Google Scholar]
- Després JP (1993). Abdominal obesity as important component of insulin‐resistance syndrome. Nutrition 9: 452–459. [PubMed] [Google Scholar]
- Duplain H, Burcelin R, Sartori C, Cook S, Egli M, Lepori M et al. (2001). Insulin resistance, hyperlipidemia, and hypertension in mice lacking endothelial nitric oxide synthase. Circulation 104: 342–345. [DOI] [PubMed] [Google Scholar]
- Farese RV Jr, Zechner R, Newgard CB, Walther TC (2012). The problem of establishing relationships between hepatic steatosis and hepatic insulin resistance. Cell Metab 15: 570–573. [DOI] [PMC free article] [PubMed] [Google Scholar]
- Faure C, Morio B, Chafey P, Le Plénier S, Noirez P, Randrianarison‐Huetz V et al. (2013). Citrulline enhances myofibrillar constituents expression of skeletal muscle and induces a switch in muscle energy metabolism in malnourished aged rats. Proteomics 13: 2191–2201. [DOI] [PubMed] [Google Scholar]
- Faure C, Raynaud‐Simon A, Ferry A, Daugé V, Cynober L, Aussel C et al. (2012). Leucine and citrulline modulate muscle function in malnourished aged rats. Amino Acids 42: 1425–1433. [DOI] [PubMed] [Google Scholar]
- Fitzgerald SM, Kemp‐Harper BK, Parkington HC, Head GA, Evans RG (2007). Endothelial dysfunction and arterial pressure regulation during early diabetes in mice: roles for nitric oxide and endothelium‐derived hyperpolarizing factor. Am J Physiol Regul Integr Comp Physiol 293: R707–R713. [DOI] [PubMed] [Google Scholar]
- Folch J, Lees M, Sloane Stanley GH (1957). A simple method for the isolation and purification of total lipids from animal tissues. J Biol Chem 226: 497–509. [PubMed] [Google Scholar]
- Food and Drug Administration (2012). FDA drug safety communication: important safety label changes to cholesterol‐lowering statin drugs. Available from: http://www.fda.gov/Drugs/DrugSafety/ucm293101.htm. Accessed September 5, 2012.
- Grimble GK (2007). Adverse gastrointestinal effects of arginine and related amino acids. J Nutr 137: 1693S–1701S. [DOI] [PubMed] [Google Scholar]
- Higashi Y, Sasaki S, Nakagawa K, Matsuura H, Chayama K, Oshima T (2001). Effect of obesity on endothelium‐dependent, nitric oxide‐mediated vasodilation in normotensive individuals and patients with essential hypertension. Am J Hypertens 14: 1038–1045. [DOI] [PubMed] [Google Scholar]
- Ji G, Zhao X, Leng L, Liu P, Jiang Z (2011). Comparison of dietary control and atorvastatin on high fat diet induced hepatic steatosis and hyperlipidemia in rats. Lipids Health Dis 10: 23. [DOI] [PMC free article] [PubMed] [Google Scholar]
- Joffin N, Jaubert AM, Durant S, Bastin J, De Bandt JP, Cynober L et al. (2014). Citrulline reduces glyceroneogenesis and induces fatty acid release in visceral adipose tissue from overweight rats. Mol Nutr Food Res 58: 2320–2330. [DOI] [PubMed] [Google Scholar]
- Kashyap SR, Lara A, Zhang R, Park YM, DeFronzo RA (2008). Insulin reduces plasma arginase activity in type 2 diabetic patients. Diabetes Care 31: 134–139. [DOI] [PMC free article] [PubMed] [Google Scholar]
- Kilkenny C, Browne W, Cuthill IC, Emerson M, Altman DG, NC3Rs Reporting Guidelines Working Group (2010). Animal research: reporting in vivo experiments: the ARRIVE guidelines. Br J Pharmacol 160: 1577–1579. [DOI] [PMC free article] [PubMed] [Google Scholar]
- Kim F, Pham M, Maloney E, Rizzo NO, Morton GJ, Wisse BE et al. (2008). Vascular inflammation, insulin resistance, and reduced nitric oxide production precede the onset of peripheral insulin resistance. Arterioscler Thromb Vasc Biol 28: 1982–1988. [DOI] [PMC free article] [PubMed] [Google Scholar]
- Li Y, Xu S, Mihaylova MM, Zheng B, Hou X, Jiang B et al. (2011). AMPK phosphorylates and inhibits SREBP activity to attenuate hepatic steatosis and atherosclerosis in diet‐induced insulin‐resistant mice. Cell Metab 13: 376–388. [DOI] [PMC free article] [PubMed] [Google Scholar]
- McGrath J, Drummond G, McLachlan E, Kilkenny C, Wainwright C (2010). Guidelines for reporting experiments involving animals: the ARRIVE guidelines. Br J Pharmacol 160: 1573–1576. [DOI] [PMC free article] [PubMed] [Google Scholar]
- Moinard C, Le Plénier S, Cynober L, Raynaud‐Simon A (2009). Long‐term effect of citrulline supplementation in healthy aged rats: effect on body composition. Clin Nutr Suppl 4: 12. [Google Scholar]
- Moinard C, Nicolis I, Neveux N, Darquy S, Bénazeth S, Cynober L (2008). Dose‐ranging effects of citrulline administration on plasma amino acids and hormonal patterns in healthy subjects: the Citrudose pharmacokinetic study. Br J Nutr 99: 855–862. [DOI] [PubMed] [Google Scholar]
- Pawson AJ, Sharman JL, Benson HE, Faccenda E, Alexander SP, Buneman OP et al. (2014). The IUPHAR/BPS Guide to PHARMACOLOGY: an expert‐driven knowledge base of drug targets and their ligands. Nucl. Acids Res. 42 (Database Issue): D1098–1106. [DOI] [PMC free article] [PubMed] [Google Scholar]
- Poupeau A, Postic C (2011). Cross‐regulation of hepatic glucose metabolism via ChREBP and nuclear receptors. Biochim Biophys Acta 1812: 995–1006. [DOI] [PubMed] [Google Scholar]
- Rodríguez‐Calvo R, Barroso E, Serrano L, Coll T, Sánchez RM, Merlos M et al. (2009). Atorvastatin prevents carbohydrate response element binding protein activation in the fructose‐fed rat by activating protein kinase A. Hepatology 49: 106–115. [DOI] [PubMed] [Google Scholar]
- Roglans N, Sanguino E, Peris C, Alegret M, Vázquez M, Adzet T et al. (2002). Atorvastatin treatment induced peroxisome proliferator‐activated receptor alpha expression and decreased plasma nonesterified fatty acids and liver triglyceride in fructose‐fed rats. J Pharmacol Exp Ther 302: 232–239. [DOI] [PubMed] [Google Scholar]
- Sailer M, Dahlhoff C, Giesbertz P, Eidens MK, de Wit N, Rubio‐Aliaga I et al. (2013). Increased plasma citrulline in mice marks diet‐induced obesity and may predict the development of the metabolic syndrome. PLoS One 8: e63950. [DOI] [PMC free article] [PubMed] [Google Scholar]
- Sansbury BE, Hill BG (2014). Regulation of obesity and insulin resistance by nitric oxide. Free Radic Biol Med 73C: 383–399. [DOI] [PMC free article] [PubMed] [Google Scholar]
- Schild L, Dombrowski F, Lendeckel U, Schulz C, Gardemann A, Keilhoff G (2008). Impairment of endothelial nitric oxide synthase causes abnormal fat and glycogen deposition in liver. Biochim Biophys Acta 1782: 180–187. [DOI] [PubMed] [Google Scholar]
- Schulman SP, Becker LC, Kass DA, Champion HC, Terrin ML, Forman S et al. (2006). l‐arginine therapy in acute myocardial infarction: the Vascular Interaction With Age in Myocardial Infarction (VINTAGE MI) randomized clinical trial. JAMA 295: 58–64. [DOI] [PubMed] [Google Scholar]
- Schwedhelm E, Maas R, Freese R, Jung D, Lukacs Z, Jambrecina A et al. (2008). Pharmacokinetic and pharmacodynamic properties of oral l‐citrulline and l‐arginine: impact on nitric oxide metabolism. Br J Clin Pharmacol 65: 51–59. [DOI] [PMC free article] [PubMed] [Google Scholar]
- Stone NJ, Robinson JG, Lichtenstein AH, Bairey Merz CN, Blum CB, Eckel RH et al. et al. (2014). 2013 ACC/AHA guideline on the treatment of blood cholesterol to reduce atherosclerotic cardiovascular risk in adults: a report of the American College of Cardiology/American Heart Association Task Force on Practice Guidelines. J Am Coll Cardiol 63: 2889–2934. [DOI] [PubMed] [Google Scholar]
- Sun W, Lee TS, Zhu M, Gu C, Wang Y, Zhu Y et al. (2006). Statins activate AMP‐activated protein kinase in vitro and in vivo . Circulation 114: 2655–2662. [DOI] [PubMed] [Google Scholar]
- Tangphao O, Grossmann M, Chalon S, Hoffman BB, Blaschke TF (1999). Pharmacokinetics of intravenous and oral l‐arginine in normal volunteers. Br J Clin Pharmacol 47: 261–266. [DOI] [PMC free article] [PubMed] [Google Scholar]
- Tateya S, Rizzo NO, Handa P, Cheng AM, Morgan‐Stevenson V, Daum G et al. (2011). Endothelial NO/cGMP/VASP signaling attenuates Kupffer cell activation and hepatic insulin resistance induced by high‐fat feeding. Diabetes 60: 2792–2801. [DOI] [PMC free article] [PubMed] [Google Scholar]
- Thibault R, Flet L, Vavasseur F, Lemerle M, Ferchaud‐Roucher V, Picot D et al. (2011). Oral citrulline does not affect whole body protein metabolism in healthy human volunteers: results of a prospective, randomized, double‐blind, cross‐over study. Clin Nutr 30: 807–811. [DOI] [PubMed] [Google Scholar]
- Wang H, Wang AX, Aylor K, Barrett EJ (2013). Nitric oxide directly promotes vascular endothelial insulin transport. Diabetes 62: 4030–4042. [DOI] [PMC free article] [PubMed] [Google Scholar]
- Waters DD, Ho JE, DeMicco DA, Breazna A, Arsenault BJ, Wun CC et al. (2011). Predictors of new‐onset diabetes in patients treated with atorvastatin: results from 3 large randomized clinical trials. J Am Coll Cardiol 57: 1535–1545. [DOI] [PubMed] [Google Scholar]
- World Health Organization (2014). Obesity and overweight. Fact sheet No. 311. Available from http://www.who.int/mediacentre/factsheets/fs311/en/, accessed August 10, 2014.
- Wu G, Collins JK, Perkins‐Veazie P, Siddiq M, Dolan KD, Kelly KA et al. (2007). Dietary supplementation with watermelon pomace juice enhances arginine availability and ameliorates the metabolic syndrome in Zucker diabetic fatty rats. J Nutr 137: 2680–2685. [DOI] [PubMed] [Google Scholar]
- Zhou Y, Qiu L, Xiao Q, Wang Y, Meng X, Xu R et al. (2013). Obesity and diabetes related plasma amino acid alterations. Clin Biochem 46: 1447–1452. [DOI] [PubMed] [Google Scholar]