

Abstract
Background and Purpose
Recently, two phase‐II trials demonstrated improved renal function in critically ill patients with sepsis‐associated acute kidney injury treated with the enzyme alkaline phosphatase. Here, we elucidated the dual active effect on renal protection of alkaline phosphatase.
Experimental Approach
The effect of human recombinant alkaline phosphatase (recAP) on LPS‐induced renal injury was studied in Sprague–Dawley rats. Renal function was assessed by transcutaneous measurement of FITC‐sinistrin elimination in freely moving, awake rats. The mechanism of action of recAP was further investigated in vitro using conditionally immortalized human proximal tubular epithelial cells (ciPTEC).
Key Results
In vivo, LPS administration significantly prolonged FITC‐sinistrin half‐life and increased fractional urea excretion, which was prevented by recAP co‐administration. Moreover, recAP prevented LPS‐induced increase in proximal tubule injury marker, kidney injury molecule‐1 expression and excretion. In vitro, LPS‐induced production of TNF‐α, IL‐6 and IL‐8 was significantly attenuated by recAP. This effect was linked to dephosphorylation, as enzymatically inactive recAP had no effect on LPS‐induced cytokine production. RecAP‐mediated protection resulted in increased adenosine levels through dephosphorylation of LPS‐induced extracellular ADP and ATP. Also, recAP attenuated LPS‐induced increased expression of adenosine A2A receptor. However, the A2A receptor antagonist ZM‐241385 did not diminish the effects of recAP.
Conclusions and Implications
These results indicate that the ability of recAP to reduce renal inflammation may account for the beneficial effect observed in septic acute kidney injury patients, and that dephosphorylation of ATP and LPS are responsible for this protective effect.
Abbreviations
- AKI
acute kidney injury
- ciPTEC
conditionally immortalized proximal tubular epithelial cells
- dLPS
detoxified LPS
- IAP
intestinal alkaline phosphatase
- KIM‐1
kidney injury molecule‐1
- NGAL
neutrophil gelatinase‐associated lipocalin
- PBMCs
peripheral blood mononuclear cells
- PFA
paraformaldehyde
- recAP
human recombinant alkaline phosphatase
- TLR4
toll‐like receptor 4
Tables of Links
| TARGETS | |
|---|---|
| GPCRs a | Catalytic receptors c |
| A1 receptor | NLRP3 |
| A2A receptor | TLR4 |
| A2B receptor | Enzymes d |
| A3 receptor | iNOS |
| P2Y receptors | MPO |
| Ligand‐gated ion channels b | |
| P2X receptors |
These Tables list key protein targets and ligands in this article which are hyperlinked to corresponding entries in http://www.guidetopharmacology.org, the common portal for data from the IUPHAR/?BPS Guide to PHARMACOLOGY (Pawson et?al., 2014) and are permanently archived in the Concise Guide to PHARMACOLOGY 2013/?14 (a,b,c,dAlexander et?al., 2013a, 2013b, 2013c, 2013d).
Introduction
Acute kidney injury (AKI) in critically ill patients admitted to the intensive care unit is frequently observed and is associated with a high mortality rate and an increased risk of end‐stage renal disease amongst survivors (Goldberg and Dennen, 2008; Case et al., 2013). The most common cause of AKI in the critically ill is sepsis. Its pathophysiology is complex, and suggested to be mediated by both inflammation and alterations in the renal microcirculation (Romanovsky et al., 2014), for which a specific treatment is currently unavailable. LPS, a part of the outer membrane of Gram‐negative bacteria, plays a major role in the inflammatory cascade observed during sepsis. LPS induces both systemic and renal inflammation through signalling via its pattern recognition receptor Toll‐like receptor 4 (TLR4), localized on immune cells and on proximal tubule epithelial cells (PTEC), resulting in epithelial inflammation, endothelial inflammation and hypoxia (Cohen, 2002; Ince, 2005; Kalakeche et al., 2011). Due to the complex pathophysiology of sepsis, which involves systemic and renal inflammation combined with renal hypoxia, to be effective a treatment should aim to target all or a combination of these processes (reviewed by Peters et al., 2014).
Alkaline phosphatase (AP), a dephosphorylating enzyme, is a molecule that might exert such a dual mechanism of action. Bovine intestinal AP (IAP), originally developed as an anti‐sepsis treatment as it dephosphorylates, and thereby thought to detoxify LPS, appeared to be renal protective in a subpopulation of critically ill patients with sepsisassociated AKI (Heemskerk et al., 2009; Pickkers et al., 2012). Currently, human recombinant AP (recAP) has been developed and is now being tested in a large multicentre phase II clinical trial. However, importantly, the specific renal protective mechanism of action of AP is still unknown. Possibly, AP can detoxify LPS, which is composed of an oligosaccharide core component, a polysaccharide chain and the toxic lipid A part with two phosphate groups. Removal of one of these two phosphate groups by AP results in a non‐toxic LPS molecule, which can still bind to TLR4 but then acts as an antagonist (Bentala et al., 2002). Another potentially protective mechanism of AP is dephosphorylation of ATP, an endogenous signalling molecule released during cell stress, induced by for example inflammation and hypoxia. Excreted ATP attracts phagocytes and activates platelets and the NLRP3 inflammasome, further enhancing inflammation and tissue injury (Eltzschig and Eckle, 2011; Eltzschig et al., 2012). Upon dephosphorylation, possibly by exogenous AP, ATP yields ADP, AMP and adenosine, of which the latter exerts renal protective and anti‐inflammatory effects via binding to one of the four adenosine receptors A1, A2A, A2B and A3 (Bauerle et al., 2011). Potentially, AP enhances the conversion of ATP into adenosine, thereby increasing adenosine levels and exerting its anti‐inflammatory and tissue‐protective effects (Bauerle et al., 2011). This study was designed to investigate whether recAP provides protection during LPS‐induced AKI in rats, in vivo, and to unravel the molecular mechanisms of action behind these effects in a unique human conditionally immortalized PTEC model, ciPTEC (Wilmer et al., 2010). It is presumed that these molecular mechanisms are related to dephosphorylation of the harmful molecule(s) LPS and/or ATP.
Methods
Animals
Animal experiments were performed according to the National Animal Protection Law (Tierschutzgesetz 13.7.2013) and Animal Welfare Ordinance (TierSchVersV 13.8.2013), and the European Union Guidelines for the Care and the Use of Laboratory Animals (Directive 2010/63/EU). Protocols were approved by the institutional review board for animal experiments (13/145). Male specific‐pathogen free Sprague–Dawley rats (RjHan:SD, n = 18), weighing 150–200 g, were purchased at Janvier (Le Genest‐Saint‐Isle, France). Animals were housed (three rats per cage) in a specific‐pathogen‐free facility in open cages with aspen chip bedding, on a 12/12 h light/dark cycle at 20–24°C with a relative humidity of 50 ± 5%. Standard laboratory chow (Ssniff, type R/M; ssniff Spezialdiäten GmbH, Soest, Germany) and water were available ad libitum. All procedures used were as humane as possible. Studies involving animals were reported in accordance with the ARRIVE guidelines for reporting experiments involving animals (Kilkenny et al., 2010; McGrath et al., 2010). The drug and molecular target nomenclature confirms to IUPHAR/BPS Guide to Pharmacology (Pawson et al., 2014) and the Concise Guide to Pharmacology (Alexander et al., 2013a, 2013b, 2013c, 2013d).
Experimental protocol
Rats were randomly divided into three groups: placebo (n = 6), LPS (n = 6) or LPS + recAP (n = 6). A baseline plasma sample (lithium‐heparin blood) was collected 7 days preceding the experiment through a tail vein puncture using a Multivette (Sarstedt, Etten‐Leur, the Netherlands). Three days preceding the experiment, the baseline renal function was assed as FITC‐sinistrin half‐life (t 1/2) (Schock‐Kusch et al., 2011). At t = 0 h, placebo (0.9% NaCl, saline) or 0.3 mg kg−1 body weight (BW) LPS (E. coli 0127:B8; Sigma‐Aldrich, Zwijndrecht, the Netherlands; dissolved in saline) was administered to rats, weighing 298 ± 5 g, as an i.v. bolus into the tail vein to induce LPS‐induced renal failure. Dose–response experiments demonstrated this dose to be optimal to induce renal failure (not shown). At t = 1.5 h plasma was obtained as described earlier. At t = 2 h, rats received an i.v. bolus into the tail vein of placebo or recAP (1000 U kg−1 BW, diluted in saline; kind gift from AM‐Pharma, Bunnik, the Netherlands) followed by a second measurement of renal function. Previous dose–response experiments indicated this dose to be optimal to prevent AKI in several animal species (unpublished data). At t = 5 h, all animals received 5 mL saline (s.c.) to prevent dehydration, followed by a 16 h urine collection period. At t = 21.5 h the third transcutaneous measurement was performed. At t = 24 h, rats were anaesthetized (i.p., 3 mg kg−1 BW xylazine and 80 mg kg−1 BW ketamine 10%), a retrobulbar lithium‐heparin blood sample was withdrawn to obtain plasma, and whole body perfusion was started [6 min, saline + 50 IU mL−1 heparin, 210 mbar; 3 min, 4% paraformaldehyde (PFA; 210 mbar)], which killed the animals. After saline perfusion, the right kidney was carefully removed, snap frozen and stored at −80°C until processing. The left kidney, removed after PFA perfusion, was stored in 4% PFA at 4°C until processed for histology and immunohistochemistry. One animal from the LPS + recAP group and one urine sample from the placebo group were excluded because of injection and collection difficulties, respectively.
Renal function measurements
Renal function was assessed in freely moving awake rats through transcutaneously measured elimination kinetics of FITC‐sinistrin (Fresenius Kabi, Linz, Austria), a commercially available marker of glomerular filtration rate (GFR), by using a novel measurement device as described previously (Schock‐Kusch et al., 2009; Schock‐Kusch et al., 2011). Briefly, rats were anaesthetized by isoflurane inhalation (5% induction, 1.5–2% maintenance; Abbott Laboratories, Illinois, USA) and shaved on the back. The optical part of the device was fixed on this depilated region using a specifically designed double‐sided adhesive patch (Lohmann GmbH, Neuwied, Germany), whereas the electronic part of the device was incorporated into a rodent jacket (Lomir Biomedical, New York, USA). After the baseline signal had been established, FITC‐sinistrin (5 mg 100 g−1 BW, diluted in buffered saline) was injected in the tail vein. Thereafter, the animals were allowed to recover from anaesthesia, while the measurement continued for approximately 120 min post‐injection. Half‐life was calculated by a one‐compartment model applied on the transcutaneously measured FITC‐sinistrin elimination kinetics (Schock‐Kusch et al., 2009). Parameters of renal function were determined in plasma and urine samples using the Cobas c311 chemistry analyser (Roche Diagnostics, Mannheim, Germany). Fractional urea excretion and endogenous creatinine clearance were calculated with average plasma values obtained at 1.5 and 24 h.
Histology and immunohistochemistry
After fixation for at least 24 h, tissue was processed, embedded in paraplast and sectioned at 3 μM thickness. For routine histology, periodic acid‐Schiff (PAS) and haematoxylin and eosin (H&E) staining were performed on renal tissue. Renal injury was assessed using a scoring system with a scale from 0 to 4 (0 = no changes; 4 = severe damage, e.g. marked changes to the tubule cell). Kidney injury molecule (KIM)‐1 was detected by primary antibody goat‐anti‐rat KIM‐1 (1:50; AF3689, R&D Systems, Abingdon, UK) and secondary antibody rabbit‐anti‐goat IgG (1:200; P0449, DAKO, Heverlee, Belgium). Immunostaining was visualized with VECTASTAIN Eline ABC system reagents (Vector Labs, Amsterdam, the Netherlands) and 3,3′‐diaminobenzidine (Sigma‐Aldrich, Zwijndrecht, the Netherlands), followed by H&E counterstain. All scoring was performed in a blinded fashion.
Tissue homogenization
Snap frozen kidneys were homogenized by the TissueLyser LT (Qiagen, Venlo, The Netherlands) according to manufacturer's instructions, in Tissue Protein Extraction Reagent (Thermo Scientific, Illinois, USA), supplemented with complete EDTA‐free protease inhibitor cocktail tablets (Roche Applied Science, Almere, the Netherlands). Total protein content was determined using the bicinchonicic acid protein assay kit (Thermo Scientific), and samples were stored at −80°C until assayed.
Urinary purine content
Adenosine, AMP, ADP, ATP and cAMP content was determined by HPLC. In brief, 4 volumes of urine were mixed with 1 volume of chloroacetaldehyde (6× diluted in 1 M acetate buffer, pH 4.5; Sigma‐Aldrich), followed by derivatization (60 min, 70°C, 20 g) and centrifugation (3 min, RT, 12045 g), whereafter the supernatant was transferred to a HPLC vial and injected. Purines were separated by HPLC system (Agilent Technologies) using a Polaris C18‐A column (150 × 4.6 mm) with gradient elution using eluent A (0.1 M K2HPO4, 10 mM tetrabutylammonium bisulphate (TBAHS) (pH 6.5), and 2% MeOH) and eluent B (H2O: ACN: THF; 50:49:1). Retention times were 7.1 (adenosine), 8.4 (AMP), 12.5 (ADP), 16.2 (ATP) and 14.8 min (cAMP). Quantification was based on peak areas of the samples and reference standards measured with fluorescence (excitation and emission wavelengths set at 280 and 420 nm, respectively).
Cell culture
Routinely, ciPTEC were cultured at 33°C as described (Wilmer et al., 2010). Preceding an experiment, cells were seeded in a wells plate (48 400 cells per cm2), incubated for 1 day at 33°C followed by a 7‐day maturation period at 37°C. On the day of the experiment, cells were pre‐incubated for 2 h with recAP (1, 5 or 10 U mL−1), also referred to as chimeric AP (Kiffer‐Moreira et al., 2014), followed by incubation for 24 h with 10 µg mL−1 LPS (E. coli 0127:B8; Sigma‐Aldrich; n = 5) dissolved in 10 mM HEPES HBSS, pH 7.4 (HEPES: Roche Diagnostics; HBSS: Gibco, Life Technologies, Bleiswijk, the Netherlands). Alternatively, 10 U mL−1 recAP (17 µg mL−1) was administered to LPS‐incubated cells simultaneously or after 2 h. Control cells were incubated with culture medium solely. Detoxified LPS (dLPS; E. coli 055:B5; Sigma‐Aldrich, 10 µg mL−1) and inactive recAP (17 µg mL−1, kind gift from AM‐Pharma) were used as negative controls. In different sets of experiments (n = 5), LPS was substituted for human TNF‐α recombinant protein (Ebioscience, Vienna, Austria), or supernatant of peripheral blood mononuclear cells [PBMCs, prestimulated for 24 h with or without LPS (1 ng mL−1)]. In addition, cells were pre‐incubated for 45 min with TLR‐4 receptor antagonist LPS from R. sphaeroides (LPS‐RS; 5–500 µg mL−1; Invivogen, Toulouse, France; n = 5), dissolved in culture medium, or with A2A receptor agonist CGS‐21680 (0.001–10 μM; Sigma‐Aldrich) or antagonist ZM‐241385 (0.001–10 μM; Tocris, Abingdon, UK; n = 4), dissolved in DMSO (Sigma‐Aldrich), followed by the administration of LPS (10 µg mL−1) for 24 h. RecAP (10 U mL−1) was added 90 min after ZM‐241385 administration. All experiments were at least performed in duplicate.
Isolation of peripheral blood mononuclear cells
PBMCs were isolated from buffy coats obtained from healthy blood donors (blood bank Nijmegen, n = 5) by differential centrifugation over Ficoll‐Pague Plus (GE Healthcare, Diegem, Belgium). PBMCs were resuspended in RPMI‐1640 medium (Gibco) enriched with 0.5 mg mL−1 gentamicin (Sigma‐Aldrich), 1 mM pyruvate (Gibco) and 2 mM glutamax (Gibco). Cells were seeded in 96‐well plates at a density of 0.5 × 10⁶ cells per well, pre‐incubated with or without AP (10 mL−1) for 2 h, followed by LPS incubation (1 ng mL−1) for 24 h. All experiments (n = 5) were performed in duplicate.
Purine release and cell viability assay
Supernatant was collected 20 min after LPS administration, with or without recAP‐pretreatment, followed by direct measurement of ATP production using the ATP Bioluminescence Assay Kit CLS II (Roche Diagnostics, Mannheim, Germany) according to manufacturer's protocol, and measurement of total purine content, by HPLC as described earlier, in Krebs–Henseleit buffer containing 10 mM HEPES (pH 7.4). Cell viability was assessed after 20 min and 24 h of LPS incubation by performing the MTT assay, as described (Moghadasali et al., 2013).
Cytokines, AP and renal injury markers
Human ELISA kits (R&D Systems, Abingdon, UK) were used to determine TNF‐α, IL‐6 and IL‐8 in supernatant according to manufacturer's instructions. Plasma cytokine levels (IL‐1β, IL‐6, IL‐10, TNF‐α, INF‐γ) were determined by a simultaneous Luminex assay according to the manufacturer's instructions (Millipore, Cork, Ireland). KIM‐1 and neutrophil gelatinase‐associated lipocalin (NGAL) were determined by ELISA (R&D Systems) according to manufacturer's instructions. AP activity levels (AP IFCC Gen.2; Roche Diagnostics, Mannheim, Germany) were determined in plasma using the Cobas c311 chemistry analyser (Roche Diagnostics, Mannheim, Germany).
Real‐time PCR analyses
RNA was extracted from frozen cell pellet or pulverized kidneys (2000 1/min, 30 s; Mikro‐dismembrator U, Sartorius Stedim Biotech, Aubagne Cedex, France) by Trizol reagent. RNA was reverse‐transcribed into cDNA using Moloney Murine Leukemia Virus (M‐MLV) Reverse Transcriptase (Invitrogen, Breda, The Netherlands). Real‐time quantitative PCR was performed using Taqman® (Applied Biosystems, California, USA). Genes were amplified and normalized to the expression of GAPDH (ciPTEC: Ct: 18.9 ± 0.1; renal tissue: Ct: 24.8 ± 0.2). Differences between groups were calculated by the comparative ΔΔCt method. Primers/probe sets are summarized in Supplemental Table 1.
Statistical analysis
Normal distribution of the in vivo data could not be assumed because of the sample size, and therefore, data are expressed as median (25th percentile, 75th percentile). Normality of the in vitro data was assessed by Kolmogorov–Smirnov test and expressed as mean ± SEM or median (25th percentile, 75th percentile). Differences between groups were estimated by ANOVA with post hoc comparisons using Bonferroni's multiple comparison test or by Kruskal–Wallis test with Dunn's post‐test. A two‐sided P‐value less than 0.05 was considered statistically significant. All tests were performed with Graphpad Prism 5.00 for Windows (Graphpad Software Inc., California, USA).
Results
RecAP treatment during LPS‐induced AKI in rats attenuates impaired renal function
To investigate the renal protective effects of recAP in detail in vivo, AKI was induced in rats by LPS, and renal function was assessed by measurement of the FITC‐labelled sinistrin kinetics, as previously reported (Schock‐Kusch et al., 2011). FITC‐sinistrin is cleared by the kidneys only through filtration, and its disappearance from the plasma compartment can be measured transcutaneously in real time (Schock‐Kusch et al., 2009; Schock‐Kusch et al., 2011). This allows the progression of AKI to be investigated in a more accurate manner as compared with the commonly used creatinine clearance (Devarajan, 2011). Preceding LPS injection, a baseline blood sample was drawn to determine physiological parameters and plasma cytokines, and baseline FITC‐sinistrin half‐life (t 1/2) was determined from the kinetics measured to ascertain homogeneity between groups (data not shown). After 1.5 h, LPS treatment resulted in increased plasma cytokine levels, abnormalities in several plasma parameters (Supplemental Table 2), piloerection, diarrhoea and reduced spontaneous activity, confirming the presence of systemic inflammation. Two hours after LPS administration, rats were treated with recAP (1000 U kg−1 BW) or placebo (saline), directly followed by transcutaneous renal function measurements. LPS prolonged FITC‐sinistrin half‐life, revealing a significant reduction in renal function. This trend was attenuated by recAP treatment (Figure 1A). In all groups, renal function fully recovered within 24 h (Figure 1B). Also, recAP treatment prevented the LPS‐induced increase in plasma urea levels (Table 1) and fractional urea excretion (Figure 1C), whereas no differences were observed in endogenous creatinine clearance (Figure 1D). RecAP bio‐activity was confirmed in plasma by an eightfold increase 22 h after injection [placebo: 286 (266–329) U mL−1, LPS: 254 (243–285) U mL−1, LPS + recAP: 2158 (2012–2274) U mL−1; P < 0.001].
Figure 1.
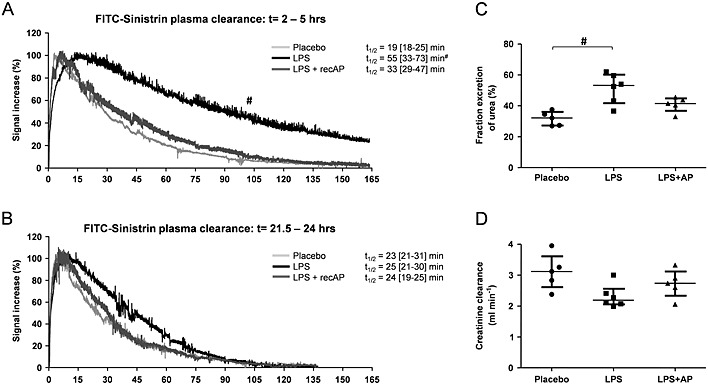
RecAP prevents the LPS‐induced deterioration in renal function in vivo. Renal function was assessed by the transcutaneous measurement of FITC‐sinistrin t 1/2. AKI was induced in rats by LPS (0.3 mg kg−1 BW, t = 0 h), followed by recAP treatment (1000 U kg−1 BW) at t = 2. The t 1/2 measurements were performed at t = 2 h and t = 21.5 h (A, B: examples of FITC‐sinistrin kinetics obtained for one rat at the two respective time points). Urine was collected between t = 5 and t = 16 h, and plasma was sampled at t = 1.5 and t = 24 h, allowing calculation of (C) fractional urea excretion and (D) creatinine clearance with the average plasma value of t = 1.5 and t = 24 h. Data are expressed as median [25th percentile, 75th percentile] (Placebo, LPS n = 6; LPS + recAP n = 5), # P < 0.05 compared with placebo. RecAP, recombinant alkaline phosphatase; AKI, acute kidney injury.
Table 1.
Plasma and urinary parameters
| Placebo | LPS | LPS + recAP | |
|---|---|---|---|
| Plasma parameters | |||
| Creatinine (µmol L−1) | 18 [15–20] | 22 [19–25] | 18 [16–20] |
| Urea (mmol L−1) | 10.0 [8.6–11.1] | 17.5 [13.4–20.9]# | 12.1 [11.4–14.6] |
| Lactate (mmol L−1) | 1.1 [0.9–3.4] | 1.6 [1.3–2.3] | 1.3 [1.1–1.6] |
| Glucose (mmol L−1) | 8.0 [7.3–8.8] | 7.5 [5.9–8.4] | 9.0 [8.5–9.4] |
| Protein (mg mL−1) | 56 [54–57] | 56 [52–57] | 54 [54–58] |
| Calcium (mmol L−1) | 2.8 [2.7–3.1] | 2.7 [2.6–2.7] | 2.7 [2.6–2.8] |
| Inorganic phosphorus (mmol L−1) | 2.91 [2.77–3.20] | 3.06 [2.88–3.31] | 2.90 [2.80–3.13] |
| Sodium (mmol L−1) | 150 [148–157] | 154 [147–155] | 150 [141–154] |
| Potassium (mmol L−1) | 4.25 [4.16–4.31] | 4.33 [4.17–4.53] | 4.28 [3.97–4.93] |
| Urinary parameters | |||
| Creatinine (mg) | 5.7 [4.7–5.8] | 6.2 [5.3–6.6] | 5.8 [5.1–6.2] |
| Urea (mg) | 272 [215–317] | 489 [450–524]# | 442 [402–476] |
| Albumin (µg) | 0 [0–54] | 0 [0–663] | 310 [0–419] |
| Glucose (mg) | 1.6 [1.0–2.1] | 1.6 [1.1–2.3] | 0.8 [0.5–1.6] |
| Protein (µg) | 37 [28–50] | 71 [42–87]# | 56 [41–83] |
| Calcium (µmol) | 3.4 [3.0–5.6] | 6.3 [5.4–9.1] | 5.9 [4.1–11] |
| Inorganic phosphorus (mmol) | 0.50 [0.31–0.93] | 0.63 [0.61–0.97] | 0.64 [0.56–0.76] |
| Sodium (mmol) | 1.6 [1.3–2.0] | 1.5 [1.3–1.7] | 1.5 [1.4–2.4] |
| Potassium (mmol) | 1.3 [1.2–2.2] | 2.0 [1.7–2.8] | 1.9 [1.8–2.0] |
Plasma parameters were determined 24 h after LPS administration. Urinary parameters were determined between 5 and 21 h after LPS administration. Data are expressed as median (25th percentile, 75th percentile). Significant differences estimated using Kruskal–Wallis test with Dunns post‐test. Placebo, LPS n = 6; LPS + recAP n = 5; urinary parameters: placebo n = 5.
P < 0.05 compared with placebo;
P < 0.05 compared with LPS. recAP, human recombinant alkaline phosphatase.
RecAP prevents renal injury during LPS‐induced AKI in vivo
The renal protective effect of recAP on LPS‐induced AKI was investigated further through evaluation of specific tubular injury markers and renal histology. LPS administration resulted in a significant increase in renal IL‐6 expression levels, while other cytokines and injury markers (MPO; BAX, Bcl2‐associated X protein; iNOS) were not affected (Table 2). RecAP could not reduce renal IL‐6 expression levels, but did enhance renal expression of the anti‐inflammatory cytokine IL‐10 (Table 2). Furthermore, LPS administration resulted in a significant increase in the urinary excretion of KIM‐1, which was accompanied by increased renal gene expression levels. This effect was prevented by recAP co‐administration (Figure 2A, Table 2). Similar effects of recAP were observed for renal protein levels of KIM‐1 (Figure 2B), which was localized primarily to the apical surface of the proximal tubules (Figure 2C). RecAP treatment had no effect on the urinary excretion and renal protein levels of NGAL, but could prevent the LPS‐induced increase in renal NGAL expression (Figure 2D–E, Table 2). Despite these differences in renal injury, no differences in histology were found between the treatment groups. Changes observed ranged from no damage (graded 0) to minimal degenerative changes, like foamy appearance and minimal swelling of proximal tubular cells (graded 1) and foamy appearance and moderate swelling as well as a few cases of apoptosis (graded 2) [placebo: 1 (0.75–2), LPS: 1.5 (0–2), LPS + recAP: 1 (0–1.0); Figure 2F].
Table 2.
Renal gene expression levels
| Ct values | Fold increase (2^ΔΔCt) | |||||
|---|---|---|---|---|---|---|
| Placebo | LPS | LPS + recAP | Placebo | LPS | LPS + recAP | |
| Cytokines | ||||||
| IL‐1β | 27.5 [26.8–28.9] | 26.5 [26.1–27.2] | 27.1 [26.2–27.6] | 1.2 [0.5–1.8] | 1.3 [0.7–2.6] | 1.5 [0.9–2.6] |
| IL‐6 | 37.4 [36.3–38.0] | 33.5 [33.3–34.8] | 34.7 [34.4–36.4] | 1.0 [0.7–1.6] | 4.7 [3.8–6.3]# | 4.1 [2.9–8.1]# |
| IL‐10 | 34.9 [34.0–35.7] | 32.5 [32.1–32.7] | 32.8 [32.3–33.4] | 1.0 [0.6–1.8] | 2.9 [1.4–4.6] | 4.7 [3.0–8.5]# |
| TNF‐α | 36.6 [36.2–37.3] | 35.5 [35.2–36.3] | 37.0 [36.4–38.1] | 1.1 [0.8–1.5] | 1.1 [0.8–1.2] | 0.9 [0.6–1.5] |
| INF‐γ | 36.2 [35.7–37.1] | 35.3 [34.7–36.3] | 35.4 [35.2–36.1] | 1.1 [0.6–1.6] | 1.2 [0.7–2.0] | 1.6 [1.1–2.2] |
| Injury markers | ||||||
| KIM‐1 | 31.7 [30.9–32.5] | 22.5 [21.4–24.5] | 24.6 [24.4–26.5] | 0.8 [0.6–1.9] | 430 [195–530]# | 113 [43–336] |
| NGAL | 29.0 [28.5–29.6] | 22.8 [22.1–25.9] | 23.8 [23.3–28.6] | 1.2 [0.4–1.9] | 41 [9–53]# | 28 [12–44] |
| MPO | 32.2 [32.8–33.3] | 31.1 [30.0–32.7] | 32.7 [30.9–35.1] | 1.0 [0.4–2.9] | 1.4 [0.4–3.9] | 0.6 [0.3–3.2] |
| BAX | 25.0 [24.7–25.7] | 24.8 [24.5–25.2] | 25.1 [24.4–25.9] | 0.9 [0.7–1.5] | 0.7 [0.3–2.1] | 1.0 [0.5–1.3] |
| iNOS | 36.0 [35.4–36.9] | 35.0 [34.7–35.4] | 35.4 [33.1–36.2] | 0.9 [0.7–1.6] | 1.5 [0.5–3.2] | 1.8 [1.3–4.3] |
| Adenosine receptors | ||||||
| A1 | 28.6 [28.1–29.2] | 27.9 [27.3–28.6] | 29.1 [28.2–30.4] | 1.3 [0.4–2.3] | 0.7 [0.5–1.4] | 0.8 [0.3–1.5] |
| A2A | 27.1 [26.7–27.2] | 26.3 [26.0–27.0] | 27.4 [26.7–27.9] | 1.2 [0.5–1.9] | 0.6 [0.5–1.1] | 0.8 [0.6–1.2] |
| A2B | 29.0 [28.9–29.3] | 28.4 [28.1–29.0] | 29.0 [28.9–30.2] | 1.1 [0.6–1.7] | 0.7 [0.5–1.2] | 0.8 [0.7–1.0] |
| A3 | 34.3 [33.5–34.9] | 34.3 [33.2–35.0] | 35.0 [33.8–36.1] | 1.0 [0.9–1.2] | 0.5 [0.4–0.7]# | 0.6 [0.4–1.0] |
Data are expressed as median [25th percentile, 75th percentile]. Significant differences estimated using Kruskal–Wallis test with Dunns post‐test. Placebo, LPS, n = 6; LPS + recAP, n = 5.
P < 0.05 compared with placebo.
Figure 2.
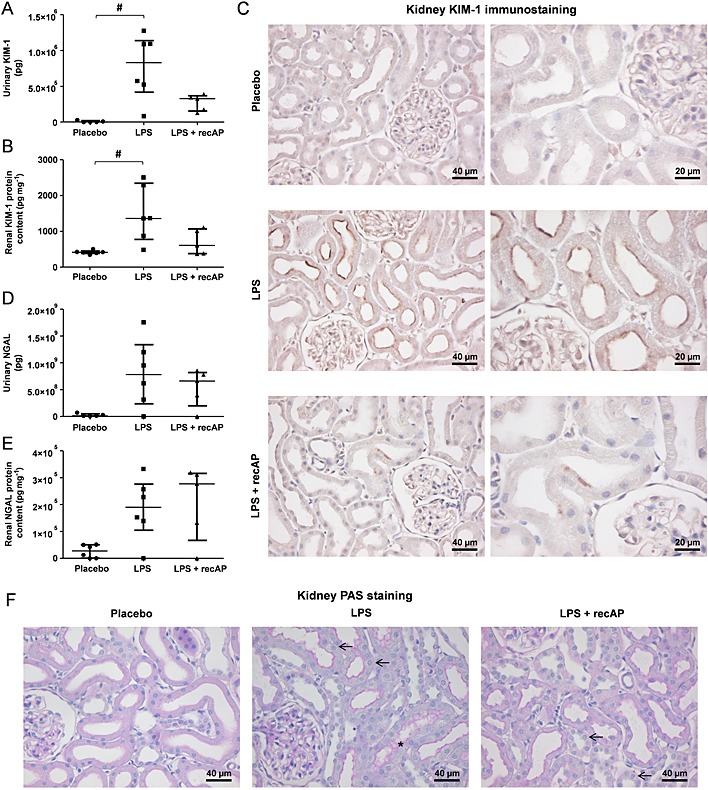
RecAP prevents renal injury during LPS‐induced AKI in vivo. (A) Urinary excretion and renal protein content of (A–B) KIM‐1 and (D–E) NGAL were determined by ELISA. Paraffin‐treated kidney sections were stained with (C) anti‐KIM‐1 to visualize KIM‐1 protein expression or (F) with PAS. Scale bars (E) 40 µm (left panel), 20 µm (right panel), (F) 40 µm. Arrows present cell swelling/foamy appearance; asterisks present debris. Data are expressed as median [25th percentile, 75th percentile] (Placebo, LPS n = 6; LPS + recAP n = 5; urinary parameters: placebo n = 5), # p < 0.05 compared with placebo. RecAP, recombinant alkaline phosphatase; KIM, kidney injury molecule; NGAL, neutrophil gelatinase‐associated lipocalin.
LPS‐induced AKI in vivo leads to reduced urinary adenosine excretion
To elucidate the renal protective mechanism of recAP, we investigated the role of the adenosine, which has previously been demonstrated to exert anti‐inflammatory and tissue‐protective effects in the kidney through binding to one of the adenosine receptors A1, A2A and A2B, whereas binding to the A3 receptor has antiprotective effects (Di Sole, 2008; Bauerle et al., 2011). LPS treatment tended to reduce the gene expression levels in the kidney for all four adenosine receptors, of which only the A3 receptor reached statistical significance (Table 2). Interestingly, LPS administration significantly decreased the urinary excretion of adenosine [placebo: 77 (50–82) pg adenosine 10 µg−1 creatinine, LPS: 17 (6–33) pg adenosine 10 µg−1 creatinine; P < 0.01], without affecting the excretion of cAMP, ATP, ADP and AMP (data not shown). This may suggest translocation of adenosine to the proximal tubule cells where it is taken up by equilibrative nucleoside transporter‐1, thereby restoring intracellular ATP levels (Grenz et al., 2012; Weinberg and Venkatachalam, 2012). RecAP treatment had no effect on adenosine receptor gene expression (Table 2), or on urinary adenosine excretion [LPS + recAP: 11 (5–32) pg adenosine 10 µg−1 creatinine; P < 0.01 compared with placebo] compared with LPS alone.
RecAP attenuates the LPS‐induced inflammatory response in vitro
After establishing the renal protective of recAP during LPS‐induced AKI in vivo, we aimed to unravel the molecular mechanism behind these effects in ciPTEC. Pre‐treatment of ciPTEC (Wilmer et al., 2010) with recAP attenuated the LPS‐induced cytokine production of TNF‐α, IL‐6 and IL‐8 at the gene and protein level (Figure 3A‐B). Doses above 10 U mL−1 recAP did not provide additional protection (not shown). DLPS was used as a negative control and had no effect. Similar protective results at the protein level were obtained when recAP was administered simultaneously with LPS or 2 h after LPS exposure (Figure 3C). A control experiment was performed to verify whether recAP dephosphorylates the cytokines excreted in the medium, which was not the case (not shown). To confirm that the recAP‐induced reduction in cytokine production was due to the dephosphorylating nature of the enzyme, the effect of inactive recAP that lacks hydrolyzing properties was investigated. Inactive recAP did not attenuate the LPS‐induced inflammatory response in ciPTEC (Figure 3D).
Figure 3.
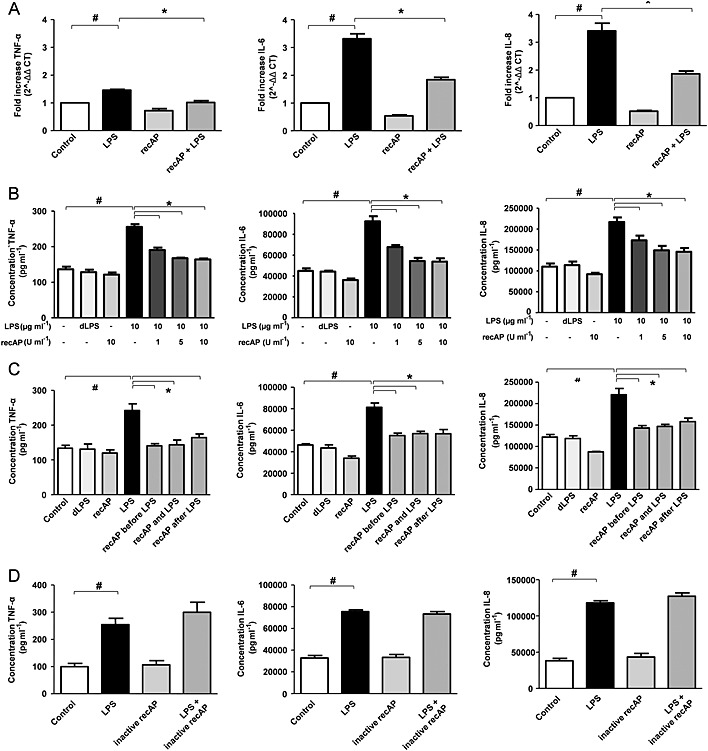
RecAP treatment attenuates the LPS‐induced cytokine production in human proximal tubule epithelial cells (ciPTEC). CiPTEC were pretreated with recAP (1‐5‐10 U mL−1) followed by LPS‐incubation (10 µg mL−1) for 24 h and subsequently TNF‐α, IL‐6 and IL‐8 production was measured (A) on gene level in cells by qPCR (10 U mL−1 recAP) and (B) on protein level in supernatant by ELISA. (C) recAP (10 U mL−1) was administered 2 h preceding LPS exposure, simultaneously with LPS or 2 h after LPS exposure, followed by measurement of TNF‐α, IL‐6 and IL‐8 protein content. (D) ciPTEC were pretreated with inactive AP for 2 h, lacking hydrolyzing properties, followed by LPS incubation (10 µg mL−1) for 24 h, thereafter TNF‐α, IL‐6 and IL‐8 protein content was measured. Control cells were incubated with culture media. Data are expressed as mean ± SEM (n = 5), # P < 0.05 compared with control, * P < 0.05 compared with LPS. RecAP, recombinant alkaline phosphatase.
The in vitro effects of recAP may be renal specific and not restricted to LPS‐induced inflammation
The renal protective mechanism of recAP was investigated further by incubating ciPTEC with the pro‐inflammatory cytokine TNF‐α, which cannot be dephosphorylated by calf IAP (Chen et al., 2010). The TNF‐α induced cytokine production of IL‐6 and IL‐8 was also attenuated by recAP pretreatment, whereas inactive recAP had no effect (Figure 4A).
Figure 4.
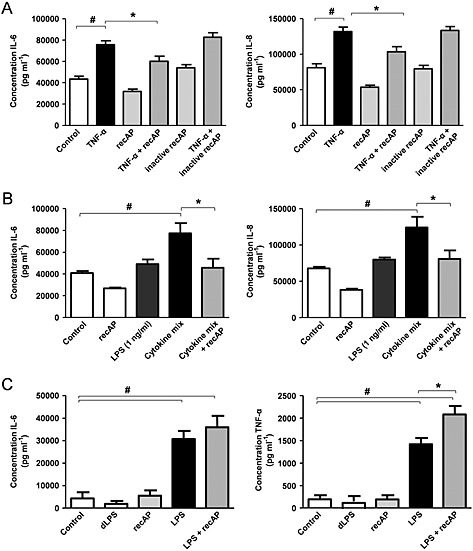
The effects of recAP are not restricted to LPS‐induced inflammation and can be renal specific. CiPTEC were pretreated with recAP (10 U mL−1) for 2 h followed by a 24‐h incubation with (A) TNF‐α (10 ng mL−1) or (B) supernatant of LPS‐stimulated peripheral blood mononuclear cells (PBMCs, 1 ng mL−1 LPS) or directly with 1 ng mL−1 LPS, thereafter IL‐6 and IL‐8 production was measured at the protein level by ELISA. (C) PBMCs were pre‐incubated for 2 h with recAP (10 U mL−1) followed by LPS exposure (1 ng mL−1) for 24 h. IL‐6 and TNF‐α production was measured by ELISA. Control cells were incubated with culture media. Data are expressed as mean ± SEM (n = 5), # P < 0.05 compared with control, * P < 0.05 compared with LPS. RecAP, recombinant alkaline phosphatase.
In the pathogenesis of sepsis‐associated AKI, LPS induces a local inflammatory response through binding to TLR4 expressed on PTEC (ciPTEC Ct: 30.5 ± 3.9; n = 5; Supplemental Figure 1) (Kalakeche et al., 2011). Another hallmark of the disease is the systemic inflammatory response, which affects both renal epithelial and endothelial cells causing the development of AKI (Peters et al., 2014). To mimic this endotoxin‐induced renal inflammation, ciPTECs were incubated with the supernatant of LPS‐stimulated PBMCs (1 ng mL−1 LPS). This induced the production of IL‐6 and IL‐8, which was decreased when ciPTECs were pretreated with recAP (Figure 4B, TNF‐α was not detectable). To exclude this cytokine production to be caused by LPS present in the cytokine mix itself, ciPTECs were directly incubated with the 10 000‐fold lower LPS dose (1 ng mL−1), which had no effect on the cytokine production (Figure 4B). Together with the finding that inflammatory responses mediated by TNF‐α were attenuated by recAP treatment, this suggests the presence of another mediator targeted by recAP. In contrast, pretreatment of PBMCs with recAP did not affect the LPS‐induced inflammatory response in these cells (Figure 4C), which suggests that the effects of recAP might be kidney specific.
RecAP exerts renal protective effects in vitro through ADP and ATP removal
A second potential target of recAP is ATP, released during cell stress caused by, for example, inflammation and hypoxia (Eltzschig et al., 2012). Extracellular ATP has detrimental effects, but can be converted by ectonucleotidases (amongst which AP) into AMP and eventually into adenosine. Interestingly, we observed increased extracellular ATP concentrations following LPS incubation, which was more pronounced with a higher LPS concentration but reversed by recAP pre‐incubation. The increase relative to control after a dose of 10 µg mL−1 LPS was 127 ± 21%, and after co‐administration of recAP 72% ± 13% (P < 0.05). After a dose of 100 µg mL−1 LPS, this increased even further to 320 ± 36%, which was attenuated by co‐treatment with recAP to 94 ± 21% (P < 0.001). Subsequently, ATP and ADP are directly converted into AMP and adenosine by recAP (Figure 5). LPS did not affect cell viability after 24 h of exposure (not shown). Furthermore, while the A1, A2B and A3 receptor expression levels in ciPTEC were not affected by LPS incubation (Table 3), the A2A receptor expression was up‐regulated upon LPS treatment and, subsequently, attenuated by recAP co‐treatment (Table 3). Inhibition of this receptor by the A2A receptor antagonist ZM‐241385 could not prevent the recAP‐mediated protection, whereas A2A receptor stimulation by the agonist CGS‐21680 had no effect on the LPS‐induced inflammatory response (Supplemental Figure 2). This suggests that recAP exerts its renal protective effect primarily through removal of ATP and ADP rather than enhanced A2A receptor signalling (Figure 6).
Figure 5.
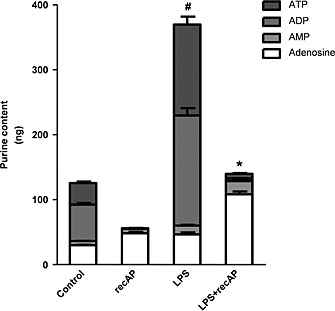
The effect of recAP on LPS‐induced ATP and ADP release in vitro. CiPTEC were pretreated with recAP (10 U mL−1) followed by incubation with LPS (100 µg mL−1) in Krebs–Henseleit buffer containing 10 mM HEPES (pH 7.4). After 20 min, supernatant was collected to determine the purine content by HPLC. Control cells were incubated with buffer. Data are expressed as mean ± SEM (n = 5), # P < 0.05 compared with control, * P < 0.05 compared with LPS. RecAP, recombinant alkaline phosphatase.
Table 3.
Adenosine receptor gene expression levels in ciPTEC
| Ct values | Fold increase (2^ΔΔCt) | |||||||
|---|---|---|---|---|---|---|---|---|
| Control | LPS | recAP | recAP + LPS | Control | LPS | recAP | recAP + LPS | |
| A1 | 28.9 [28.4–30.6] | 29.5 [29.3–30.1] | 28.9 [28.1–29.8] | 29.6 [28.9–29.9] | 1 ± 0 | 0.6 ± 0.1 | 1.2 ± 0.2 | 0.7 ± 0.1 |
| A2A | 31.5 [30.6–33.0] | 29.2 [29.0–30.4] | 32.1 [31.4–32.8] | 30.1 [29.4–30.3] | 1 ± 0 | 4.1 ± 0.4# | 0.8 ± 0.1 | 2.9 ± 0.2#, * |
| A2B | 27.9 [27.1–29.3] | 27.9 [27.7–28.8] | 28.2 [27.6–29.2] | 28.6 [27.7–28.7] | 1 ± 0 | 0.8 ± 0.1 | 0.8 ± 0.1 | 0.7 ± 0.1 |
| A3 | 36.3 [35.9–36.8] | 35.9 [35.4–36.7] | 36.9 [36.3–37.8] | 36.8 [35.7–38.1] | 1 ± 0 | 0.6 ± 0.2 | 1.3 ± 0.4 | 0.6 ± 0.1 |
Data are expressed as mean ± SEM, and median [25th percentile, 75th percentile], depending on the distribution of each parameter. Significant differences of the fold increase were estimated using one‐way ANOVA with Bonferroni post‐test. n = 5.
P < 0.05 compared with placebo
P < 0.05 compared with LPS.
Figure 6.
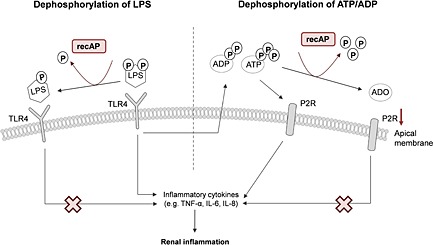
Proposed renal protective mechanism of recAP. LPS binds to TLR4, expressed on the apical membrane of proximal tubule epithelial cells, provoking an inflammatory response resulting in the release of pro‐inflammatory cytokines and ADP and ATP. Both purines signal through purine P2 receptors (P2R), resulting in several inflammatory effects further enhancing the pro‐inflammatory cascade. RecAP can dephosphorylate and thereby detoxify LPS by removal of one phosphate group. This results in an LPS molecule, which can still bind to TLR4 but cannot activate the inflammatory cascade, reducing renal inflammation. Also, recAP can dephosphorylate ATP and APD into adenosine (ADO), which may bind to adenosine receptors resulting in tissue‐protective and anti‐inflammatory effects. RecAP, recombinant alkaline phosphatase.
Discussion and conclusions
In this study, a direct protective effect of recAP during LPS‐induced renal inflammation was demonstrated in vivo and in vitro. First, the renal protective effect of recAP was confirmed in rats, which were protected from LPS‐induced renal damage by recAP. These findings corroborate the results of two phase‐II clinical trials, which demonstrated that bovine IAP treatment resulted in a swifter recovery of renal function and less urinary excretion of markers of tubular injury in patients with sepsis‐associated AKI (Heemskerk et al., 2009; Pickkers et al., 2012). Second, recAP provided protection during the LPS‐induced cytokine response in ciPTEC. Our results suggest that these effects can be attributed to the dephosphorylating nature of recAP, as enzymatically inactive recAP had no effect.
In our rat model, renal dysfunction after LPS administration was proven by increased FITC‐sinistrin half‐life, that is, decreased GFR, as well as increased fractional urea excretion. These effects were counteracted by recAP treatment. Half‐life was determined reliably by transcutaneous measurement, allowing renal function to be determined in freely moving, awake, animals sequentially, and is therefore superior to currently used methods like creatinine clearance (Schock‐Kusch et al., 2009; Devarajan, 2011; Schock‐Kusch et al., 2011). In the complex pathogenesis of sepsis‐associated AKI, the interaction between LPS and TLR4, specifically present on PTEC, induces a local inflammatory response within the kidney, which leads the development of AKI (Good et al., 2009). To investigate if recAP can affect this pathway, we mimicked LPS‐induced renal inflammation in our human ciPTEC model and could demonstrate a recAP‐mediated decrease in the LPS‐induced cytokine production of TNF‐α, IL‐6 and IL8. These effects were not restricted to solely LPS‐induced inflammation, because recAP attenuated the TNF‐α‐induced cytokine response as well. According to earlier findings, calf IAP incubation with TNF‐α does not result in free phosphate release (Chen et al., 2010), suggesting the presence of another target molecule of recAP in addition to TNF‐α.
Intracellular ATP is a vital source of energy essential for several functions, including membrane transport. ATP levels within the cell are tightly regulated and transport to the extracellular compartment is low, but may occur through, for example, ion channels, exocytosis and gap junction hemichannels (Solini et al., 2015). Under pathophysiological conditions, induced by, for example, inflammation or hypoxia, extracellular ATP release is enhanced and binding to the purine P2X and P2Y receptors can accelerate inflammation and tissue injury through NLRP3 inflammasome activation and the attraction of phagocytes and inflammatory cells (Eltzschig et al., 2012). Also, ATP‐P2 receptor signalling is suggested to have an important role during the development and progression of several kidney diseases, including diabetic nephropathy, glomerulonephritis, kidney allograft rejection and polycystic kidney disease (Solini et al., 2015). As inflammation is of major importance in the pathogenesis of these nephropathies and LPS can enhance ATP release, as demonstrated in macrophages (Hasko and Pacher, 2008), dephosphorylation of ATP in addition to LPS may potentially be an effective therapeutic approach. The capacity of recAP to dephosphorylate both molecules was demonstrated previously in vitro (Kiffer‐Moreira et al., 2014). Here, we provide additional evidence in a human renal cell line in which recAP pretreatment rapidly converted the LPS‐induced cellular release of not only ATP but also ADP, into the cytoprotective adenosine within 20 min after LPS stimulation. ADP is known to be released during cellular distress and enhances inflammation through platelet activation via P2 receptor signalling (Eltzschig et al., 2012). The recAP‐mediated dephosphorylation of ATP and ADP most likely also explains the reduction of IL‐6 and IL‐8 when only recAP was administered. As ATP release upon LPS incubation peaks within 20 min, and recAP stills provides protection when administered 2 h after LPS administration, we believe that dephosphorylation of both compounds contributes to the cytoprotective effect of the enzyme. This is supported by the finding that LPS, but not monophosphorylated lipid A, is a substrate for human placental AP (Bentala et al., 2002). As recAP was developed by replacing the crown domain of a human intestinal AP with the crown domain of human placental AP, recAP most likely also discriminates between di‐ and monophosphorylated lipid A (Kiffer‐Moreira et al., 2014).
Adenosine, derived from ATP and ADP hydrolysis, exerts renal protective and anti‐inflammatory effects through binding to the A1, A2A, A2B and A3 receptors (Yap and Lee, 2012). In ciPTEC, LPS‐treatment increased the expression levels of the A2A receptor, which was attenuated by recAP co‐treatment. The finding that inhibition of this receptor could not prevent the recAP‐mediated protection, whereas A2A receptor stimulation had no effect on the LPS‐induced inflammatory response, suggests that recAP exert its renal protective effect primarily through removal of ATP and ADP rather than enhanced adenosine formation. Probably, the reduction in A2A receptor expression levels by recAP co‐treatment is a reflection of the attenuated inflammatory response (Eltzschig et al., 2012). In contrast to the in vitro data, LPS tended to reduce the expression of all four adenosine receptors in vivo. This finding could be explained by the differences in the distribution of adenosine receptors within the kidney. In vitro, we were able to determine the effects of LPS on PTEC solely; whereas in vivo, the complete organ was evaluated, with adenosine receptors present on glomeruli, arterioles and various parts of the tubular and collecting duct system (Vallon et al., 2006). This, together with inter‐species differences and a different experimental set‐up, does not allow a direct translation of these results.
During systemic inflammation, circulating levels of endogenous AP are depleted (Bentala et al., 2002), whereas renal injury results in decreased AP enzyme activity levels on the brush‐border membranes in the kidney (Khundmiri et al., 1997). RecAP treatment could not prevent LPS‐induced cytokine release by human peripheral blood mononucleated cells, while recAP did show protective effects in the ciPTEC, which may suggest that the beneficial effects of recAP treatment could be limited to the kidney. This is in contrast to earlier findings, which showed that the systemic effects of bovine IAP were mediated by reducing circulating levels of C‐reactive protein, IL‐6 and LPS‐binding protein in patients with sepsis‐associated AKI (Pickkers et al., 2012). However, our results support the finding that bovine IAP could not prevent or cure sepsis itself (Heemskerk et al., 2009). RecAP treatment could prevent the LPS‐induced increases in urinary KIM‐1 excretion and renal protein and gene expression levels. These results are in accordance with the results of the phase‐II trials, showing that bovine IAP treatment reduced the urinary excretion of proximal tubule injury markers KIM‐1 and glutathione S‐transferase (GST)‐A1. During AKI, KIM‐1 is readily upregulated, and the protein is transferred to the proximal tubule apical membrane (Bonventre, 2008). In contrast, recAP treatment could not prevent the LPS‐induced urinary NGAL excretion and renal protein levels in rats but did prevent the increase in renal gene expression levels. NGAL production by both proximal and distal tubules is significantly increased by ischaemic, septic or nephrotoxic injury, resulting in enhanced secretion of the marker into plasma and urine (Peacock et al., 2013). As NGAL is derived from multiple segments of the tubule, and can be released systemically from other organs as well, it appears plausible that the protective effects of recAP are less pronounced compared with KIM‐1. In addition, in humans, the excretion of the distal tubule injury marker GST‐P1 was not attenuated by bovine IAP. Together, these findings suggest that the protective effects specifically take place in the proximal segment. In vivo, LPS injection results in systemic inflammation, but does not completely reflect human sepsis as it only mimics a Gram‐negative bacterial part. Thereby, our model presented as relatively mild AKI, with a full recovery of GFR within 24 h for all groups. Whether the protective effects of recAP can be observed in a more severe form of septic AKI is currently being investigated in a large multicentre phase II clinical trial (Clinical Trial Register number: NCT02182440).
In summary, we are the first to show that recAP's mechanism of action in the pathogenesis of sepsis‐associated AKI encompasses a dual mode of action and that recAP is a suitable replacement for bovine IAP. LPS triggers the inflammatory cascade by binding to TLR4 on the apical membrane of PTEC, resulting in the release of several inflammatory mediators, including ATP and ADP, which further enhance the pro‐inflammatory cascade through purine P2 receptor signalling. RecAP dephosphorylates ATP and ADP into adenosine, thereby providing protective effects by attenuating P2 receptor activation. In addition, recAP possibly dephosphorylates, and thereby detoxifies, LPS, preventing activation of TLR4. These results explain the observed attenuated AKI in sepsis patients, supporting the notion that recAP is a promising treatment for these patients. Our observation that the renal protective effects of recAP were not restricted to LPS‐induced inflammation may pave the way for investigating beneficial effects of recAP treatment for other inflammatory‐based nephropathies.
Author contributions
S. H., N. G., P. P. and R. M. contributed to the conception or design of the work. E. P., S. G., M. J. W., A. B., B. K. and R. M. contributed to the acquisition, analysis or interpretation of data for the work. E. P. drafted the manuscript. S. G., S. H., M. J. W., A. B., B. K., N. G., P. P. and R. M. revised the manuscript. All authors have read and approved submission of this manuscript and take full responsibility for the manuscript.
Conflict of interest
P P has received speaking and consultation fees from AM‐Pharma, which is developing the bovine IAP and human recAP therapeutics. N G is an inventor of patents and patent applications covering the GFR measurement device, as well as founder of Mannheim Pharma & Diagnostics (distributor of FITC‐sinistrin). The remaining authors declare that they have no relevant financial interests.
Supporting information
Figure S1 LPS‐induced cytokine release through TLR4 binding.
Figure S2 Protective effect of recAP in vitro most likely not mediated through A2A receptor signalling.
Table S1 Primer/probe specifications.
Table S2 Plasma cytokines and experimental parameters in vivo 1.5 h after LPS administration.
Supporting info item
Supporting info item
Acknowledgements
We are grateful to Viktoria Skude and Isabell Moskal for their excellent technical assistance and Jochen Friedemann and Yury Shulhevich for their advice on the GFR measurements. Also, we thank Elisabeth Seelinger and Petra Schwarz for measuring urinary and plasma parameters and tissue processing, Jeanne Pertijs for performing the KIM‐1 immunostaining and Jelle Gerretsen for performing the simultaneous Luminex assay. We thank Andrea van Elsas for thoughtful discussions. We acknowledge the Department of Experimental Internal Medicine, Radboudumc, for providing the PBMCs, and we thank AM‐Pharma, Bunnik, for kindly providing us recAP and inactive recAP.
Author contributions
The financial contribution of the Dutch Kidney Foundation (EP, grant 13OKBP24; SH, grant KSTP.09.001; MJW, grant KJPB‐11.0023) is gratefully acknowledged. S. G. was supported by the FP7 Marie‐Curie ITN project: NephroTools.
Peters, E. , Geraci, S. , Heemskerk, S. , Wilmer, M. J. , Bilos, A. , Kraenzlin, B. , Gretz, N. , Pickkers, P. , and Masereeuw, R. (2015) Alkaline phosphatase protects against renal inflammation through dephosphorylation of lipopolysaccharide and adenosine triphosphate. British Journal of Pharmacology, 172: 4932–4945. doi: 10.1111/bph.13261.
References
- Alexander SP, Benson HE, Faccenda E, Pawson AJ, Sharman JL, Spedding M et al. (2013a). The concise guide to PHARMACOLOGY 2013/14: G protein‐coupled receptors. Br J Pharmacol 170: 1459–1581. [DOI] [PMC free article] [PubMed] [Google Scholar]
- Alexander SP, Benson HE, Faccenda E, Pawson AJ, Sharman JL, Spedding M et al. (2013b). The concise guide to PHARMACOLOGY 2013/14: ligand‐gated ion channels. Br J Pharmacol 170: 1582–1606. [DOI] [PMC free article] [PubMed] [Google Scholar]
- Alexander SP, Benson HE, Faccenda E, Pawson AJ, Sharman JL, Spedding M et al. (2013c). The concise guide to PHARMACOLOGY 2013/14: catalytic receptors. Br J Pharmacol 170: 1676–1705. [DOI] [PMC free article] [PubMed] [Google Scholar]
- Alexander SP, Benson HE, Faccenda E, Pawson AJ, Sharman JL, Spedding M et al. (2013d). The concise guide to PHARMACOLOGY 2013/14: enzymes. Br J Pharmacol 170: 1797–1867. [DOI] [PMC free article] [PubMed] [Google Scholar]
- Bauerle JD, Grenz A, Kim JH, Lee HT, Eltzschig HK (2011). Adenosine generation and signaling during acute kidney injury. JASN 22: 14–20. [DOI] [PubMed] [Google Scholar]
- Bentala H, Verweij WR, Huizinga‐Van der Vlag A, van Loenen‐Weemaes AM, Meijer DK, Poelstra K (2002). Removal of phosphate from lipid A as a strategy to detoxify lipopolysaccharide. Shock 18: 561–566. [DOI] [PubMed] [Google Scholar]
- Bonventre JV (2008). Kidney injury molecule‐1 (KIM‐1): a specific and sensitive biomarker of kidney injury. Scand J Clin Lab Invest Suppl 241: 78–83. [DOI] [PubMed] [Google Scholar]
- Case J, Khan S, Khalid R, Khan A (2013). Epidemiology of acute kidney injury in the intensive care unit. Crit Care Res Pract 2013: 2013: 479730. [DOI] [PMC free article] [PubMed] [Google Scholar]
- Chen KT, Malo MS, Moss AK, Zeller S, Johnson P, Ebrahimi F et al. (2010). Identification of specific targets for the gut mucosal defense factor intestinal alkaline phosphatase. American journal of physiology . Gastrointest Liver Physiol 299: G467–G475. [DOI] [PMC free article] [PubMed] [Google Scholar]
- Cohen J (2002). The immunopathogenesis of sepsis. Nature 420: 885–891. [DOI] [PubMed] [Google Scholar]
- Devarajan P (2011). Biomarkers for the early detection of acute kidney injury. Curr Opin Pediatr 23: 194–200. [DOI] [PMC free article] [PubMed] [Google Scholar]
- Di Sole F (2008). Adenosine and renal tubular function. Curr Opin Nephrol Hypertens 17: 399–407. [DOI] [PubMed] [Google Scholar]
- Eltzschig HK, Eckle T (2011). Ischemia and reperfusion—from mechanism to translation. Nat Med 17: 1391–1401. [DOI] [PMC free article] [PubMed] [Google Scholar]
- Eltzschig HK, Sitkovsky MV, Robson SC (2012). Purinergic signaling during inflammation. N Engl J Med 367: 2322–2333. [DOI] [PMC free article] [PubMed] [Google Scholar]
- Goldberg R, Dennen P (2008). Long‐term outcomes of acute kidney injury. Adv Chronic Kidney Dis 15: 297–307. [DOI] [PubMed] [Google Scholar]
- Good DW, George T, Watts BA III (2009). Lipopolysaccharide directly alters renal tubule transport through distinct TLR4‐dependent pathways in basolateral and apical membranes. American journal of physiology . Ren Physiol 297: F866–F874. [DOI] [PMC free article] [PubMed] [Google Scholar]
- Grenz A, Bauerle JD, Dalton JH, Ridyard D, Badulak A, Tak E et al. (2012). Equilibrative nucleoside transporter 1 (ENT1) regulates postischemic blood flow during acute kidney injury in mice. J Clin Invest 122: 693–710. [DOI] [PMC free article] [PubMed] [Google Scholar] [Retracted]
- Hasko G, Pacher P (2008). A2A receptors in inflammation and injury: lessons learned from transgenic animals. J Leukoc Biol 83: 447–455. [DOI] [PMC free article] [PubMed] [Google Scholar]
- Heemskerk S, Masereeuw R, Moesker O, Bouw MP, van der Hoeven JG, Peters WH et al. (2009). Alkaline phosphatase treatment improves renal function in severe sepsis or septic shock patients. Crit Care Med 37: 417–423, e411. [DOI] [PubMed] [Google Scholar]
- Ince C (2005). The microcirculation is the motor of sepsis. Crit Care 9 (Suppl 4): S13–S19. [DOI] [PMC free article] [PubMed] [Google Scholar]
- Kalakeche R, Hato T, Rhodes G, Dunn KW, El‐Achkar TM, Plotkin Z et al. (2011). Endotoxin uptake by S1 proximal tubular segment causes oxidative stress in the downstream S2 segment. JASN 22: 1505–1516. [DOI] [PMC free article] [PubMed] [Google Scholar]
- Khundmiri SJ, Asghar M, Khan F, Salim S, Yusufi AN (1997). Effect of reversible and irreversible ischemia on marker enzymes of BBM from renal cortical PT subpopulations. Am J Physiol 273 (6 Pt 2): F849–F856. [DOI] [PubMed] [Google Scholar]
- Kiffer‐Moreira T, Sheen CR, Gasque KC, Bolean M, Ciancaglini P, van Elsas A et al. (2014). Catalytic signature of a heat‐stable, chimeric human alkaline phosphatase with therapeutic potential. PLoS One 9: e89374. [DOI] [PMC free article] [PubMed] [Google Scholar]
- Kilkenny C, Browne W, Cuthill IC, Emerson M, Altman DG, Group NCRRGW (2010). Animal research: reporting in vivo experiments: the ARRIVE guidelines. Br J Pharmacol 160: 1577–1579. [DOI] [PMC free article] [PubMed] [Google Scholar]
- McGrath JC, Drummond GB, McLachlan EM, Kilkenny C, Wainwright CL (2010). Guidelines for reporting experiments involving animals: the ARRIVE guidelines. Br J Pharmacol 160: 1573–1576. [DOI] [PMC free article] [PubMed] [Google Scholar]
- Moghadasali R, Mutsaers HA, Azarnia M, Aghdami N, Baharvand H, Torensma R et al. (2013). Mesenchymal stem cell‐conditioned medium accelerates regeneration of human renal proximal tubule epithelial cells after gentamicin toxicity. Exp Toxicol Pathol 65: 595–600. [DOI] [PubMed] [Google Scholar]
- Pawson AJ, Sharman JL, Benson HE, Faccenda E, Alexander SP, Buneman OP et al. (2014). The IUPHAR/BPS guide to PHARMACOLOGY: an expert‐driven knowledgebase of drug targets and their ligands. Nucleic Acids Res 42: D1098–D1106. [DOI] [PMC free article] [PubMed] [Google Scholar]
- Peacock WF, Maisel A, Kim J, Ronco C (2013). Neutrophil gelatinase‐associated lipocalin in acute kidney injury. Postgrad Med 125: 82–93. [DOI] [PubMed] [Google Scholar]
- Peters E, Heemskerk S, Masereeuw R, Pickkers P (2014). Alkaline phosphatase: a possible treatment for sepsis‐associated acute kidney injury in critically III patients. Am J Kidney Dis 63: 1038–1048. [DOI] [PubMed] [Google Scholar]
- Pickkers P, Heemskerk S, Schouten J, Laterre PF, Vincent JL, Beishuizen A et al. (2012). Alkaline phosphatase for treatment of sepsis‐induced acute kidney injury: a prospective randomized double‐blind placebo‐controlled trial. Crit Care 16: R14. [DOI] [PMC free article] [PubMed] [Google Scholar]
- Romanovsky A, Morgan C, Bagshaw SM (2014). Pathophysiology and management of septic acute kidney injury. Pediatr Nephrol 29: 1–12. [DOI] [PubMed] [Google Scholar]
- Schock‐Kusch D, Sadick M, Henninger N, Kraenzlin B, Claus G, Kloetzer HM et al. (2009). Transcutaneous measurement of glomerular filtration rate using FITC‐sinistrin in rats. Eur Nephrol Dial Transpl Assoc 24: 2997–3001. [DOI] [PubMed] [Google Scholar]
- Schock‐Kusch D, Xie Q, Shulhevich Y, Hesser J, Stsepankou D, Sadick M et al. (2011). Transcutaneous assessment of renal function in conscious rats with a device for measuring FITC‐sinistrin disappearance curves. Kidney Int 79: 1254–1258. [DOI] [PubMed] [Google Scholar]
- Solini A, Usuelli V, Fiorina P (2015). The dark side of extracellular ATP in kidney diseases. J Am Soc Nephrol 26: 1007–1016. [DOI] [PMC free article] [PubMed] [Google Scholar]
- Vallon V, Muhlbauer B, Osswald H (2006). Adenosine and kidney function. Physiol Rev 86: 901–940. [DOI] [PubMed] [Google Scholar]
- Weinberg JM, Venkatachalam MA (2012). Preserving postischemic reperfusion in the kidney: a role for extracellular adenosine. J Clin Invest 122: 493–496. [DOI] [PMC free article] [PubMed] [Google Scholar]
- Wilmer MJ, Saleem MA, Masereeuw R, Ni L, van der Velden TJ, Russel FG et al. (2010). Novel conditionally immortalized human proximal tubule cell line expressing functional influx and efflux transporters. Cell Tissue Res 339: 449–457. [DOI] [PMC free article] [PubMed] [Google Scholar]
- Yap SC, Lee HT (2012). Adenosine and protection from acute kidney injury. Curr Opin Nephrol Hypertens 21: 24–32. [DOI] [PMC free article] [PubMed] [Google Scholar]
Associated Data
This section collects any data citations, data availability statements, or supplementary materials included in this article.
Supplementary Materials
Figure S1 LPS‐induced cytokine release through TLR4 binding.
Figure S2 Protective effect of recAP in vitro most likely not mediated through A2A receptor signalling.
Table S1 Primer/probe specifications.
Table S2 Plasma cytokines and experimental parameters in vivo 1.5 h after LPS administration.
Supporting info item
Supporting info item