

Abstract
Size is a key feature of any organism since it influences the rate at which resources are consumed and thus affects metabolic rates. In the 1930s, size-dependent relationships were codified as “allometry” and it was shown that most of these could be quantified using the slopes of log-log plots of any 2 variables of interest. During the decades that followed, physiologists explored how animal respiration rates varied as a function of body size across taxa. The expectation was that rates would scale as the 2/3 power of body size as a reflection of the Euclidean relationship between surface area and volume. However, the work of Max Kleiber (1893–1976) and others revealed that animal respiration rates apparently scale more closely as the 3/4 power of body size. This phenomenology, which is called “Kleiber's Law,” has been described for a broad range of organisms, including some algae and plants. It has also been severely criticized on theoretical and empirical grounds. Here, we review the history of the analysis of metabolism, which originated with the works of Antoine L. Lavoisier (1743–1794) and Julius Sachs (1832–1897), and culminated in Kleiber's book The Fire of Life (1961; 2. ed. 1975). We then evaluate some of the criticisms that have been leveled against Kleiber's Law and some examples of the theories that have tried to explain it. We revive the speculation that intracellular exo- and endocytotic processes are resource delivery-systems, analogous to the supercellular systems in multicellular organisms. Finally, we present data that cast doubt on the existence of a single scaling relationship between growth and body size in plants.
Keywords: aerobic metabolism, Kleiber's Law, metabolic rate, oxygen uptake
Introduction
In 1789, two French chemists, Antoine Laurent Lavoisier (1743–1794) and Armand Séguin (1767–1835) performed a series of seminal experiments that revolutionized the emerging natural sciences. Assisted by Lavoisier's wife Marie-Anne-Pierette (1758–1836), the research team set up a device to measure the oxygen consumption of a resting human being (Fig. 1) and discovered that physical activity, as well as the digestion of food, enhances the rate of oxygen uptake.1 These studies were among the first attempts to quantify what we today call the basal metabolic rate of a living being. To the best of our knowledge, Lavoisier and Séguin did not relate their oxygen uptake measurements to the body mass of the subject. However, Lavoisier's earlier combustion experiments led to the unequivocal conclusion that both the burning of a candle and the respiratory activity of an animal removed oxygen from the air, a gas he thought of as a chemical element. Hence, Lavoisier concluded in 1780 that metabolism is a natural “internal burning-process” involving the consumption of “live-supporting air” (oxygen, O2) and the release of “fixed air” (carbon dioxide, CO2). Later, he interpreted these findings in the light of his oxygen-theory of combustion. Based on this and many other insights, Lavoisier became one of the founders of modern “anti-phlogistonistic” chemistry, which subsequently gave rise to the physiological sciences.1
Figure 1.

Lavoisier's classical experiment to measure metabolic activity (oxygen uptake) of a resting human being (Armand Séguin). The experimenter (Antoine L. Lavoisier) is handling the respirometer, and his wife (Marie-A.-P. Lavoisier) is writing down the protocol (adapted from a drawing of M.-A.-P. Lavoisier, 1790).
Decades later, the German biologist Eduard Pflüger (1829–1910) discovered that the cells of the body are the sites of biological oxidation, and that the blood transfers O2. Cell respiration was found to be a feature of all living beings (animals and plants), or, as the botanist Julius Sachs (1832–1897) put it, the “combustion of organic substances that provides the energetic basis for the workings of the cells”2 (Fig. 2). Based on these insights, Max Rubner (1854–1932) analyzed the relationship between metabolic activity and body mass in mammals. In 1883, he discovered that mass-specific metabolic rate was ca. 2.5-fold higher in small compared to large dogs, and suggested that a slow metabolism may increase an animal's longevity.4 This discovery gave rise to a new area of physiological research that dealt with the relationship between body mass and metabolic activity, which is the subject of the present contribution.
Figure 2.

Apparatus for the documentation and quantification of the respiratory activity of plants (seedlings of wheat, rye, beans or peas) in darkness, as used by Julius Sachs in 1865 and other investigators. The carbon dioxide (CO2) is absorbed by “Barytwasser” (a solution of Ba (OH)2), and can be quantified by gravimetric methods (adapted from Sachs, 1865) (ref.2).
The goal of this paper, which marks the 40th anniversary of the publication of the 2nd (definitive) Edition of Kleiber's book, is to discuss this discovery in the context of more recent lines of speculation regarding the scaling of body mass with respect to metabolic activity. In contrast to previous contributions to this topic, we place a greater emphasis on plant biology as opposed to animal physiology. Our rationale for this emphasis is twofold. First, any valid theory purporting to explain the scaling of body mass with respect to metabolic activity must apply equally to plants as well as to animals, and, second, the literature dealing with this scaling relationship is zoocentric (as can be seen by inspecting much of the primary literature cited in this review).
Kleiber's Law: Animals vs. Plants
The size of every organism is intimately correlated with a host of physiological, morphological, anatomical, and life history functional traits in complex but quantifiable ways. Famous biologists, such as Julian Huxley (1887–1975), have sought for a theoretical (mechanistic) explanation for these size-dependent relationships, and 3 major books authored by Francis G. Benedict (1870–1957), Samuel Brody (1889–1956) and Max Kleiber (1893–1976) summarize the state of the art during subsequent decades of ongoing research into the scaling relationship between the basal metabolic rate (B) and the body mass (M) of animals.5-7
The best known of these scaling relationships is called “Kleiber's Law,” which is described in detail in the book The Fire of Life (1961; 2. ed. 1975). The rule is named in honor of the Swiss/American agricultural scientist Max Kleiber (1893–1976), whose research in the early 1930s indicated that, for the vast majority of mammals, basal metabolic rate B increases as the 3/4 power of total body mass M, i.e.,
where β is a normalization constant.7-10 Thus, according to Kleiber's Law, any animal with a body mass of 150 g will have a basic metabolic rate that is approximately 7.6 times greater than that of an animal with a body mass of 10 g, i.e., metabolic activity of a small organism is, relative to its body size, much higher (Fig. 3).
Figure 3.

According to Kleiber's Law, metabolism equals mass raised to the 3-quarter power. The so-called “mouse-to-cattle-curve” depicts the relationship between basal metabolic rates and the corresponding body masses of the birds and mammals investigated (adapted from Kleiber).8
One of the many explanations for Kleiber's Law is that small animals respire more per unit of body mass than larger animals because a larger fraction of their body mass consists of metabolically active tissues that have higher maintenance costs as opposed to reserve tissues that consume comparatively lower resources.
Although this is a reasonable explanation for birds and mammals, it does not explain why the growth rates G of unicellular algae and multicellular plants (Fig. 4A) scale nearly as the 3/4 of dry body mass Md, i.e., G = β0 Md3/4, where β0 is another normalization constant (Fig. 4B). Nor does it explain why the respiration rates R of small multicellular plants scale nearly one-to-one with body mass, R = β1 M≈1.0, where β1 is yet another normalization constant.10,11 This topic is discussed in the next section.
Figure 4.

Photoautotrophic eukaryotic organisms: Unicellular algae, herbs, and trees (A). A bivariate plot of log10-transformed data for annual growth in dry mass and standing dry body mass (original units: kg per organism per year and kg, respectively) (B). The slope of the log-log regression curve (using Model Type II regression protocols) is 0.746. The data are taken from refs. 37 and 48.
The WBE-Theory
Interest in these and other scaling relationships has experienced a renaissance in the last few years, particularly in the quest to find a mechanistic explanation for size-dependent phenomena. As might be expected, the rapid growth in this area of research has not been easy or lacking in debate. Pre-existing data sets have been subjected to intense empirical re-analyses, whereas meta-data analyses of the primary literature have sought new data for a host of functional plant and animal traits. Some of these analyses have called into question previously reported scaling relationships (in part because of debates over the most appropriate statistical protocols). Others have even called into question whether Kleiber's 3/4 Law is actually true. By the same token, much of the debate over theoretical explanations has focused largely on the theory proposed by Geoffrey West, James Brown, and Brian Enquist (henceforth called the WBE theory)3,11-13 and its subsequent re-incarnations.14-17 This theory attempts to explain why so many scaling relationships appear to be governed by 1/4 power rules or multiples thereof with reference to the geometry of internal resource-transport networks. Workers have repeatedly subjected the WBE theory to empirical scrutiny. Some have confirmed several of the predictions of this theory, whereas others have rejected the WBE theory entirely, either on theoretical or empirical grounds.
We cannot provide a canonical answer as to whether the WBE theory is correct, since its conceptualization is being refined and modified on a yearly basis, and because a biological “law” or “theory” is a matter of its relative frequency of occurrence, which requires persistent empirically enquiries. Rather, in the following sections, we provide a few examples of scaling relationships using data from algae and land plants (the embryophytes), and we outline the merits and distractions of scaling analyses in terms of theoretical and empirical studies. As noted, we focus on data from the algae and the land plants, because much of the literature treating scaling relationships focuses on animals. The algae and the embryophytes provide exceptionally diverse out-group comparisons to heterotrophic organisms (see Fig. 4A).
In the next section, we explore the phenomenology of surface area versus volume since this holds true for all organisms, regardless of morphology, their physiology or morphology, and because it illustrates the basic structure of scaling relationships.
The Scaling of Surface Area and Volume
Many aspects of Kleiber's Law revolve around the relationship between an organism's surface area and its volume. Here, we show that the relationship between these 2 variables of interest should be governed by a 2/3 scaling exponent provided that the organism conforms to the dictates of a Euclidean object, but that the exponent can fall in theory anywhere between 2/3 and 1.0.
This statement is shown to be true by noting that surface area S is proportional to the square of any linear dimension of reference L, whereas volume V is proportional to the cube of the same reference dimension. In symbols, S ∝ L2 and V ∝ L3, respectively. It follows, therefore, that L ∝ S1/2 and L ∝ V1/3 such that S1/2 ∝ V1/3, or simply S ∝ V2/3. Accordingly, the increase in the surface area of a Euclidean object fails to increase one-to-one as its volume increases. Examples of Euclidean objects are artificially constructed protoplasts, which have the shape of a “naked” plant cell without wall (i.e., the protoplasmic content, surrounded by the plasma membrane, and cultivated in nutrient solution, (Fig. 5A). In the absence of an external or internal constraining mechanism, such as a cell wall or a cytoskeletal architecture, a cell will minimize its surface area with respect to its volume and thus become spherical. Hence, they must obey the proportionalities S ∝ R2 and V ∝ R3, where R is radius, from which it follows that S ∝ V2/3 (Fig. 5B).
Figure 5.

Protoplast isolated from the leaf cells of a broad bean (Vicia faba) plant (A) (original photograph). A bivariate plot of log10–transformed data for the surface area and volume (original units: µm2 and µm3, respectively) of unicellular algae and of unicellular animals and animal protoplasts. The slopes of the log-log regression curves (using Model Type II regression protocols) are indicated (B). (The data are taken from the primary literature.)
A spherical cell can be altered into a zeppelin-like prolate spheroid or a lozenge-like oblate spheroid by placing it in tension or compression, respectively. Similarly, many unicellular plants and animals conform to these geometries by virtue of possessing an anisotropic cell wall or cytoskeleton. Importantly, with the exception of a sphere, every other geometry can change shape as it increases in size because every other geometric form has at least 2 reference dimensions that can be altered either together or separately. Therefore, all geometric forms other than the sphere has the ability to violate the 2/3 surface area vs. volume scaling relationship because its shape can be altered. For example, the curved surface area and the volume of a circular cylinder are given by the formulas S = 2πRL and V = πR2L, where L is now length. Therefore, we see that S ∝ V/R, which means that the surface area of a circular cylinder can increase one-to-one with increasing volume provided that R remains constant. This can be achieved by elongation to produce a progressively more slender cylinder. If, however, a cylinder does not change shape as it increases in size, it must obey the 2/3 rule. The same is true for any non-spherical geometry. Therefore, the exponent (denoted here by α) governing the relationship between surface area and volume can range anywhere between 2/3 and 1.0, or, in mathematical form, S ∝ V2/3≤ α ≤ 1/1.
The preceding may seem irrelevant and trivial from a biological perspective until we inspect a log-log bivariate plot of surface area versus cell volume for isolated cells and unicellular plants and animals (Fig. 5B). As predicted, the surface area of animal as well as plant protoplasts increases as the 2/3 power of cell volume. In contrast, the surface area of unicellular algae increases at a significantly greater rate with increasing cell volume. Indeed, the scaling of S with respect to V is governed by an exponent that is indistinguishable from 3/4. This scaling exponent indicates that cells change shape as they grow in size or that shape changes across different species of unicellular algae differing in size, or both. Indeed, the smallest species represented in Fig. 4B are nearly spherical, the species of intermediate sizes are either oblate or prolate spheroids, and the largest species are disks or circular cylinders (Fig. 5B). The fact that the largest unicellular species are cylinders is interesting for 2 reasons. First, as noted, a cylinder can maintain the same surface area with respect to its volume, provided its radius is constant as it elongates in length, and, second, the simplest multicellular algal body plan is an unbranched filament. By adding more cells to a filament, overall body size can increase indefinitely without reducing surface area with respect to volume provided that all cells maintain the same uniform diameter.
The 3/4 Scaling of Metabolic Rates
Far more interesting is why the scaling exponent governing the surface area vs. volume relationship is closer to 3/4 than to one. Recall that, in theory, the numerical value of the surface area – volume relationship can range between 2/3 and 1.0. The maximization of the scaling exponent would maximize the ability to exchange mass and energy with the external environment, and it would proportionally minimize the respective resources required for growth and reproduction. We can easily conceive of circumstances where minimizing surface area is beneficial, as for example plants living in arid and hot habitats, or animals living in cold environments. However, the data shown in Fig. 4B are drawn from unicellular algae that are not subjected to dehydration, or particularly high or low temperatures. As in the case of the 3/4 scaling exponent governing annual growth with respect to body mass, the data for algae are from cells growing under near optimal conditions from which we may infer that these 3/4 scaling exponents are the best that these organisms can perform.
A number of theories have been proposed to explain these and other phenomenologies that appear to be governed by 1/4 and multiples of 1/4 power “rules.” Here, we will only consider 3 of them to illustrate the diversity and the pitfalls of theoretical approaches.
The first comes from a geometric perspective. If cells and organisms are non-Euclidian (as the scaling of the surface area and volume seems to indicate), they must exist in a higher dimensional state. Using analytical geometry, Blum18 argued thus and adduced that the surface area for any n–dimensional object is proportional to its volume raised to the (n – 1)/n power. Thus, for any Euclidean 3-dimensional object, S ∝ V(n–1)/n ∝ S ∝ V(3–1)/3 ∝ V2/3, whereas, for a 4-dimensional object, S ∝ V(4 – 1)/4 ∝ V¾. On the surface, this explanation has some appeal, particularly if one considers that every cell or organism has an internal surface area in the form of interior membrane-bound vesicles.
However, a little reflection shows that the surface area for a n–dimensional object is not proportional to its volume raised to the (n – 1)/n power because if this were so the surface area of a 2-dimensional object would scale as the ½ power of its volume. Yet, a 2-dimensional object has no volume. This dilemma emerges because the (n – 1)/n rule relates the number of an object's dimensional attributes (length, area, and volume) to the number of its dimensions. For example, a 2-dimensional object has 2 attributes (length and area), whereas a 3-dimensional object has 3 attributes (length, area, and volume). The problem with using the (n – 1)/n rule is that the terms “area” and “volume” are used incorrectly, e.g., “area” does not mean “the second dimensional attribute” but rather “the next to the highest dimensional attribute”.19 Put in precise terms, (n – 1)/n “equals the number of attributes” and n “equals the number of dimensions.”
The second approach to explaining why quarter power scaling rules emerge comes from biomechanics. For example, McMahon20-21 argued that animal and plant size is restrained by Euler's critical buckling law, which states that the critical mass M causing a bone or a trunk to buckle is proportional to flexural stiffness EI divided by length raised to the third power, i.e., M ∝ EI/L3. Noting that M ∝ LD2 and that I ∝ D4, it follows that L ∝ D2/3 and that V ∝ D8/3. The first of these proportional relationships is known as the elastic self-similarity rule. Any animal limb or plant stem that abides by this 2/3 scaling rule will maintain the same deflection from the vertical regardless of how long it grows. McMahon argued further that the power output of muscles (and thus all associated metabolic rates such as B) is proportional to muscle mass squared and that mass is directly proportional to volume.20 If true, metabolic rates must scale as the 3/4 power of mass, i.e., B ∝ (M3/8)2 ∝ M3/4, which is the rule, as proposed by Kleiber (Fig. 3).7-10
Unfortunately, this elegant derivation suffers from 2 fatal flaws. First, it predicts that surface area will scale as the 5/8 power of volume, and, second, the derivation applies only to terrestrial organisms. Thus, it cannot explain the 3/4 scaling relationship for surface area and volume, and it cannot explain why aquatic plants appear to share the same metabolic scaling relationships as terrestrial animals. It is obvious as well as perhaps trivial to mention that plants lack muscles.
The Metabolic Theory of Ecology
The third and last approach to obtaining Kleiber's rule is illustrated by the WBE theory, which originally was based on only 3 assumptions:
every living being contains a fractal-like resource delivery system that fills the entire interior of the organism (i.e., it is space-filling),
the terminal transport segments of the system (e.g., capillaries and plant vessel members) are size-invariant (i.e., they are uniform in diameter, length, etc.), and
the energy required to distribute resources internally is minimized (i.e., natural selection has resulted in minimizing hydrodynamic resistance).11
This theory has been repeatedly modified to the extent that it has been transfigured into what is called the metabolic theory of ecology (MTE), which incorporates the joint effects of body size and temperature on metabolic rates.11-17 The WBE and MTE have been received with both great enthusiasm and intense criticism, both theoretically and empirically.22-28 Nevertheless, it provides the most internally consistent mathematical structure and it offers an over-arching set of predictions that, on average, have received support.
Two points are worth noting. First, the available data indicate that unicellular as well as multicellular organisms comply on average with the predictions of the WBE-MTE, and, second, the WBE-MTE predict that the scaling of plant respiration will change as a function of body size. We address the first of these 2 points here and reserve the second point for the following section.
If the basic assumptions of the WBE-MTE hold true and if aerobic (O2-dependent) unicellular (eukaryotic) organisms comply with their theoretical predictions, which appears to be the case, there must be an intracellular resource delivery system in every cell that functions in much the same way the internal supracellular system does in multicellular organisms. Here, we revive the notion (see ref. 11) that this resource delivery system is the exo- and endocytic dynamics of the endomembrane system, which consists of the endoplasmic reticulum, the Golgi apparatus, and the vacuolar compartment along with all other adjoining membranes. The exocytic dynamics of this system is exemplified, in animals, by the transport of secretory proteins in pancreatic exocrine cells, which takes approximately 2 hrs.29 On the other hand, in carrot phloem parenchyma, the secretion of hydroxyproline-rich glycoproteins into the extracellular matrix takes as little as 30 minutes.30 Comparable dynamics are reported for endocytosis in protoplasts (Fig. 5A) isolated from soybean (Glycine max) plants that were exposed to cationized ferritin. Within 30 sec, coated vesicles are near the Golgi apparatus and, within 3 hrs they are located in the central vacuole.31-32
Prokaryotic cells (bacteria) have invaginated plasma membranes that provide similar services for intracellular nutrient acquisition and transport. Consequently, the intracellular dynamics of eukaryotic cells has an analog in all cells. For instance, Fakkhri et al.33 report scaling exponents between 1/4 and 1.0 for the intracellular relationship between the mean squared displacement trajectories (MSD) of tagged carbon nanotubules and the lag time t of transport, i.e., MSD ∝ t1/4-1/1.
We propose further that the balance between endo- and exocytotic transport, which is augmented by metabolism (O2)-dependent vesicular transport among intracellular components, affects the rate of cell growth and thus the scaling of metabolic rates (Fig. 6A). In actively growing cells, the rate of exocytosis exceeds that of endocytosis as the cell membrane increases in surface area. In fully-grown cells, the rate of exocytosis may be more or less equal to that of endocytosis; and, in aging cells, the rate of endocytosis likely exceeds that of exocytosis (Fig. 6B).
Figure 6.
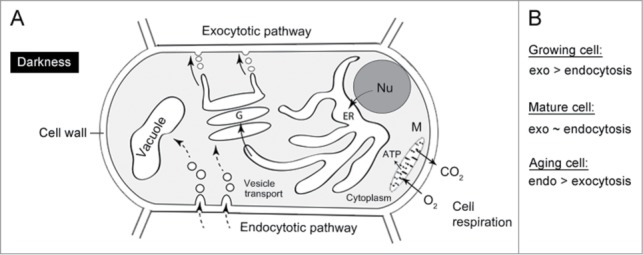
The intracellular resource delivery system in an aerobic (oxygen-consuming) eukaryotic plant cell, for instance the root (darkness) (A). The balance between endo- and exocytosis determines the rate of cell growth, which is a metabolism-driven process. ATP = Adenosine-3-Phosphate, ER = Endoplasmatic reticulum, G = Golgi apparatus, M = Mitochondrion, N = Nucleus, V = Vacuole. The relationship between exo-/endocytosis and growth (B).
The Scaling of Cellular Respiration
At the level of the individual plant or animal, the WBE–MTE predict that metabolic rates B will scale as the 3/4 power of body mass M (Fig. 2). Owing to a number of technical challenges involved in quantifying B, 3 proxies for measuring metabolic rates have been used in the case of plants:
(1) individual plant water flux per unit time, (2) individual net growth per year, and (3) individual respiration rate. Empirical data gathered from using the first method indicate that B scales approximately as M0.73 (refs. 34-36). Data gathered using the second method is generally also consistent with a 3/4 scaling relationship across a broad diversity of unicellular algae, aquatic ferns, and nonwoody and woody plants.37-38 In contrast, the third method, which involves the direct measurement of the amount of carbon released during dark respiration R (via gas exchange methods) has yielded different scaling relationships depending on plant size.39-41 Across very small seedlings and saplings, R is reported to scale isometrically with respect to body mass,39,42-44 but the scaling exponent converges on to the theoretical value of 3/4 as body size increases across older plants,40 i.e., the scaling of respiration rate with respect to plant body mass is curvilinear, particularly at the small end of the body size spectrum.
This curvilinearity is not surprising. The 3/4-prediction emerging from the WBE–MTE mathematically holds true only for infinitely sized networks (see ref. 45). The authors of the WBE theory recognized this fact.11 However, the importance of the effects of “finite size” on the numerical value of scaling exponents has only recently received attention.44 Unfortunately, even less attention has been paid to the fact that respiration rates differ among different tissues as a result of differences in the volume fractions of respiring and non-respiring cellular components.
As an example of how different tissues affect respiration rates, we turn to studies of sunflower (Helianthus annuus L.) seedlings42-44 (Fig. 7A). The respiration rates (oxygen uptake per min) and body mass (mg per individual) of seedlings were measured for plants raised in the dark (skotomorphogenesis) and for plants subsequently grown in white light (photomorphogenesis) to determine the scaling of R with respect to M. Regression analyses shows that cellular R increased non-linearly with increasing M (Fig. 7A). During imbibition of the seeds, R was ca. 7.5-fold higher than after the emergence of the cotyledons from the seed coat, which was attributed to the hypoxic conditions of the enclosed embryo.42 During late seedling development, R was found to scale roughly as R ∝ M3/7, regardless of whether plants were grown in the dark or subsequently in white light. The numerical value of 3/7 is statistically significantly different from R ∝ M1.0, which has been reported by some workers. It also differs from the expectation of the WBE–MTE (i.e., R ∝ M0.75−1.0). It is important to note, however, that the relationship between R and M is log-log nonlinear early in seedling development.
Figure 7.
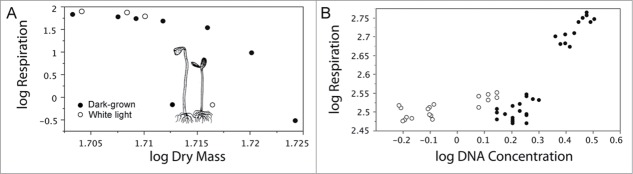
Log10–transformed data for dark respiration rates plotted as functions of dry body mass (A) and DNA concentration (B) of sunflower (Helianthus annuus) seedlings grown in the dark and in white light. Original units: nmol O2 min−1 g fresh mass−1, and milligrams DNA g fresh mass−1. The data are taken from ref. 43.
This difference was interpreted to be the result of species-specific tissue composition that affect the volume fractions of metabolically active and less active cells – a speculation that was supported by cytological and ultra-structural observations.42 This interpretation is also consistent with the fact that tissue-level DNA content correlates almost one-to-one with respiration rate43 (Fig. 7B).
Conclusions and Outlook
More than 2 centuries ago, Lavoisier proposed that, in animals, “physiological combustion” of nutrients is an O2-dependent process related to the activity pattern of the organism (human being) (Fig. 1). In 1865, Sachs2 documented the respiratory activity of plants, which were maintained in darkness (Fig. 2). Moreover, he distinguished this energy-providing “transformation of body substance, accompanied by a decline in mass under the action of oxygen” from the assimilatory process (oxygenic photosynthesis).2 Numerous studies on the relationship of metabolism vs. body mass followed, which culminated in “Kleiber's Law” (Fig. 3), which should be considered a rule that allows for exceptions.
The manner in which metabolic rates scale with respect to body size has been subjected to intense theoretical and empirical enquiry. Yet, the scaling relationship governing respiration and body size remains a matter of intense debate. What remains clear is that this relationship is ruled by an exponent that is numerically close to one across the lower part of the body size spectrum and significantly less than one across the upper part of the graph. We propose that there is sufficient evidence to speculate that this phenomenology is the result of the ontogenetic accumulation of tissues and other body constituents that either have slower growth rates (and thus lower respiratory activities) or that do not respire at all. We also propose that, at the cellular level, the balance between endo- and exocytotic transport (augmented by O2-dependent vesicular transport among intracellular components) affects the rate of cell growth, and thus the scaling of metabolic rates. In actively growing cells, the rate of exocytosis exceeds that of endocytosis as the cell membrane (as well as the surrounding wall) increases in surface area. In fully grown cells, the rate of exocytosis may be more or less equal to that of endocytosis; and, in aging cells, the rate of endocytosis likely exceeds that of exocytosis.46,47
Future research will either confirm or reject these propositions, but it is clear that many more detailed measurements of metabolic rates are required and that current theoretical attempts to explain mechanistically why metabolic rates change with increasing body size are inadequate.48-53 Finally, we want to stress that the exact regulatory mechanisms of O2-dependent mitochondrial Adenosine-3-Phosphate (ATP)-production in expanding plant organs are still unresolved and therefore under investigation.54 Hence, a complete understanding of the relationships between body (cell) mass vs. metabolism (ATP-production) (Fig. 8) is, 150 y after Sachs (1865)2 mentioned this problem, currently lacking and still a major challenge for future research.
Figure 8.

Summary of organ- and cell respiration with reference to the production/release of Adenosine-3-Phosphate (ATP) by mitochondria. In growing, aerobic organisms, such as land plants (embryophytes) (A), metabolism is driven to ca. 80% by mitochondrial ATP-regeneration via oxidative phosphorylation (B). Intracellular vesicle transport is an O2 (ATP)-dependent metabolic process (see Fig. 6B).
Funding
The cooperation of the authors is supported by the Alexander von Humboldt-Foundation, Bonn, Germany (AvH-Fellowships Stanford 2013/14 to U. K.).
Disclosure of Potential Conflicts of Interest
No potential conflicts of interest were disclosed.
References
- 1.Höxtermann E, Hilger HH (Hg). Lebenswissen. Eine Einführung in die Geschichte der Biologie. Natur & Text, Rangsdorf: 2007. [Google Scholar]
- 2.Sachs J. Handbuch der Experimental-Physiologie der Pflanzen. Verlag Wilhelm Engelmann, Leipzig: 1865. [Google Scholar]
- 3.Kutschera U, Niklas KJ. Evolutionary plant physiology: Charles Darwin's forgotten synthesis. Naturwissenschaften 2009; 96:1339-54; PMID:19763527; http://dx.doi.org/ 10.1007/s00114-009-0604-z [DOI] [PubMed] [Google Scholar]
- 4.Rubner M. Ueber den Einfluss der Körpergrösse auf Stoff- und Kraftwechsel. Zeitschr Biol 1883; 19:535-62. [Google Scholar]
- 5.Benedict F. Vital Energetics: A Study of Comparative Basal Metabolism; Carnegie Institution, Washington, DC, USA, 1938. [Google Scholar]
- 6.Brody S. Bioenergetics and Growth; with Special Reference to the Efficiency Complex in Domestic Animals, Hafner Press, New York, NY, USA, 1945. [Google Scholar]
- 7.Kleiber M. The Fire of Life: An Introduction to Animal Energetics; Wiley: New York, NY, USA, 1961. (2 Ed., 1975). [Google Scholar]
- 8.Kleiber M. Body size and metabolism. Hilgardia 1932; 6:315-53; http://dx.doi.org/ 10.3733/hilg.v06n11p315 [DOI] [Google Scholar]
- 9.Kleiber M. A new Newton's Law of Cooling? Science 1972; 178:1283-1285; PMID:4640063; http://dx.doi.org/ 10.1126/science.178.4067.1283 [DOI] [PubMed] [Google Scholar]
- 10.Kleiber M. Body size, conductance for animal heat flow and Newton's Law of Cooling. J Theor Biol 1972; 37:139-50; PMID:4675780; http://dx.doi.org/ 10.1016/0022-5193(72)90120-8 [DOI] [PubMed] [Google Scholar]
- 11.West GB, Brown JH, Enquist BJ. A general model for the origin of allometric scaling laws in biology. Science 1997; 276:122-6; PMID:9082983; http://dx.doi.org/ 10.1126/science.276.5309.122 [DOI] [PubMed] [Google Scholar]
- 12.West GB, Brown JH, Enquist BJ. A general model for the structure and allometry of plant vascular systems. Nature 1999; 399:664-7. [Google Scholar]
- 13.West GB, Brown JH, Enquist BJ. The origin of universal scaling laws in biology In Scaling in Biology; Brown JH and West GW (Eds.); Oxford University Press, New York, NY, USA, 2000; pp. 87-112. [Google Scholar]
- 14.Price CA, Gillooly JF, Allen AP, Weitz JS, Niklas KJ. The metabolic theory of ecology: prospects and challenges for plant biology. New Phytol 2010; 188:696-710; PMID:20819176; http://dx.doi.org/ 10.1111/j.1469-8137.2010.03442.x [DOI] [PubMed] [Google Scholar]
- 15.Price CA, Weitz JS, Savage Van M, Stegen J, Clarke A, Coomes DA, Dodds PS, Etienne RS, Kerkhoff AJ, McCulloh K, et al.. Testing the metabolic theory of ecology. Ecol Lett 2012; 15:1465-74; PMID:22931542; http://dx.doi.org/ 10.1111/j.1461-0248.2012.01860.x [DOI] [PubMed] [Google Scholar]
- 16.Gillooly JF, Brown JH, West GB, Savage VM, Charnov EL. Effects of size and temperature on metabolic rate. Science 2001; 293: 2248-51; PMID:11567137; http://dx.doi.org/ 10.1126/science.1061967 [DOI] [PubMed] [Google Scholar]
- 17.Brown JH, Gillooly JF, Allen AP, Savage VM, West GB. Toward a metabolic theory of ecology. Ecology 2004; 85:1771-89; http://dx.doi.org/ 10.1890/03-9000 [DOI] [Google Scholar]
- 18.Blum JJ. On the geometry of four dimensions and the relationship between metabolism and body mass. J Theor Biol 2004; 64:599-601; http://dx.doi.org/ 10.1016/0022-5193(77)90292-2 [DOI] [PubMed] [Google Scholar]
- 19.Speakman JR. On Blum's four-dimensional geometric explanation for the 0.75 exponent in metabolic allometry. J Theor Biol 1990; 44:139-41; http://dx.doi.org/ 10.1016/S0022-5193(05)80305-4 [DOI] [PubMed] [Google Scholar]
- 20.McMahon TA. Size and shape in biology. Science 1973; 179:1201-4; PMID:4689015; http://dx.doi.org/ 10.1126/science.179.4079.1201 [DOI] [PubMed] [Google Scholar]
- 21.McMahon TA. Using body size to understand the structural design of animals: quadrupedal locomotion. J Appl Physiol 1975; 39:619-27; PMID:1194153 [DOI] [PubMed] [Google Scholar]
- 22.Dodds PS, Rothman DH, Weitz JS. Re-examination of the “3 / 4-law” of metabolism. J Theor Biol 2001; 209:9-27; PMID:11237567; http://dx.doi.org/ 10.1006/jtbi.2000.2238 [DOI] [PubMed] [Google Scholar]
- 23.Agutter P, Wheatley D. Metabolic scaling: consensus or controversy? Theor Biol Med Model 2004; 1:1-11; PMID:15285792; http://dx.doi.org/ 10.1186/1742-4682-1-13 [DOI] [PMC free article] [PubMed] [Google Scholar]
- 24.Harte J. The value of null theories in ecology. Ecology 2004; 85:1792-4; http://dx.doi.org/ 10.1890/03-0681 [DOI] [Google Scholar]
- 25.Kozlowski J, Konarzewski M. Is West, Brown and Enquist's model of allometric scaling mathematically correct and biologically relevant? Funct Ecol 2004; 8:283-9; http://dx.doi.org/ 10.1111/j.0269-8463.2004.00830.x [DOI] [Google Scholar]
- 26.Kozlowski J, Konarzewski M. West GB, Brown and Enquist's model of allometric scaling again: the same questions remain. Funct Ecol 2005; 19:739-43; http://dx.doi.org/ 10.1111/j.1365-2435.2005.01021.x [DOI] [Google Scholar]
- 27.Tilman D, HilleRisLambers H, Harpole S, Dybsinski R, Fargione J, Clark C, Lehman C. Does metabolic theory apply to community ecology? It's a matter of scale. Ecology 2004; 85:1797-9; http://dx.doi.org/ 10.1890/03-0725 [DOI] [Google Scholar]
- 28.Sousa T, Domingos T, Kooijman SALM. From empirical patterns to theory: a formal metabolic theory of life. Phil Transact Royal Soc London Ser B Biol Sci 2008; 363:2453-64; http://dx.doi.org/ 10.1098/rstb.2007.2230 [DOI] [PMC free article] [PubMed] [Google Scholar]
- 29.Jamieson JD, Palade GE. Synthesis, intracellular transport, and discharge of secretory proteins in stimulated pancreatic exocrine cells. J Cell Biol 1971; 50:135-58; PMID:4327462; http://dx.doi.org/ 10.1083/jcb.50.1.135 [DOI] [PMC free article] [PubMed] [Google Scholar]
- 30.Chrispeels MJ. Synthesis and secretion of hydroxyproline containing macromolecules in carrots. I. Kinetic analysis. Plant Physiol 1969; 44:1187-93; PMID:16657187; http://dx.doi.org/ 10.1104/pp.44.8.1187 [DOI] [PMC free article] [PubMed] [Google Scholar]
- 31.Tanchak MA, Fowke LC. The morphology of multivesicular bodies in soybean protoplasts and their role in endocytosis. Protoplasma 1987; 138:173-82; http://dx.doi.org/ 10.1007/BF01281026 [DOI] [Google Scholar]
- 32.Record RD, Griffing LR. Convergence of the endocytic and lysosomal pathways in soybean protoplasts. Planta 1988; 176:425-32; PMID:24220938; http://dx.doi.org/ 10.1007/BF00397648 [DOI] [PubMed] [Google Scholar]
- 33.Fakkhri N, Wessel AD, Willms C, Pasquali M, Klopfenstein DR, MacKintosh FC, Schmidt CF. High-resolution mapping of intracellular fluctuations using carbon nanotubes. Science 2014; 344:1031-5; PMID:24876498; http://dx.doi.org/ 10.1126/science.1250170 [DOI] [PubMed] [Google Scholar]
- 34.Enquist BJ, Brown JH, West GB. Allometric scaling of plant energetics and population density. Nature 1988; 395:163-5; http://dx.doi.org/ 10.1038/25977 [DOI] [Google Scholar]
- 35.Meinzer FC, Bond BJ, Warren JM, Woodruff DR. Does water transport scale universally with tree size? Funct Ecol 2005; 19:558-65; http://dx.doi.org/ 10.1111/j.1365-2435.2005.01017.x [DOI] [Google Scholar]
- 36.Meinzer FC, Goldstein G, Andrade JL. Regulation of water flux through tropical forest canopy trees: do universal rules apply? Tree Physiol 2001; 21:19-26; PMID:11260820; http://dx.doi.org/ 10.1093/treephys/21.1.19 [DOI] [PubMed] [Google Scholar]
- 37.Niklas KJ. Plant Allometry: The Scaling of Form and Process. University of Chicago Press: Chicago, Illinois, USA, 1994. [Google Scholar]
- 38.Niklas KJ, Enquist BJ. Invariant scaling relationships for interspecific plant biomass production rates and body size. Proc Natl Acad Sci USA 2001; 98:2922-7; PMID:11226342; http://dx.doi.org/ 10.1073/pnas.041590298 [DOI] [PMC free article] [PubMed] [Google Scholar]
- 39.Reich PB, Tjoelker MG, Machado JL, Oleksyn J. Universal scaling of respiratory metabolism, size and nitrogen in plants. Nature 2006; 439:457-61; PMID:16437113; http://dx.doi.org/ 10.1038/nature04282 [DOI] [PubMed] [Google Scholar]
- 40.Mori S, Yamaji K, Ishida A, Pokushkin SG, Masyagina OV, Hagihara A, Hoque ATMR et al.. Mixed-power scaling of whole-plant respiration from seedlings to giant trees. Proc Natl Acad Sci USA 2010; 107:1447-51; PMID:20080600; http://dx.doi.org/ 10.1073/pnas.0902554107 [DOI] [PMC free article] [PubMed] [Google Scholar]
- 41.Cheng D, Niklas KJ, Zhong G, Yang Y, Zhang J. Interspecific differences in whole-plant respiration vs. biomass scaling relationships: A case study using evergreen conifer and angiosperm tree seedlings. Amer J Bot 2014; 101:617-23; http://dx.doi.org/ 10.3732/ajb.1300360 [DOI] [PubMed] [Google Scholar]
- 42.Kutschera U, Niklas KJ. Ontogenetic changes in the scaling of cellular respiration with respect to size among sunflower seedlings. Plant Signal Behav 2011; 6:72-6; PMID:21301213; http://dx.doi.org/ 10.4161/psb.6.1.14001 [DOI] [PMC free article] [PubMed] [Google Scholar]
- 43.Kutschera U, Niklas KJ. Organ-specific rates of cellular respiration in developing sunflower seedlings and their bearing on metabolic scaling theory. Protoplasma 2012; 249:1049-57; PMID:22016107; http://dx.doi.org/ 10.1007/s00709-011-0338-6 [DOI] [PubMed] [Google Scholar]
- 44.Kutschera U, Niklas KJ. Metabolic scaling theory in plant biology and the three oxygen paradoxa of aerobic life. Theory Biosci 2013; 132:277-88; PMID:23982798; http://dx.doi.org/ 10.1007/s12064-013-0194-3 [DOI] [PubMed] [Google Scholar]
- 45.Savage van M, Deeds EJ, Fontana W. Sizing up allometric scaling theory. PLoS Comp Biol 2008; 4:17; http://dx.doi.org/ 10.1371/journal.pcbi.0040017 [DOI] [PMC free article] [PubMed] [Google Scholar]
- 46.Thiel G, Kreft M, Zorec R. Unitary exocytotic and endocytotic events in Zea mays L. coleoptile protoplasts. Plant J 1998; 13:177-20; PMID:9680974; http://dx.doi.org/ 10.1046/j.1365-313X.1998.00021.x [DOI] [PubMed] [Google Scholar]
- 47.Ketelaar T, Galway ME, Mulder BM, Emons AM. Rates of exocytosis and endocytosis in Arabidopsis root hairs and pollen tubes. J Microscop 2008; 231:265-73; http://dx.doi.org/ 10.1111/j.1365-2818.2008.02031.x [DOI] [PubMed] [Google Scholar]
- 48.Kutschera U, Niklas KJ. Darwin-Wallace Demons: survival of the fastest in populations of duckweeds and the evolutionary history of an enigmatic group of angiosperms. Plant Biol 2015; 17 (Suppl. One):24-32; PMID:24674028; http://dx.doi.org/ 10.1111/plb.12171 [DOI] [PubMed] [Google Scholar]
- 49.Rau ARP. Biological scaling and physics. J Biosci 2002; 27:475-78; PMID:12381870; http://dx.doi.org/ 10.1007/BF02705043 [DOI] [PubMed] [Google Scholar]
- 50.Agutter PS, Tuszynski JA. Analytic theories of allometric scaling. J Exp Biol 2011; 214:1055-62; PMID:21389188; http://dx.doi.org/ 10.1242/jeb.054502 [DOI] [PubMed] [Google Scholar]
- 51.Hulbert AJ. A skeptics view: “Kleiber's law” or the “3/4 rule” is neither a law nor a rule but rather an empirical approximation. Systems 2014; 2:186-202; http://dx.doi.org/ 10.3390/systems2020186 [DOI] [Google Scholar]
- 52.Glazier DS. A unifying explanation for diverse metabolic scaling in animals and plants. Biol Rev 2010; 85:111-38; PMID:19895606; http://dx.doi.org/ 10.1111/j.1469-185X.2009.00095.x [DOI] [PubMed] [Google Scholar]
- 53.Glazier DS. Metabolic scaling in complex living systems. Systems 2014; 2:425-450; http://dx.doi.org/ 10.3390/systems2040425 [DOI] [Google Scholar]
- 54.Müller M, Mentel M, van Hellemond JJ, Henze K, Woehle C, Gould SB, Yu R-Y, van der Giezen M, Tielens AGM, Martin WF. Biochemistry and evolution of anaerobic energy metabolism in eukaryotes. Microbiol Mol Biol Rev 2012; 76:444-95; PMID:22688819; http://dx.doi.org/ 10.1128/MMBR.05024-11 [DOI] [PMC free article] [PubMed] [Google Scholar]