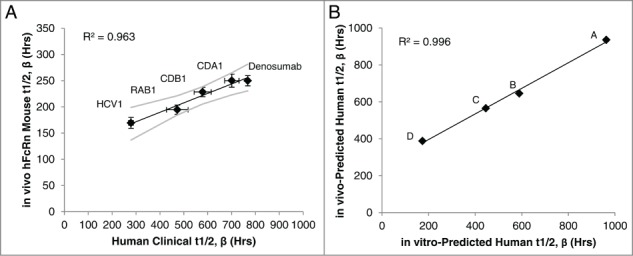
Figure 3.

IgG1 half-life in hFcRn transgenic mice to predict human half-life. The β phase half-life of the 5 standard mAbs in Figure 2 was assessed in hFcRn mice, which correlated to the actual human half-life determined in clinical studies (A). Linear regression analysis of the mAbs with known human half-life provided a line of best fit equation that was used to predict the human half-life of the pre-clinical experimental mAbs (denoted mAbs A-D) by applying the hFcRn mouse half-lives to the equation. The predicted human half-life using the hFcRn mouse in vivo data closely associated with the in vitro-predicted human half-life from the BLI-based assay (B). Values are the mean ± SEM. Line of best fit is shown in black with 95% confidence interval in gray. For mouse studies, 2–3 independent experiments were performed with N = 6 mice per experiment. In vitro results represent at least 2 independent experiments with N = 5 per experiment.
