Figure 3.
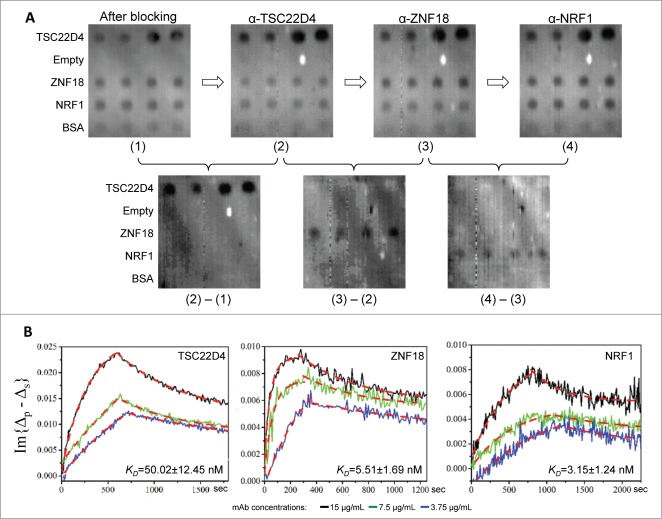
Sequential measurement of mAb avidity values. (A) 2-D images of the OIRD binding assay. After protein microarray composed of 3 antigens, TSC22D4, ZNF18, and NRF1, and a negative control protein BSA, was formed and blocked with BSA, a 2-D OIRD Image (1) was obtained. Next, after 15 μg/mL of anti-TSC22D4 mAb was pumped into the reaction chamber and reached saturation, wash buffer was pumped in until the off-curve was stabilized, at which point the second 2-D OIRD Image (2) was obtained. Without regenerating the surface, anti-ZNF18 at the same concentration was pumped into the reaction chamber, and the entire measuring process was repeated, resulting in Image (3). Finally, the same procedure was repeated for anti-NRF1 to generate Image (4). Because OIRD measures the binding events by taking differences in the OIRD signals, the binding results of anti-TSC22D4 mAb could be visualized by subtracting Image (1) from Image (2) (lower left panel). By the same token, the binding results of anti-ZNF18 and anti-NRF1 mAbs were obtained by subtracting Image (2) from (3) (Lower mid panel), and Image (3) from (4) (Lower right panel), respectively. (B) Real-time kinetics for all 3 mAb were also obtained during the entire binding and washing steps. When the on- and off-curves of each mAb measured at 3 different concentrations were plotted together, they all showed similar trend and concentration-dependent changes in the shapes of the curves. The calculated KD for each mAb are also shown.

