

Abstract
Purpose
We tested whether prospective use of electronic health record-based trigger algorithms to identify patients at risk of diagnostic delays could prevent delays in diagnostic evaluation for cancer.
Methods
We performed a cluster randomized controlled trial of primary care providers (PCPs) at two sites to test whether triggers that prospectively identify patients with potential delays in diagnostic evaluation for lung, colorectal, or prostate cancer can reduce time to follow-up diagnostic evaluation. Intervention steps included queries of the electronic health record repository for patients with abnormal findings and lack of associated follow-up actions, manual review of triggered records, and communication of this information to PCPs via secure e-mail and, if needed, phone calls to ensure message receipt. We compared times to diagnostic evaluation and proportions of patients followed up between intervention and control cohorts based on final review at 7 months.
Results
We recruited 72 PCPs (36 in the intervention group and 36 in the control group) and applied the trigger to all patients under their care from April 20, 2011, to July 19, 2012. Of 10,673 patients with abnormal findings, the trigger flagged 1,256 patients (11.8%) as high risk for delayed diagnostic evaluation. Times to diagnostic evaluation were significantly lower in intervention patients compared with control patients flagged by the colorectal trigger (median, 104 v 200 days, respectively; n = 557; P < .001) and prostate trigger (40% received evaluation at 144 v 192 days, respectively; n = 157; P < .001) but not the lung trigger (median, 65 v 93 days, respectively; n = 19; P = .59). More intervention patients than control patients received diagnostic evaluation by final review (73.4% v 52.2%, respectively; relative risk, 1.41; 95% CI, 1.25 to 1.58).
Conclusion
Electronic trigger-based interventions seem to be effective in reducing time to diagnostic evaluation of colorectal and prostate cancer as well as improving the proportion of patients who receive follow-up. Similar interventions could improve timeliness of diagnosis of other serious conditions.
INTRODUCTION
Delayed cancer diagnosis is the most common reason for ambulatory malpractice claims and is associated with patient anxiety and potentially poorer clinical outcomes.1–8 These delays often result from a variety of cognitive and system factors that lead to lack of timely evaluation of red flag signs and symptoms or abnormal test results.9–21 Despite increasing adoption of electronic health records (EHRs) and greater access to diagnostic information, delays persist10,18,19,22–26 in part because of failure to receive, recognize, or process critical patient information.27–31 Thus, interventions are needed to support front-line providers.
Strategies to proactively detect delays in diagnostic evaluation in patients with red flags could shorten times to cancer diagnosis.32 Reviewing medical records of all patients with red flags will be time consuming and cost prohibitive, even with dedicated resources like case managers.33 To facilitate more selective record reviews, we recently developed electronic trigger algorithms to efficiently identify patients with potential delays.34,35 Triggers scan EHR data for clinical and diagnostic clues to identify patients at risk of harm so that their records can be evaluated.36–41 Our triggers queried EHR-based data for patients who lacked diagnostic evaluation on the following red flags: positive fecal occult blood test (FOBT), elevated prostate-specific antigen (PSA), laboratory findings consistent with iron deficiency anemia, or hematochezia (ie, bright red rectal blood). Algorithms queried follow-up actions on red flags, such as tests or specialty referrals, and identified patients as trigger positive when no appropriate predetermined follow-up actions were identified. In retrospective validation cohort studies to develop prostate, colorectal, and lung cancer trigger algorithms, the positive predictive value (PPV) of each trigger algorithm was greater than 50%.34,35 In this study, we evaluated whether an intervention involving communication of trigger-identified records to providers was effective in reducing time to subsequent diagnostic evaluation and improving the proportion of patients who receive follow-up action.
METHODS
Trial Design
We conducted a cluster randomized controlled trial to test the effectiveness of a trigger-based intervention to reduce delays in diagnostic evaluation for lung, colorectal, or prostate cancer. Study sites included an urban Veterans Affairs facility (site A) and a private health system (site B), both using integrated EHRs and large data repositories. Institutional review boards at both sites approved the study with waivers for patient consent.
Participants
All 109 full-time primary care providers (PCPs; defined as physicians, physician assistants, and nurse practitioners working > 36 hours per week in internal or family medicine ambulatory clinics) were invited to participate. To prevent contamination across patients of the same PCP, individual PCPs served as the clustered unit of random assignment. PCPs were invited via e-mail or in person during weekly meetings, and written consent was obtained on enrollment. After enrollment, we used a random number function in Microsoft Excel (Redmond, WA) to automatically assign all enrolled PCPs at each site, four at a time, to either the intervention or control group (block randomization design with block sizes of four).
Intervention
Details regarding trigger development are published elsewhere.34,35 We applied electronic triggers twice a month over a 15-month period to EHR data repositories at both sites to identify records of patients cared for by intervention group providers with potential delays in diagnostic evaluation of findings suspicious for cancer (Table 1). Triggers leveraged structured EHR data and were based on the following criteria: presence of a clinical clue or red flag; exclusion of records where further evaluation is not warranted (eg, terminal illness); and presence of delay in diagnostic evaluation. Red flags for colorectal cancer included a positive FOBT, labs consistent with iron deficiency anemia, and new diagnosis of hematochezia. For lung cancer, imaging studies suggestive of malignancy were red flags, and for prostate cancer, elevated PSA was the red flag. Delayed diagnostic evaluation was defined by the absence of documented follow-up action within 30, 60, or 90 days for lung, colorectal, and prostate cancer work-up, respectively, from the date of the red flag's first presentation. During pilot testing, we discovered that the hematochezia trigger could not be applied at site A because of the site's interchangeable use of melena and hematochezia diagnosis codes. At site B, a case manager routinely reviewed all abnormal radiographs to ensure appropriate follow-up, and the lung cancer trigger was unable to identify a single delay. Thus, we did not include site B imaging data.
Table 1.
Red Flag, Clinical Exclusion, and Expected Follow-Up Action Criteria by Cancer Type
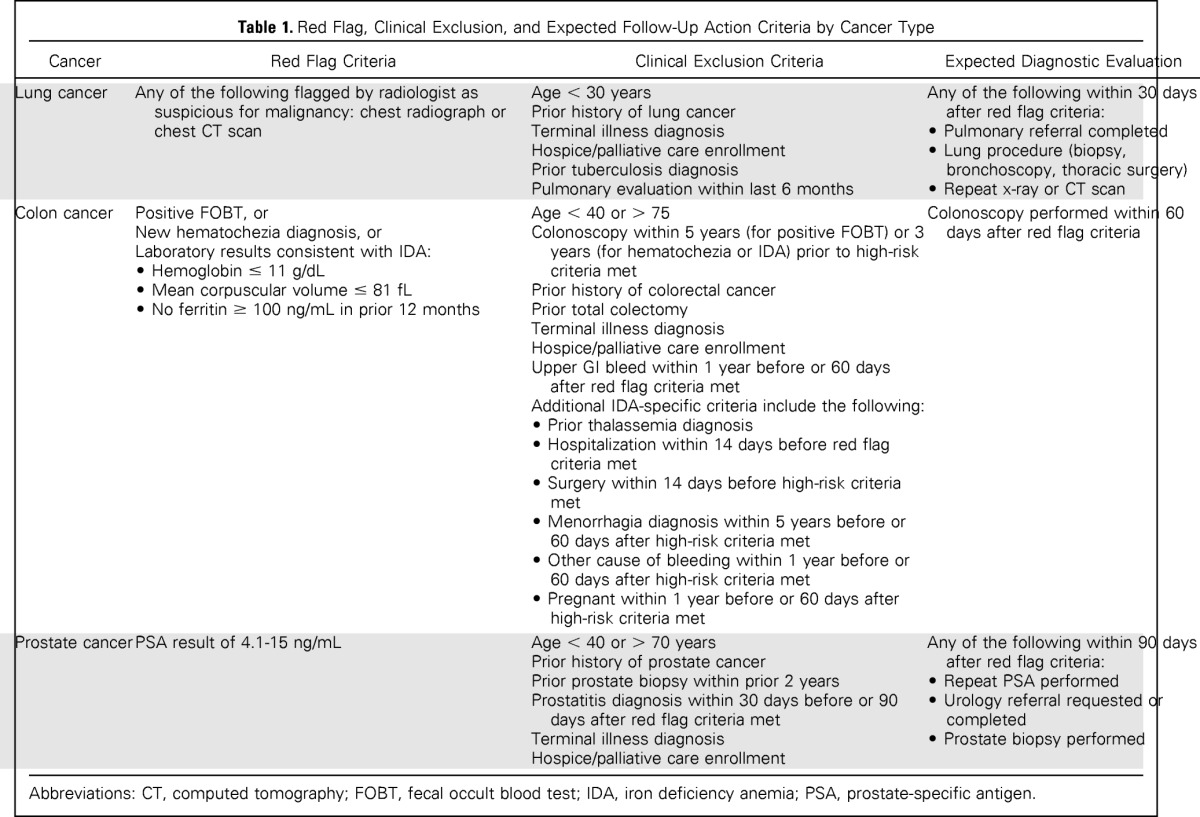
| Cancer | Red Flag Criteria | Clinical Exclusion Criteria | Expected Diagnostic Evaluation |
|---|---|---|---|
| Lung cancer | Any of the following flagged by radiologist as suspicious for malignancy: chest radiograph or chest CT scan | Age < 30 years Prior history of lung cancer Terminal illness diagnosis Hospice/palliative care enrollment Prior tuberculosis diagnosis Pulmonary evaluation within last 6 months | Any of the following within 30 days after red flag criteria: • Pulmonary referral completed • Lung procedure (biopsy, bronchoscopy, thoracic surgery) • Repeat x-ray or CT scan |
| Colon cancer | Positive FOBT, or New hematochezia diagnosis, or Laboratory results consistent with IDA: • Hemoglobin ≤ 11 g/dL • Mean corpuscular volume ≤ 81 fL • No ferritin ≥ 100 ng/mL in prior 12 months | Age < 40 or > 75 Colonoscopy within 5 years (for positive FOBT) or 3 years (for hematochezia or IDA) prior to high-risk criteria met Prior history of colorectal cancer Prior total colectomy Terminal illness diagnosis Hospice/palliative care enrollment Upper GI bleed within 1 year before or 60 days after red flag criteria met Additional IDA-specific criteria include the following: • Prior thalassemia diagnosis • Hospitalization within 14 days before red flag criteria met • Surgery within 14 days before high-risk criteria met • Menorrhagia diagnosis within 5 years before or 60 days after high-risk criteria met • Other cause of bleeding within 1 year before or 60 days after high-risk criteria met • Pregnant within 1 year before or 60 days after high-risk criteria met | Colonoscopy performed within 60 days after red flag criteria |
| Prostate cancer | PSA result of 4.1-15 ng/mL | Age < 40 or > 70 years Prior history of prostate cancer Prior prostate biopsy within prior 2 years Prostatitis diagnosis within 30 days before or 90 days after red flag criteria met Terminal illness diagnosis Hospice/palliative care enrollment | Any of the following within 90 days after red flag criteria: • Repeat PSA performed • Urology referral requested or completed • Prostate biopsy performed |
Abbreviations: CT, computed tomography; FOBT, fecal occult blood test; IDA, iron deficiency anemia; PSA, prostate-specific antigen.
All trigger-positive records were initially considered as high risk for delayed diagnostic evaluation. A clinician (L.W.) manually reviewed each triggered record using a standardized data collection instrument to confirm delayed diagnostic evaluation. Table 1 lists criteria used to determine appropriate follow-up. An initial 20 records were independently reviewed by a second clinician (D.R.M.) to ensure greater than 80% inter-rater reliability for delayed diagnostic evaluation. If presence of delay was unclear, record details were discussed among the full team. PCPs of patients with delayed diagnostic evaluation were contacted by secure e-mail and provided information on the red flag lacking follow-up using a standardized template. If we could not confirm e-mail receipt (eg, reply from provider), the reviewer performed a second review 1 week later. If no follow-up action was documented, a research assistant telephoned the PCP or designated nurse. Contact preferences were elicited before the trial, and because PCP-nurse pairing is fixed at both facilities, this method reduced the risk of group contamination.
During the call, a standardized script was used to inform the PCP of patient name and record number, red flag finding, and presence of a possible delay in care. No other information or recommendations were provided, and the PCP and nurse were free to work together to ensure follow-up based on practice procedures. Only if the PCP or nurse could not be reached via daily phone attempts over 3 consecutive business days, the information was escalated to their clinical leadership.42 At times, PCPs documented a logical plan to follow up the red flag at a specific future date, in which case we reviewed the chart 1 week after the planned follow-up date and initiated communication only if the plan was not adhered to. When PCPs left the study, the trigger was modified on departure to no longer scan their patient panels for delays. A final review was performed at 7 months after the date of first red flag presentation to incorporate additional actions taken on subsequent visits, which often occur on at least a biannual basis. At study conclusion, we retrospectively applied the same triggers once to the control group. To enable equal treatment of both the intervention and control groups, we performed identical reviews using only data up to 7 months after the red flag date to evaluate outcomes.
Reviewers were blinded for the final reviews by keeping study group assignment lists separate from data available to the chart reviewer and analyst. The study team did not directly inform PCPs about group assignment, although they likely became aware when we contacted them.
End Points
The primary outcome was time to documented follow-up, defined as the number of days between the red flag date and documented follow-up action or a deliberate decision not to take follow-up action (eg, patient refusal or watchful waiting). Times to diagnostic evaluation for the control and intervention groups were compared. Outcomes were assessed at 7 months, and records without follow-up action by this time were censored. Secondary outcomes included between-group differences in proportion of patients receiving follow-up diagnostic evaluation by 7 months, reasons for delayed diagnostic evaluation, and date of any subsequent nonmalignant neoplasia diagnosis or cancer diagnosis. We also calculated PPVs for each trigger, defined as the percentage of records with actual delayed diagnostic evaluation among all trigger positives.
Sample Size
We calculated the sample size needed to have 80% power to detect a difference in time to diagnostic evaluation between intervention and control groups using the two-sided log-rank test, assuming α = .05 and equal group sizes. We assumed that for each cancer type, 25% of patients in the control group would receive follow-up by 7 months versus 50% in the intervention group (control group hazard ratio of 0.50). This yielded a sample size estimate of 72 trigger-positive records per cancer type. Adjusting for clustering using a design effect of 1.6 (assuming a conservative 0.05 intraclass correlation based on behavioral research literature43 and an average of 12 trigger-positive records per physician per year) resulted in an estimate of 116 trigger-positive records for each cancer type. We expected to recruit approximately 50% of all 109 PCPs and estimated 12 months to meet sample size.
Data Collection
On enrollment, all PCPs completed a brief survey on their demographics and communication preferences. We subsequently used a pretested, standardized record review instrument to collect data on patient demographics, primary and secondary outcomes, and time to diagnostic evaluation.
Data Analysis
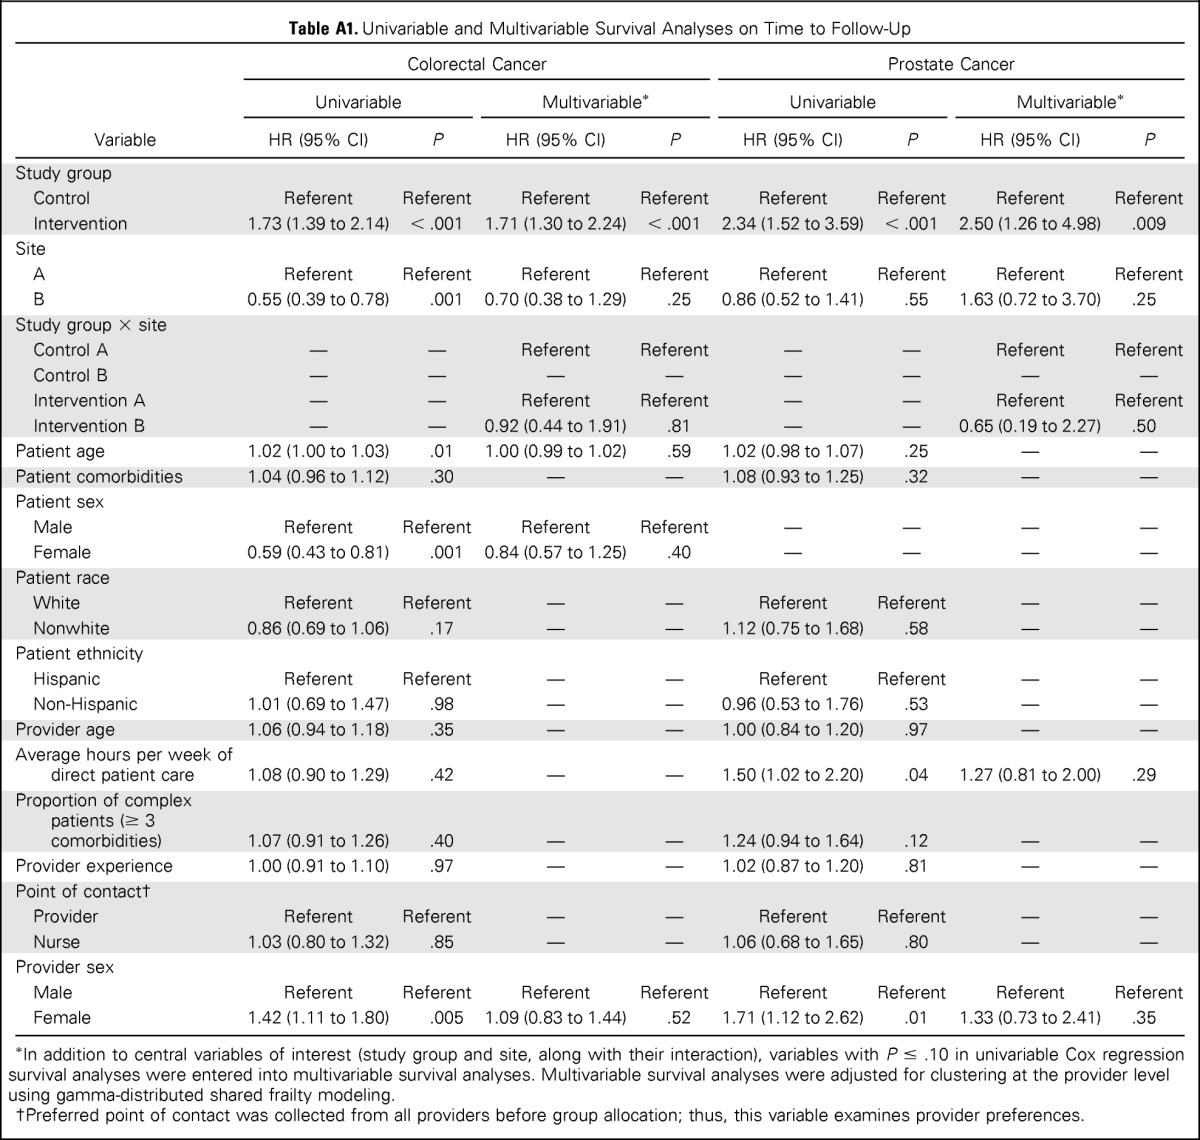
We summarized PCP and patient demographics using descriptive statistics. We used Fisher's exact tests to examine differences between the intervention and control groups on demographic characteristics and to compare proportions of patients receiving follow-up action by 7 months in each group. Univariable Cox proportional hazards analyses were conducted to examine between-group differences in median time to diagnostic evaluation for each trigger type and to examine effects of patient and PCP characteristics. When less than 50% of patients in either group received diagnostic evaluation (ie, medians were not reached), the point at which 40% received diagnostic evaluation was compared instead. Factors with P < .20 were entered into multivariable Cox proportional hazard models but were only retained in final models if P < .05 (Appendix Table A1, online only). The multivariable model was adjusted for clustering of physicians using gamma-distributed shared frailty modeling. Descriptive statistics were used to summarize the frequency of reasons for no follow-up at 7 months.
RESULTS
Of 109 PCPs, 37 declined or did not respond to study invitations. We recruited 72 PCPs (32 at site A and 40 at site B) and randomly assigned 36 each to the intervention and control groups. The trigger was applied to all patients cared for by study PCPs from April 20, 2011, to July 19, 2012, an estimated 118,400 patients. Red flag criteria were documented in 10,673 records, and of these, 1,256 records were trigger positive.
Table 2 lists PCP self-reported demographic characteristics and patient characteristics obtained from record reviews. No significant differences in PCP age, sex, education, or experience were observed between groups. Department leadership was notified of any unaddressed delays in evaluation.
Table 2.
Characteristics of PCPs and Patients
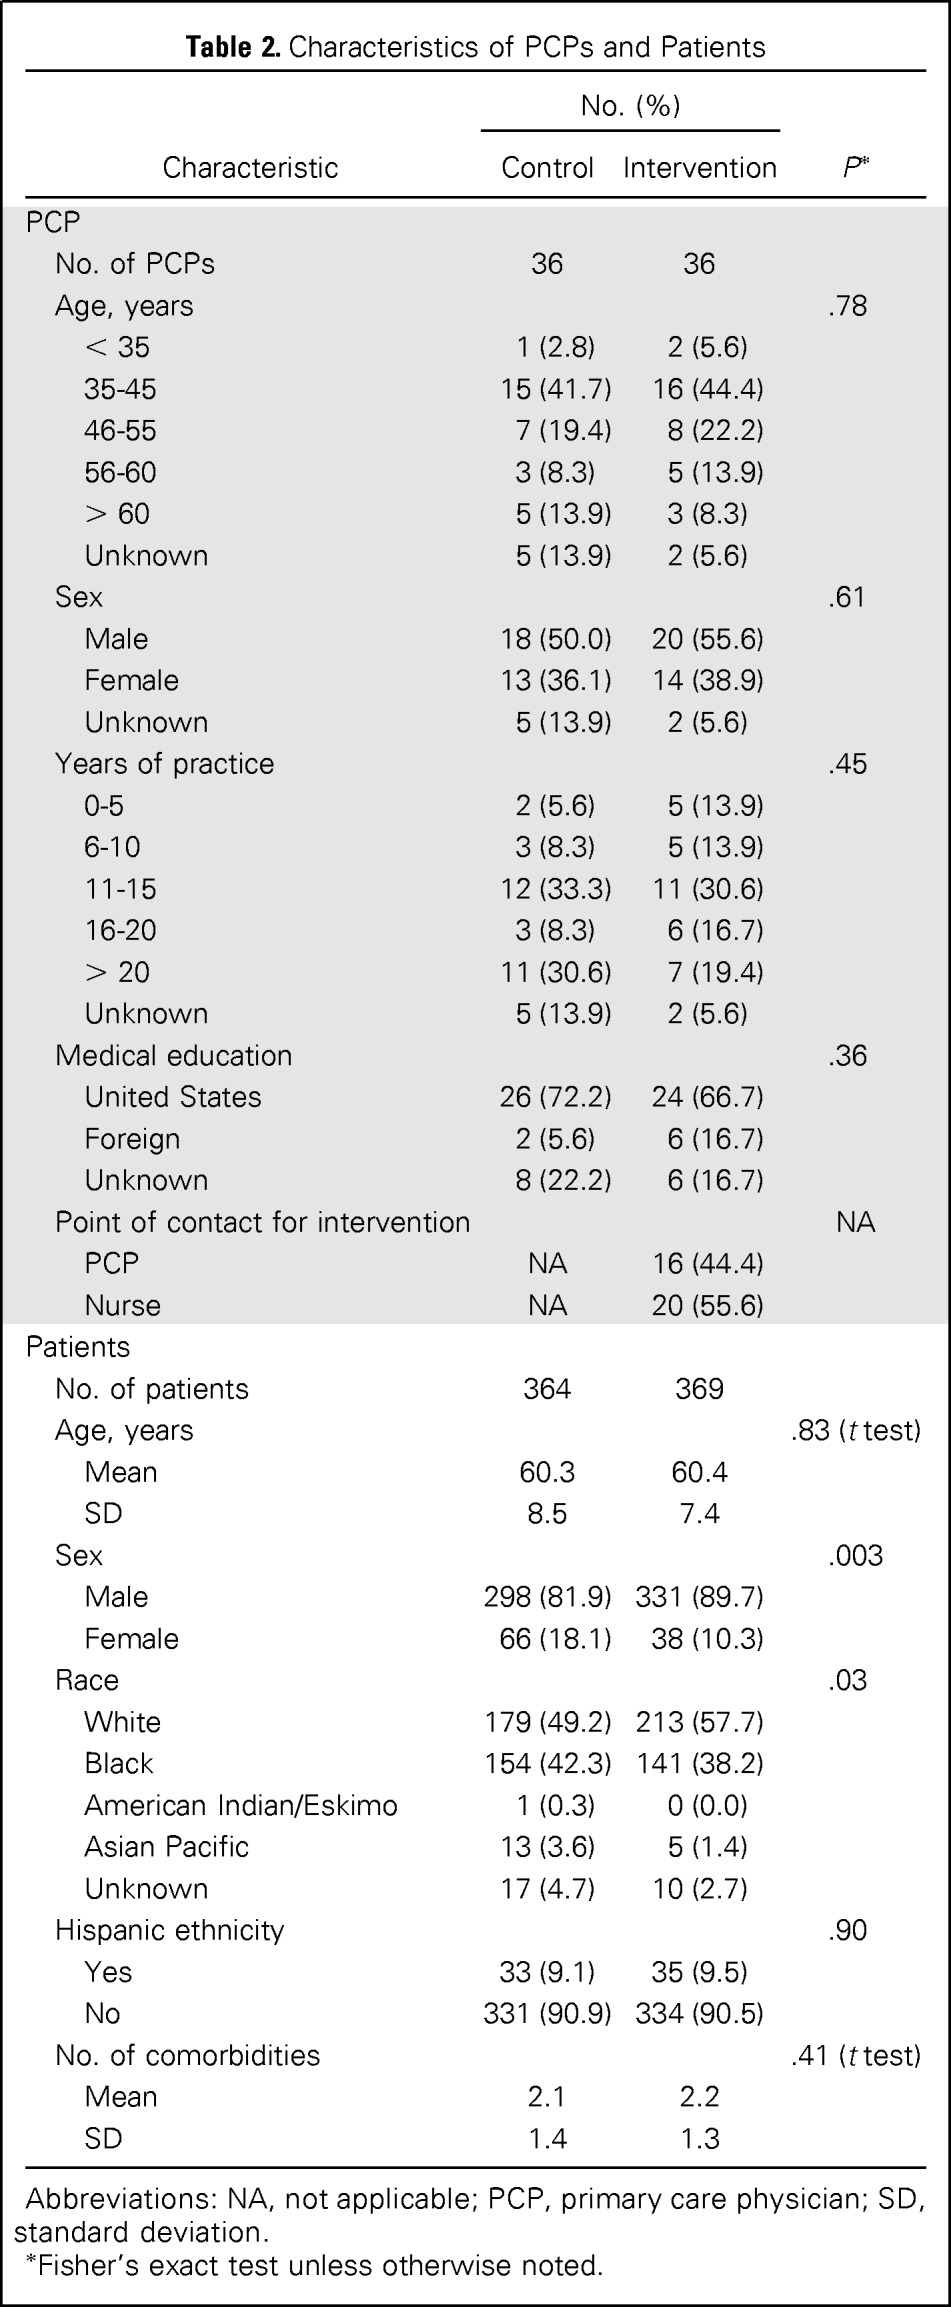
| Characteristic | No. (%) |
P* | |
|---|---|---|---|
| Control | Intervention | ||
| PCP | |||
| No. of PCPs | 36 | 36 | |
| Age, years | .78 | ||
| < 35 | 1 (2.8) | 2 (5.6) | |
| 35-45 | 15 (41.7) | 16 (44.4) | |
| 46-55 | 7 (19.4) | 8 (22.2) | |
| 56-60 | 3 (8.3) | 5 (13.9) | |
| > 60 | 5 (13.9) | 3 (8.3) | |
| Unknown | 5 (13.9) | 2 (5.6) | |
| Sex | .61 | ||
| Male | 18 (50.0) | 20 (55.6) | |
| Female | 13 (36.1) | 14 (38.9) | |
| Unknown | 5 (13.9) | 2 (5.6) | |
| Years of practice | .45 | ||
| 0-5 | 2 (5.6) | 5 (13.9) | |
| 6-10 | 3 (8.3) | 5 (13.9) | |
| 11-15 | 12 (33.3) | 11 (30.6) | |
| 16-20 | 3 (8.3) | 6 (16.7) | |
| > 20 | 11 (30.6) | 7 (19.4) | |
| Unknown | 5 (13.9) | 2 (5.6) | |
| Medical education | .36 | ||
| United States | 26 (72.2) | 24 (66.7) | |
| Foreign | 2 (5.6) | 6 (16.7) | |
| Unknown | 8 (22.2) | 6 (16.7) | |
| Point of contact for intervention | NA | ||
| PCP | NA | 16 (44.4) | |
| Nurse | NA | 20 (55.6) | |
| Patients | |||
| No. of patients | 364 | 369 | |
| Age, years | .83 (t test) | ||
| Mean | 60.3 | 60.4 | |
| SD | 8.5 | 7.4 | |
| Sex | .003 | ||
| Male | 298 (81.9) | 331 (89.7) | |
| Female | 66 (18.1) | 38 (10.3) | |
| Race | .03 | ||
| White | 179 (49.2) | 213 (57.7) | |
| Black | 154 (42.3) | 141 (38.2) | |
| American Indian/Eskimo | 1 (0.3) | 0 (0.0) | |
| Asian Pacific | 13 (3.6) | 5 (1.4) | |
| Unknown | 17 (4.7) | 10 (2.7) | |
| Hispanic ethnicity | .90 | ||
| Yes | 33 (9.1) | 35 (9.5) | |
| No | 331 (90.9) | 334 (90.5) | |
| No. of comorbidities | .41 (t test) | ||
| Mean | 2.1 | 2.2 | |
| SD | 1.4 | 1.3 | |
Abbreviations: NA, not applicable; PCP, primary care physician; SD, standard deviation.
Fisher's exact test unless otherwise noted.
The trigger identified 683 intervention patients across both sites (Fig 1). On manual review, 298 patient records (44.7%) were found to be false positive and were excluded because of documentation that subsequent follow-up was not necessary (eg, care delivered elsewhere). Thus, 385 patients (site A, n = 340; site B, n = 45) had delayed diagnostic evaluation and were contacted by the study team (colorectal cancer, n = 284; prostate cancer, n = 89; lung cancer, n = 12). Four intervention group providers left their respective facility between the red flag and final review dates, and data from the 16 patients under their care were excluded. Of the remaining 369 patients, 266 (72.1%) received follow-up actions after intervention. In 11 instances (2.9%), the PCP could not be reached despite multiple attempts, and leadership was contacted; five of these PCPs subsequently took action. No follow-up action was documented by the 7-month review in 98 instances (26.6%).
Fig 1.

Study flow diagram. (*) Seven of the 72 providers left their respective facilities during the study period, and triggers were immediately modified to cease evaluating data of their patients.
Poststudy trigger application in the control group identified 573 patients. Manual reviews excluded 209 false positives (36.5%), thus identifying 364 patients (284, 70, and 10 for colorectal, prostate, and lung cancer, respectively; 290 at site A and 74 at site B) with delayed diagnostic evaluation. Although three control providers left their facility after enrollment, their patients were not affected by attrition because we only applied triggers retrospectively on patients who were still enrolled in PCP panels on July 19, 2012. A lower false-positive rate in controls was not unexpected because occasionally, initially missing follow-up action data get uploaded to the repository at a later time. No variations in number of trigger positives over time were seen, suggesting that group contamination did not occur.
Overall, the trigger achieved a PPV of 59.6% for delayed diagnostic evaluation (749 true positives from all 1,256 trigger-identified records; PPVs were 60.3%, 58.4%, and 39.6% for colorectal, prostate, and lung cancer, respectively).
Primary Outcome
Because expected time to diagnostic evaluation varied for each cancer, we performed their time to follow-up survival analyses separately. All assumptions for Cox proportional hazards analyses were met. Only 19 records (after censoring three records because of provider attrition) with delayed follow-up were analyzed for lung cancer, and no statistical difference was observed in the time to diagnostic evaluation between the intervention and control groups (medians 65 v 93 days, respectively; P = .59; n = 19). Time to diagnostic evaluation was significantly shorter for intervention, versus control, in both colorectal (median, 104 v 200 days, respectively; P < .001; n = 557) and prostate triggers (40% received diagnostic evaluation at 144 v 192 days, respectively; P < .001; n = 157; Fig 2). In multivariable models, time to diagnostic evaluation was not associated with patient or PCP characteristics or site, and there was no significant interaction between study group and site, indicating similar intervention effectiveness across sites.
Fig 2.
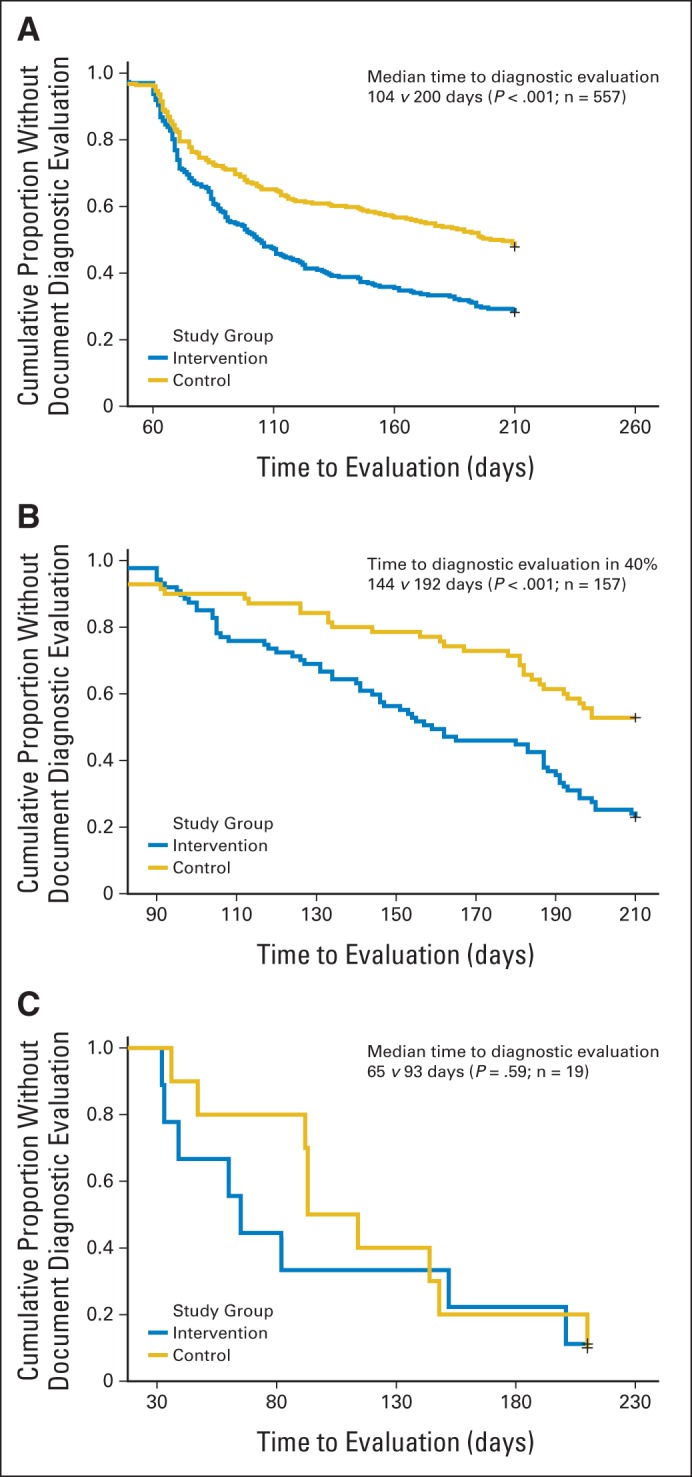
Effect of trigger-based intervention on time to diagnostic evaluation for (A) colorectal cancer, (B) prostate cancer, and (C) lung cancer.
Secondary Outcomes
At the 7-month chart review, patients cared for by intervention group PCPs were more likely to receive diagnostic evaluation (P < .001; relative risk, 1.41; 95% CI, 1.25 to 1.58); 73.4% of intervention patients with delayed diagnostic evaluation (271 of 369 patients) had subsequent documentation of follow-up action compared with 52.2% of control patients (190 of 364 patients). The most common reason for absent diagnostic evaluation in either group was follow-up action scheduled after 7 months (n = 82; 30.1%; Table 3).
Table 3.
Reasons for Lack of Diagnostic Evaluation at Study End Point
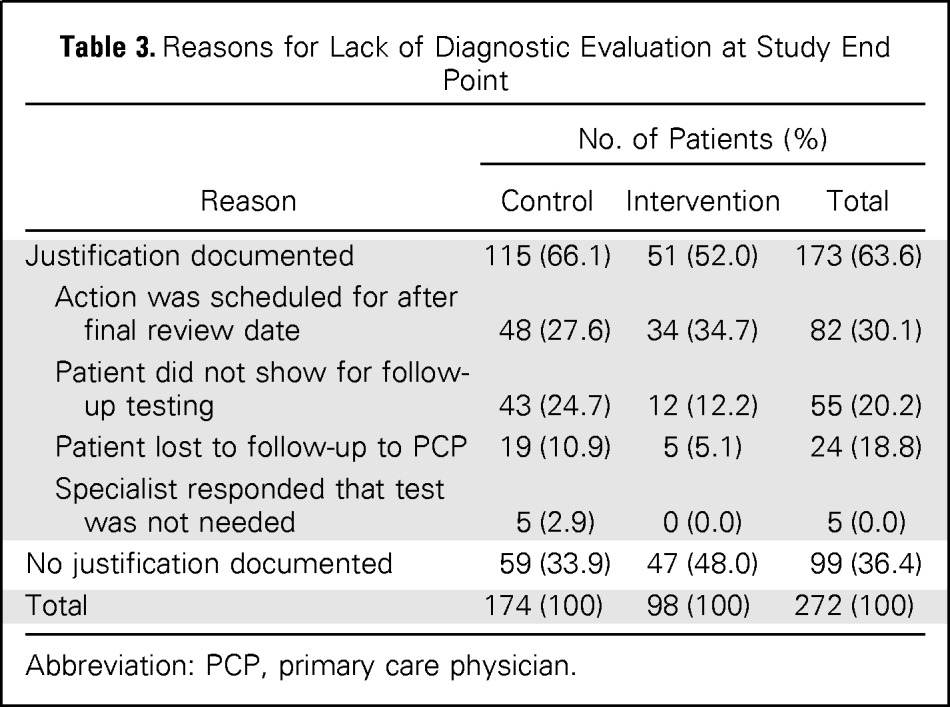
| Reason | No. of Patients (%) |
||
|---|---|---|---|
| Control | Intervention | Total | |
| Justification documented | 115 (66.1) | 51 (52.0) | 173 (63.6) |
| Action was scheduled for after final review date | 48 (27.6) | 34 (34.7) | 82 (30.1) |
| Patient did not show for follow-up testing | 43 (24.7) | 12 (12.2) | 55 (20.2) |
| Patient lost to follow-up to PCP | 19 (10.9) | 5 (5.1) | 24 (18.8) |
| Specialist responded that test was not needed | 5 (2.9) | 0 (0.0) | 5 (0.0) |
| No justification documented | 59 (33.9) | 47 (48.0) | 99 (36.4) |
| Total | 174 (100) | 98 (100) | 272 (100) |
Abbreviation: PCP, primary care physician.
Twenty-three cancers (four lung, 18 colorectal, and one prostate) were diagnosed during the 7-month follow-up period. Within this small sample, we identified no statistically significant difference in incidence of cancer diagnosis or time to diagnostic evaluation between the intervention (n = 13) and control (n = 10) groups (P = .66). Median time to cancer diagnosis was 69 days (interquartile range, 62 to 88 days) and 101 days (interquartile range, 67 to 149 days) in the intervention and control groups, respectively (P = .04).
DISCUSSION
As compared with usual care, a prospective electronic trigger-based intervention using longitudinal EHR data can reduce time to diagnostic evaluation for prostate and colorectal cancer and increase the proportion of patients who receive follow-up. Furthermore, the intervention reduced the time to follow-up action by over a month in patients subsequently diagnosed with cancer. These findings have potential implications for ongoing efforts to improve timeliness of cancer diagnosis and can help health care organizations identify patients at risk for delays.
EHR-based triggers facilitate efficient identification of delays in care by filtering through thousands of records and flagging only those that require review. Current use of simple queries (eg, “find all patients with elevated PSA”) will produce too many records and are too nonspecific for practical use. Our intervention reduced the number of records requiring reviews to one eighth. Our just-in-time trigger application also acted as a safety net, necessitating communication of information when a potential lapse occurred but also allowing some time for diagnostic work-up to occur through usual care processes.
Both study sites used comprehensive EHRs and had integrated primary care, specialty care, and diagnostic services, characteristics that are expected to improve quality of care.44–46 Diagnostic evaluation of abnormal findings is likely to be worse in systems that are paper based12 or where care is more fragmented.47–49 Nevertheless, clinicians remain vulnerable to missing critical clinical findings, and trigger-based backup systems could be used to identify and prevent patients from falling through the cracks.50 This type of system-level intervention might also impact provider behaviors by giving them feedback about their timeliness of follow-up actions, a possible benefit that should be studied further.51
Our study provides a foundation for future work to leverage EHRs to facilitate near real-time detection and monitoring of high-priority delays and tracking of trends over time.52 Sophisticated trigger algorithms that reduce false-positive results and streamline the delivery of meaningful delay information could provide cognitive support to front-line providers.53 EHR-based triggers could be adapted to identify delays in cancer diagnosis at a system level and help navigate patients through the diagnostic process. Several current policy initiatives in the United States, England, and elsewhere are promoting effective communication and care coordination to minimize preventable harm.54–57 The costs of implementing a trigger-based intervention were quite modest, requiring only a part-time physician assistant to review charts 4 hours a week and a part-time staff member to send e-mails, make phone calls, and document results across the two large health systems for 1 to 2 hours a week. Not only is this effort on par with other patient safety implementations,58,59 but also a single part-time case manager could easily manage the intervention. Furthermore, triggers could reduce malpractice litigation costs related to harms from delays in diagnosis.60 Given the average diagnostic malpractice claim of approximately $290,000,61 prevention of even one claim makes this effort worthwhile.
Several limitations warrant discussion. First, although our intervention led to better follow-up, the study was not designed to test improvements in health outcomes. Although reducing unnecessary delays and increasing the proportion of patients receiving follow-up could improve cancer-related care,6,62 further work is needed to evaluate our intervention's effects on outcomes, including time to diagnosis, patient satisfaction, and stage at diagnosis. Second, findings may not be generalizable to other settings, and each trigger may not be applicable to each site. However, despite site-specific differences (eg, site A cared for an older, predominantly male population with more comorbidities and relied heavily on FOBT/fecal immunochemical test–based screening for colon cancer, whereas site B emphasized colonoscopy-based screening), the intervention had similar effectiveness across the two sites. In fact, this effectiveness with different patient populations and in two health systems with different financing models likely supports generalizability. Furthermore, triggers rely on standardized structured data fields and allow customization, and thus, wider use and site-specific customization (eg, shorter follow-up periods for more real-time detection) are possible. Third, reviews relied on EHR documentation, which might not always reflect the actual care delivered or rationale for not taking action. Nevertheless, we previously found little deviation between documentation and actual follow-up of abnormal results.18 Fourth, we were unable to identify a large enough sample to test the lung trigger by itself. However, when used, it successfully identified four patients with delays who were eventually diagnosed with cancer. Finally, important free-text information remains within progress notes and was not accessible to the trigger. Future research on triggers could use natural language processing techniques63 to analyze this information and improve trigger performance.
In conclusion, an electronic trigger-based intervention focused on patients with delayed diagnostic evaluation for cancer has the potential to improve proportions of patients receiving follow-up and the timeliness of follow-up. EHR-based interventions similar to ours could be useful to improve timeliness of diagnosis of cancer and other serious conditions.
Acknowledgment
We thank Dawn Begaye, Anne Robertson, Elise Russo, MPH, and Traber Giardina, MSW, for their contributions to this study.
Appendix
Table A1.
Univariable and Multivariable Survival Analyses on Time to Follow-Up
| Variable | Colorectal Cancer |
Prostate Cancer |
||||||
|---|---|---|---|---|---|---|---|---|
| Univariable |
Multivariable* |
Univariable |
Multivariable* |
|||||
| HR (95% CI) | P | HR (95% CI) | P | HR (95% CI) | P | HR (95% CI) | P | |
| Study group | ||||||||
| Control | Referent | Referent | Referent | Referent | Referent | Referent | Referent | Referent |
| Intervention | 1.73 (1.39 to 2.14) | < .001 | 1.71 (1.30 to 2.24) | < .001 | 2.34 (1.52 to 3.59) | < .001 | 2.50 (1.26 to 4.98) | .009 |
| Site | ||||||||
| A | Referent | Referent | Referent | Referent | Referent | Referent | Referent | Referent |
| B | 0.55 (0.39 to 0.78) | .001 | 0.70 (0.38 to 1.29) | .25 | 0.86 (0.52 to 1.41) | .55 | 1.63 (0.72 to 3.70) | .25 |
| Study group × site | ||||||||
| Control A | — | — | Referent | Referent | — | — | Referent | Referent |
| Control B | — | — | — | — | — | — | — | — |
| Intervention A | — | — | Referent | Referent | — | — | Referent | Referent |
| Intervention B | — | — | 0.92 (0.44 to 1.91) | .81 | — | — | 0.65 (0.19 to 2.27) | .50 |
| Patient age | 1.02 (1.00 to 1.03) | .01 | 1.00 (0.99 to 1.02) | .59 | 1.02 (0.98 to 1.07) | .25 | — | — |
| Patient comorbidities | 1.04 (0.96 to 1.12) | .30 | — | — | 1.08 (0.93 to 1.25) | .32 | — | — |
| Patient sex | ||||||||
| Male | Referent | Referent | Referent | Referent | — | — | — | — |
| Female | 0.59 (0.43 to 0.81) | .001 | 0.84 (0.57 to 1.25) | .40 | — | — | — | — |
| Patient race | ||||||||
| White | Referent | Referent | — | — | Referent | Referent | — | — |
| Nonwhite | 0.86 (0.69 to 1.06) | .17 | — | — | 1.12 (0.75 to 1.68) | .58 | — | — |
| Patient ethnicity | ||||||||
| Hispanic | Referent | Referent | — | — | Referent | Referent | — | — |
| Non-Hispanic | 1.01 (0.69 to 1.47) | .98 | — | — | 0.96 (0.53 to 1.76) | .53 | — | — |
| Provider age | 1.06 (0.94 to 1.18) | .35 | — | — | 1.00 (0.84 to 1.20) | .97 | — | — |
| Average hours per week of direct patient care | 1.08 (0.90 to 1.29) | .42 | — | — | 1.50 (1.02 to 2.20) | .04 | 1.27 (0.81 to 2.00) | .29 |
| Proportion of complex patients (≥ 3 comorbidities) | 1.07 (0.91 to 1.26) | .40 | — | — | 1.24 (0.94 to 1.64) | .12 | — | — |
| Provider experience | 1.00 (0.91 to 1.10) | .97 | — | — | 1.02 (0.87 to 1.20) | .81 | — | — |
| Point of contact† | ||||||||
| Provider | Referent | Referent | — | — | Referent | Referent | — | — |
| Nurse | 1.03 (0.80 to 1.32) | .85 | — | — | 1.06 (0.68 to 1.65) | .80 | — | — |
| Provider sex | ||||||||
| Male | Referent | Referent | Referent | Referent | Referent | Referent | Referent | Referent |
| Female | 1.42 (1.11 to 1.80) | .005 | 1.09 (0.83 to 1.44) | .52 | 1.71 (1.12 to 2.62) | .01 | 1.33 (0.73 to 2.41) | .35 |
In addition to central variables of interest (study group and site, along with their interaction), variables with P ≤ .10 in univariable Cox regression survival analyses were entered into multivariable survival analyses. Multivariable survival analyses were adjusted for clustering at the provider level using gamma-distributed shared frailty modeling.
Preferred point of contact was collected from all providers before group allocation; thus, this variable examines provider preferences.
Footnotes
Supported by the Agency for Health Care Research and Quality (Grant No. R18HS017820), the Veterans Affairs (VA) Health Services Research and Development Service (Grant No. CRE 12-033; Presidential Early Career Award for Scientists and Engineers USA 14-274), the VA National Center for Patient Safety, and, in part, the Houston VA Center for Innovations in Quality, Effectiveness, and Safety (Grant No. CIN 13–413).
The funding sources had no role in the design and conduct of the study; collection, management, analysis, and interpretation of the data; and preparation, review, or approval of the article. The views expressed in this article are those of the authors and do not necessarily reflect the position or policy of the Department of Veterans Affairs or the US government.
Clinical trial information: NCT01346839
Authors' disclosures of potential conflicts of interest are found in the article online at www.jco.org. Author contributions are found at the end of this article.
AUTHORS' DISCLOSURES OF POTENTIAL CONFLICTS OF INTEREST
Disclosures provided by the authors are available with this article at www.jco.org.
AUTHOR CONTRIBUTIONS
Conception and design: Daniel R. Murphy, Eric J. Thomas, Samuel N. Forjuoh, Hardeep Singh
Financial support: Hardeep Singh
Administrative support: Hardeep Singh
Collection and assembly of data: Daniel R. Murphy, Louis Wu, Samuel N. Forjuoh, Hardeep Singh
Data analysis and interpretation: Daniel R. Murphy, Ashley N.D. Meyer, Hardeep Singh
Manuscript writing: All authors
Final approval of manuscript: All authors
AUTHORS' DISCLOSURES OF POTENTIAL CONFLICTS OF INTEREST
Electronic Trigger-Based Intervention to Reduce Delays in Diagnostic Evaluation for Cancer: A Cluster Randomized Controlled Trial
The following represents disclosure information provided by authors of this manuscript. All relationships are considered compensated. Relationships are self-held unless noted. I = Immediate Family Member, Inst = My Institution. Relationships may not relate to the subject matter of this manuscript. For more information about ASCO's conflict of interest policy, please refer to www.asco.org/rwc or jco.ascopubs.org/site/ifc.
Daniel R. Murphy
No relationship to disclose
Louis Wu
No relationship to disclose
Eric J. Thomas
No relationship to disclose
Samuel N. Forjuoh
No relationship to disclose
Ashley N.D. Meyer
No relationship to disclose
Hardeep Singh
No relationship to disclose
REFERENCES
- 1.Markides GA, Newman CM. Medical malpractice claims in relation to colorectal malignancy in the National Health Service. Colorectal Dis. 2014;16:48–56. doi: 10.1111/codi.12408. [DOI] [PubMed] [Google Scholar]
- 2.Gandhi TK, Kachalia A, Thomas EJ, et al. Missed and delayed diagnoses in the ambulatory setting: A study of closed malpractice claims. Ann Intern Med. 2006;145:488–496. doi: 10.7326/0003-4819-145-7-200610030-00006. [DOI] [PubMed] [Google Scholar]
- 3.Phillips RL, Jr, Bartholomew LA, Dovey SM, et al. Learning from malpractice claims about negligent, adverse events in primary care in the United States. Qual Saf Health Care. 2004;13:121–126. doi: 10.1136/qshc.2003.008029. [DOI] [PMC free article] [PubMed] [Google Scholar]
- 4.Schiff GD, Puopolo AL, Huben-Kearney A, et al. Primary care closed claims experience of Massachusetts malpractice insurers. JAMA Intern Med. 2013;173:2063–2068. doi: 10.1001/jamainternmed.2013.11070. [DOI] [PubMed] [Google Scholar]
- 5.Savage JR, Weiner GM. Litigation in otolaryngology: Trends and recommendations. J Laryngol Otol. 2006;120:1001–1004. doi: 10.1017/S0022215106001812. [DOI] [PubMed] [Google Scholar]
- 6.Shin DW, Cho J, Kim SY, et al. Delay to curative surgery greater than 12 weeks is associated with increased mortality in patients with colorectal and breast cancer but not lung or thyroid cancer. Ann Surg Oncol. 2013;20:2468–2476. doi: 10.1245/s10434-013-2957-y. [DOI] [PubMed] [Google Scholar]
- 7.Tørring ML, Frydenberg M, Hansen RP, et al. Evidence of increasing mortality with longer diagnostic intervals for five common cancers: A cohort study in primary care. Eur J Cancer. 2013;49:2187–2198. doi: 10.1016/j.ejca.2013.01.025. [DOI] [PubMed] [Google Scholar]
- 8.Tørring ML, Frydenberg M, Hansen RP, et al. Time to diagnosis and mortality in colorectal cancer: A cohort study in primary care. Br J Cancer. 2011;104:934–940. doi: 10.1038/bjc.2011.60. [DOI] [PMC free article] [PubMed] [Google Scholar]
- 9.Nekhlyudov L, Latosinsky S. The interface of primary and oncology specialty care: From symptoms to diagnosis. J Natl Cancer Inst Monogr. 2010;2010:11–17. [Google Scholar]
- 10.Wahls T. Diagnostic errors and abnormal diagnostic tests lost to follow-up: A source of needless waste and delay to treatment. J Ambul Care Manage. 2007;30:338–343. doi: 10.1097/01.JAC.0000290402.89284.a9. [DOI] [PubMed] [Google Scholar]
- 11.Boohaker EA, Ward RE, Uman JE, et al. Patient notification and follow-up of abnormal test results. A physician survey. Arch Intern Med. 1996;156:327–331. [PubMed] [Google Scholar]
- 12.Callen JL, Westbrook JI, Georgiou A, et al. Failure to follow-up test results for ambulatory patients: A systematic review. J Gen Intern Med. 2011;27:1334–1348. doi: 10.1007/s11606-011-1949-5. [DOI] [PMC free article] [PubMed] [Google Scholar]
- 13.McFall SL, Smith DW. Lack of follow-up of prostate-specific antigen test results. Public Health Rep. 2009;124:718–725. doi: 10.1177/003335490912400514. [DOI] [PMC free article] [PubMed] [Google Scholar]
- 14.Murff HJ, Gandhi TK, Karson AK, et al. Primary care physician attitudes concerning follow-up of abnormal test results and ambulatory decision support systems. Int J Med Inform. 2003;71:137–149. doi: 10.1016/s1386-5056(03)00133-3. [DOI] [PubMed] [Google Scholar]
- 15.Lyratzopoulos G, Greenberg DC, Rubin GP, et al. Advanced stage diagnosis of cancer: Who is at greater risk? Expert Rev Anticancer Ther. 2012;12:993–996. doi: 10.1586/era.12.77. [DOI] [PubMed] [Google Scholar]
- 16.Singh H, Wilson L, Petersen L, et al. Improving follow-up of abnormal cancer screens using electronic health records: Trust but verify test result communication. BMC Med Inform Decis Mak. 2009;9:49. doi: 10.1186/1472-6947-9-49. [DOI] [PMC free article] [PubMed] [Google Scholar]
- 17.Singh H, Thomas EJ, Mani S, et al. Timely follow-up of abnormal diagnostic imaging test results in an outpatient setting: Are electronic medical records achieving their potential? Arch Intern Med. 2009;169:1578–1586. doi: 10.1001/archinternmed.2009.263. [DOI] [PMC free article] [PubMed] [Google Scholar]
- 18.Singh H, Arora HS, Vij MS, et al. Communication outcomes of critical imaging results in a computerized notification system. J Am Med Inform Assoc. 2007;14:459–466. doi: 10.1197/jamia.M2280. [DOI] [PMC free article] [PubMed] [Google Scholar]
- 19.Singh H, Thomas EJ, Sittig DF, et al. Notification of abnormal lab test results in an electronic medical record: Do any safety concerns remain? Am J Med. 2010;123:238–244. doi: 10.1016/j.amjmed.2009.07.027. [DOI] [PMC free article] [PubMed] [Google Scholar]
- 20.Jones R, Latinovic R, Charlton J, et al. Alarm symptoms in early diagnosis of cancer in primary care: Cohort study using General Practice Research Database. BMJ. 2007;334:1040. doi: 10.1136/bmj.39171.637106.AE. [DOI] [PMC free article] [PubMed] [Google Scholar]
- 21.Hamilton W, Lancashire R, Sharp D, et al. The risk of colorectal cancer with symptoms at different ages and between the sexes: A case-control study. BMC Med. 2009;7:17. doi: 10.1186/1741-7015-7-17. [DOI] [PMC free article] [PubMed] [Google Scholar]
- 22.Macleod U, Mitchell ED, Burgess C, et al. Risk factors for delayed presentation and referral of symptomatic cancer: Evidence for common cancers. Br J Cancer. 2009;101(suppl 2):S92–S101. doi: 10.1038/sj.bjc.6605398. [DOI] [PMC free article] [PubMed] [Google Scholar]
- 23.Nepple KG, Joudi FN, Hillis SL, et al. Prevalence of delayed clinician response to elevated prostate-specific antigen values. Mayo Clin Proc. 2008;83:439–448. doi: 10.4065/83.4.439. [DOI] [PubMed] [Google Scholar]
- 24.Singh H, Petersen LA, Daci K, et al. Reducing referral delays in colorectal cancer diagnosis: Is it about how you ask? Qual Saf Health Care. 2010;19:e27. doi: 10.1136/qshc.2009.033712. [DOI] [PMC free article] [PubMed] [Google Scholar]
- 25.Singh H, Spitzmueller C, Petersen NJ, et al. Primary care practitioners' views on test result management in EHR-enabled health systems: A national survey. J Am Med Inform Assoc. 2012;20:727–735. doi: 10.1136/amiajnl-2012-001267. [DOI] [PMC free article] [PubMed] [Google Scholar]
- 26.Lyratzopoulos G, Abel GA, McPhail S, et al. Measures of promptness of cancer diagnosis in primary care: Secondary analysis of national audit data on patients with 18 common and rarer cancers. Br J Cancer. 2013;108:686–690. doi: 10.1038/bjc.2013.1. [DOI] [PMC free article] [PubMed] [Google Scholar]
- 27.Fava GA, Guidi J. Information overload, the patient and the clinician. Psychother Psychosom. 2007;76:1–3. doi: 10.1159/000096358. [DOI] [PubMed] [Google Scholar]
- 28.Singh H, Spitzmueller C, Petersen NJ, et al. Information overload and missed test results in electronic health record-based settings. JAMA Intern Med. 2013;173:702–704. doi: 10.1001/2013.jamainternmed.61. [DOI] [PMC free article] [PubMed] [Google Scholar]
- 29.Woods DD, Patterson E, Roth EM. Can we ever escape from data overload? A cognitive systems diagnosis. Cognition Technol Work. 2002;4:22–36. [Google Scholar]
- 30.Murphy DR, Reis B, Sittig DF, et al. Notifications received by primary care practitioners in electronic health records: A taxonomy and time analysis. Am J Med. 2012;125:209.e1–209.e7. doi: 10.1016/j.amjmed.2011.07.029. [DOI] [PubMed] [Google Scholar]
- 31.Lyratzopoulos G, Vedsted P, Singh H. Understanding missed opportunities for more timely diagnosis of cancer in symptomatic patients after presentation. Br J Cancer. 2015;112(suppl 1):S84–S91. doi: 10.1038/bjc.2015.47. [DOI] [PMC free article] [PubMed] [Google Scholar]
- 32.Danforth KN, Smith AE, Loo RK, et al. Electronic clinical surveillance to improve outpatient care: Diverse applications within an integrated delivery system. http://repository.academyhealth.org/egems/vol2/iss1/9. [DOI] [PMC free article] [PubMed]
- 33.Bates DW, Evans RS, Murff H, et al. Detecting adverse events using information technology. J Am Med Inform Assoc. 2003;10:115–128. doi: 10.1197/jamia.M1074. [DOI] [PMC free article] [PubMed] [Google Scholar]
- 34.Murphy DR, Laxmisan A, Reis BA, et al. Electronic health record-based triggers to detect potential delays in cancer diagnosis. BMJ Qual Saf. 2014;23:8–16. doi: 10.1136/bmjqs-2013-001874. [DOI] [PubMed] [Google Scholar]
- 35.Murphy DR, Thomas EJ, Meyer AN, et al. Development and validation of electronic health record-based triggers to detect delays in follow-up of abnormal lung imaging findings. Radiology. 2015;11:142530. doi: 10.1148/radiol.2015142530. [DOI] [PMC free article] [PubMed] [Google Scholar]
- 36.Murff HJ, Patel VL, Hripcsak G, et al. Detecting adverse events for patient safety research: A review of current methodologies. J Biomed Inform. 2003;36:131–143. doi: 10.1016/j.jbi.2003.08.003. [DOI] [PubMed] [Google Scholar]
- 37.Szekendi MK, Sullivan C, Bobb A, et al. Active surveillance using electronic triggers to detect adverse events in hospitalized patients. Qual Saf Health Care. 2006;15:184–190. doi: 10.1136/qshc.2005.014589. [DOI] [PMC free article] [PubMed] [Google Scholar]
- 38.de Wet C, Bowie P. The preliminary development and testing of a global trigger tool to detect error and patient harm in primary-care records. Postgrad Med J. 2009;85:176–180. doi: 10.1136/pgmj.2008.075788. [DOI] [PubMed] [Google Scholar]
- 39.Schiff GD, Kim S, Krosnjar N, et al. Missed hypothyroidism diagnosis uncovered by linking laboratory and pharmacy data. Arch Intern Med. 2005;165:574–577. doi: 10.1001/archinte.165.5.574. [DOI] [PubMed] [Google Scholar]
- 40.Singh H, Giardina TD, Forjuoh SN, et al. Electronic health record-based surveillance of diagnostic errors in primary care. BMJ Qual Saf. 2012;21:93–100. doi: 10.1136/bmjqs-2011-000304. [DOI] [PMC free article] [PubMed] [Google Scholar]
- 41.Marcum ZA, Arbogast KL, Behrens MC, et al. Utility of an adverse drug event trigger tool in Veterans Affairs nursing facilities. Consult Pharm. 2013;28:99–109. doi: 10.4140/TCP.n.2013.99. [DOI] [PMC free article] [PubMed] [Google Scholar]
- 42.Singh H, Vij MS. Eight recommendations for policies for communicating abnormal test results. Jt Comm J Qual Patient Saf. 2010;36:226–232. doi: 10.1016/s1553-7250(10)36037-5. [DOI] [PubMed] [Google Scholar]
- 43.Bloom HS. Learning More from Social Experiments: Evolving Analytic Approaches. New York, NY: Russell Sage Foundation; 2006. [Google Scholar]
- 44.Jha AK, Perlin JB, Kizer KW, et al. Effect of the Transformation of the Veterans Affairs Health Care System on the quality of care. N Engl J Med. 2003;348:2218–2227. doi: 10.1056/NEJMsa021899. [DOI] [PubMed] [Google Scholar]
- 45.Kerr EA, Gerzoff RB, Krein SL, et al. Diabetes care quality in the Veterans Affairs Health Care System and commercial managed care: The TRIAD study. Ann Intern Med. 2004;141:272–281. doi: 10.7326/0003-4819-141-4-200408170-00007. [DOI] [PubMed] [Google Scholar]
- 46.Singh H, Kalavar J. Quality of care for hypertension and diabetes in federal- versus commercial-managed care organizations. Am J Med Qual. 2004;19:19–24. doi: 10.1177/106286060401900104. [DOI] [PubMed] [Google Scholar]
- 47.Sarkar U, Bonacum D, Strull W, et al. Challenges of making a diagnosis in the outpatient setting: A multi-site survey of primary care physicians. BMJ Qual Saf. 2012;21:641–648. doi: 10.1136/bmjqs-2011-000541. [DOI] [PMC free article] [PubMed] [Google Scholar]
- 48.Poon EG, Haas JS, Louise PuopoloA, et al. Communication factors in the follow-up of abnormal mammograms. J Gen Intern Med. 2004;19:316–323. doi: 10.1111/j.1525-1497.2004.30357.x. [DOI] [PMC free article] [PubMed] [Google Scholar]
- 49.Elder NC, McEwen TR, Flach J, et al. The management of test results in primary care: Does an electronic medical record make a difference? Fam Med. 2010;42:327–333. [PubMed] [Google Scholar]
- 50.Giardina TD, King BJ, Ignaczak A, et al. Root cause analysis reports help identify common factors in delayed diagnosis and treatment of outpatients. Health Aff (Millwood) 2013;32:1368–1375. doi: 10.1377/hlthaff.2013.0130. [DOI] [PMC free article] [PubMed] [Google Scholar]
- 51.Singh H, Sittig DF. Were my diagnosis and treatment correct? No news is not necessarily good news. J Gen Intern Med. 2014;29:1087–1089. doi: 10.1007/s11606-014-2890-1. [DOI] [PMC free article] [PubMed] [Google Scholar]
- 52.Sittig DF, Singh H. Electronic health records and national patient-safety goals. N Engl J Med. 2012;367:1854–1860. doi: 10.1056/NEJMsb1205420. [DOI] [PMC free article] [PubMed] [Google Scholar]
- 53.Singh H, Giardina TD, Petersen LA, et al. Exploring situational awareness in diagnostic errors in primary care. BMJ Qual Saf. 2012;21:30–38. doi: 10.1136/bmjqs-2011-000310. [DOI] [PMC free article] [PubMed] [Google Scholar]
- 54.Government Publishing Office. 111th Congress of the United States of America: Patient Protection and Affordable Care Act (Public Law 111-148) http://www.gpo.gov/fdsys/pkg/PLAW-111publ148/pdf/PLAW-111publ148.pdf.
- 55.Richards MA. The size of the prize for earlier diagnosis of cancer in England. Br J Cancer. 2009;101(suppl 2):S125–S129. doi: 10.1038/sj.bjc.6605402. [DOI] [PMC free article] [PubMed] [Google Scholar]
- 56.Richards MA. The National Awareness and Early Diagnosis Initiative in England: Assembling the evidence. Br J Cancer. 2009;101(suppl 2):S1–S4. doi: 10.1038/sj.bjc.6605382. [DOI] [PMC free article] [PubMed] [Google Scholar]
- 57.Health Service Circular HSC 2002/005. Cancer waiting times: Guidance on making and tracking progress on cancer waiting times. http://collection.europarchive.org/tna/20080107220102/http://dh.gov.uk/prod_consum_dh/idcplg?IdcService=GET_FILE&dID=22673&Rendition=Web.
- 58.Choksi VR, Marn CS, Bell Y, et al. Efficiency of a semiautomated coding and review process for notification of critical findings in diagnostic imaging. AJR Am J Roentgenol. 2006;186:933–936. doi: 10.2214/AJR.04.1913. [DOI] [PubMed] [Google Scholar]
- 59.Danforth KN, Early MI, Ngan S, et al. Automated identification of patients with pulmonary nodules in an integrated health system using administrative health plan data, radiology reports, and natural language processing. J Thorac Oncol. 2012;7:1257–1262. doi: 10.1097/JTO.0b013e31825bd9f5. [DOI] [PMC free article] [PubMed] [Google Scholar]
- 60.Chandra A, Nundy S, Seabury SA. The growth of physician medical malpractice payments: Evidence from the National Practitioner Data Bank. Health Aff. doi: 10.1377/hlthaff.w5.240. (Millwood) W5-240-W5-249, 2005 (suppl Web exclusives) [DOI] [PubMed] [Google Scholar]
- 61.Bishop TF, Ryan AM, Ryan AK. Paid malpractice claims for adverse events in inpatient and outpatient settings. JAMA. 2011;305:2427–2431. doi: 10.1001/jama.2011.813. [DOI] [PubMed] [Google Scholar]
- 62.Jensen AR, Mainz J, Overgaard J. Impact of delay on diagnosis and treatment of primary lung cancer. Acta Oncol. 2002;41:147–152. doi: 10.1080/028418602753669517. [DOI] [PubMed] [Google Scholar]
- 63.Joshi AK. Natural language processing. Science. 1991;253:1242–1249. doi: 10.1126/science.253.5025.1242. [DOI] [PubMed] [Google Scholar]