Abstract
Purpose
Survivors of childhood cancer have an increased risk for subsequent neoplasms (SNs), but the incidence beyond the age of 40 years and associations with therapeutic exposures have not been well described.
Patients and Methods
Among 14,364 survivors of childhood cancer diagnosed between 1970 and 1986, 3,171 had an attained age of 40 years or older at the time of last contact. Cumulative incidence of SNs, standardized incidence ratios (SIRs), excess absolute risk of subsequent malignant neoplasms (SMNs), and relative risks (RRs) for SMNs and nonmelanoma skin cancers were calculated.
Results
In total, 679 SNs were diagnosed in patients age 40 years or older. These included 196 SMNs, 419 nonmelanoma skin cancers, 21 nonmalignant meningiomas, and 43 other benign neoplasms. At age 55 years, the cumulative incidence of new SNs and SMNs occurring after age 40 years was 34.6% (95% CI, 28.7 to 40.6) and 16.3% (95% CI, 11.7 to 20.9), respectively. Survivors were twice as likely as the general population to receive a diagnosis of SMN after age 40 years (SIR, 2.2; 95% CI, 1.9 to 2.5). Among SMNs, risk was increased for breast cancer (SIR, 5.5; 95% CI, 4.5 to 6.7), renal cancer (SIR, 3.9; 95% CI, 2.0 to 7.5), soft tissue sarcoma (SIR, 2.6; 95% CI, 1.5 to 4.4), and thyroid cancer (SIR, 1.9; 95% CI, 1.0 to 3.5). Female sex (RR, 1.9; 95% CI, 1.3 to 2.6; P < .001) and therapeutic radiation exposure (RR, 2.2; 95% CI, 1.4 to 3.3; P < .001) were associated with an increased for risk for SMN in multivariable analysis.
Conclusion
Even after age 40 years, survivors of childhood cancer remain at increased risk for treatment-related SNs. These data suggest the need for life-long monitoring and should inform anticipatory guidance provided to survivors of childhood cancer.
INTRODUCTION
Survival after a diagnosis of childhood cancer has increased substantially over the past four decades, with five-year survival now exceeding 80%.1 One of the most serious late effects of childhood cancer is the development of subsequent neoplasms (SNs). The current body of literature reports in detail the risk of second cancers in 5- to 20-year survivors of childhood cancer.2–8 It is also clear that within the survivor population the incidence of SNs does not plateau with time.2,8,9 In a 2001 Childhood Cancer Survivor Study (CCSS) report of subsequent malignant neoplasms (SMNs),8 a 20-year cumulative incidence of 3.2% was reported, and in an updated report from 2010,2 a 30-year cumulative incidence of 7.9% was reported, with an increased incidence relative to the general population evident in both reports (standardized incidence ratio [SIR], 6.4; 95% CI, 5.7 to 7.1; and SIR, 6.0; 95% CI, 5.5 to 6.4, respectively). These findings highlight the importance of ongoing surveillance over sufficiently long follow-up. In addition to an increased cumulative incidence of SNs with increasing time from diagnosis, survivors who survive their first SN remain at risk for additional neoplasms. Many survivors will experience multiple SNs with increasing age,10 a finding that has only become apparent as the cohort has matured. Given this evidence, ongoing surveillance throughout the survivor life span is needed.
At present, limited data exist regarding the incidence of SNs in survivors of childhood cancer in the fifth and sixth decades of life.11–16 In addition, it is unknown whether associations with treatment for the primary cancer, which are seen in the first four decades, persist into later adulthood. Given the importance of this knowledge for predicting risks and providing anticipatory guidance to the aging population of survivors of childhood cancer, we present a comprehensive analysis focusing on the cumulative incidence of SNs and risk of SMNs in the fifth decade and later in survivors from the CCSS.
PATIENTS AND METHODS
The CCSS Cohort
The CCSS, initiated in 1994, is a retrospective cohort with ongoing, longitudinal observation of survivors of childhood cancer. Cohort characteristics and methods have previously been reported.17–19 Initial diagnoses included leukemia, Hodgkin lymphoma (HL), non-Hodgkin lymphoma, neuroblastoma, soft tissue sarcoma, bone cancer, CNS malignancy, and Wilms tumor. Eligible patients received a diagnosis at one of 26 collaborating institutions in the United States or Canada between January 1, 1970, and December 31, 1986, were younger than 21 years at the time of diagnosis, and survived at least 5 years from the time of initial cancer diagnosis. Approval from the human subjects committee was granted at participating institutions before participant were recruited, and participants provided informed consent. Participants completed a baseline questionnaire and were given four follow-up questionnaire opportunities.
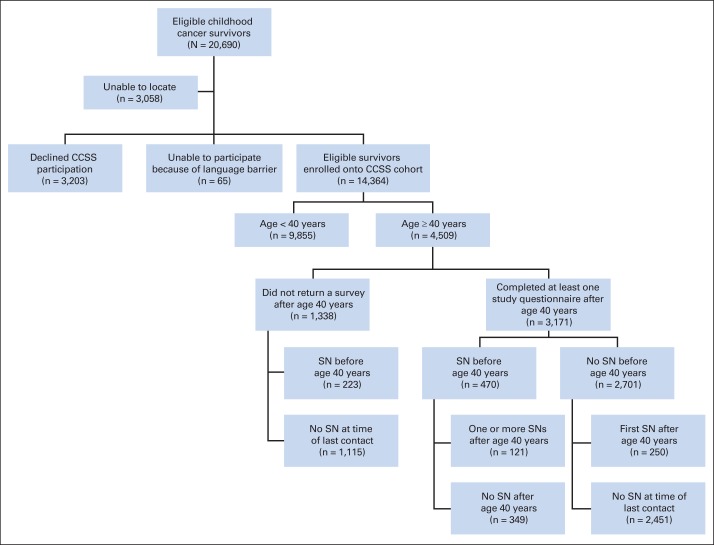
The CCSS cohort consists of 14,364 participating survivors (Fig 1). The current analysis is limited to cohort participants who completed at least one study questionnaire after reaching age 40 years (N = 3,171), including those who died after questionnaire completion.
Fig 1.
Patient flow diagram of eligible survivors from the Childhood Cancer Survivor Study (CCSS) age 40 years or older. SN, subsequent neoplasm.
Identification and Validation of SNs
SNs were initially identified by means of self- or proxy-report questionnaires and/or death certificates and were confirmed by using pathology reports, or, when unavailable, certificate or medical records. SNs were further classified into four mutually exclusive groups: SMNs, which included invasive neoplasms classified as International Classification of Diseases for Oncology (ICD-O), 2nd Edition, behavior code of 3,20 excluding nonmelanoma skin cancers (NMSCs); NMSCs including ICD-O morphology codes 8070, 8071, 8081, 8090, and 8094; nonmalignant meningiomas; and other benign neoplasms with an ICD-O behavior code of 0, 1, or 2, regardless of site or morphology. Therapeutic exposures, including surgery, chemotherapy, and radiation, were ascertained by abstracting medical records, as previously described.17,18
Statistical Analysis
Cumulative incidence estimates were calculated beginning at age 40 years for all SN events and for the SN subgroups of SMN, NMSC, and meningioma using age as the time scale, treating death as a competing risk event, and with follow-up censored at the time of last contact. Risk for SMN was calculated using SIRs and excess absolute risk (EAR) per 1,000 person-years. SIRs and EARs were calculated for SMNs reported after age 40 years using age, sex, and calendar year US cancer rates from the Surveillance, Epidemiology, and End Results (SEER) program21 to evaluate expected numbers of events. NMSCs and nonmalignant meningiomas were not included in SIR or EAR calculations because NMSCs are not reported by SEER and benign meningiomas were not reported by SEER during the study period.
Poisson multivariable regression models, with age as the time scale, were performed to estimate relative risks (RRs) of the patients' developing an SMN or NMSC for several host characteristics and treatment variables, as well as for the effect of SN before the age of 40 years. For SMN models, SEER rates were used as the offset terms so that risks were standardized by expected rates for same age, sex, and calendar year subjects. Therefore, RRs for SMNs could be interpreted as ratios of SIRs for different covariate levels. NMSC models were not standardized in this way. Multivariable models were developed by adding and subtracting risk factors sequentially, and by selecting the best-fitting model, as measured by the quasi-likelihood information criterion, while we took into consideration the nonindependence of some combinations of risk factors.22 All statistical tests were two sided, and statistical significance was defined as P < 0.05.
RESULTS
Cohort Characteristics
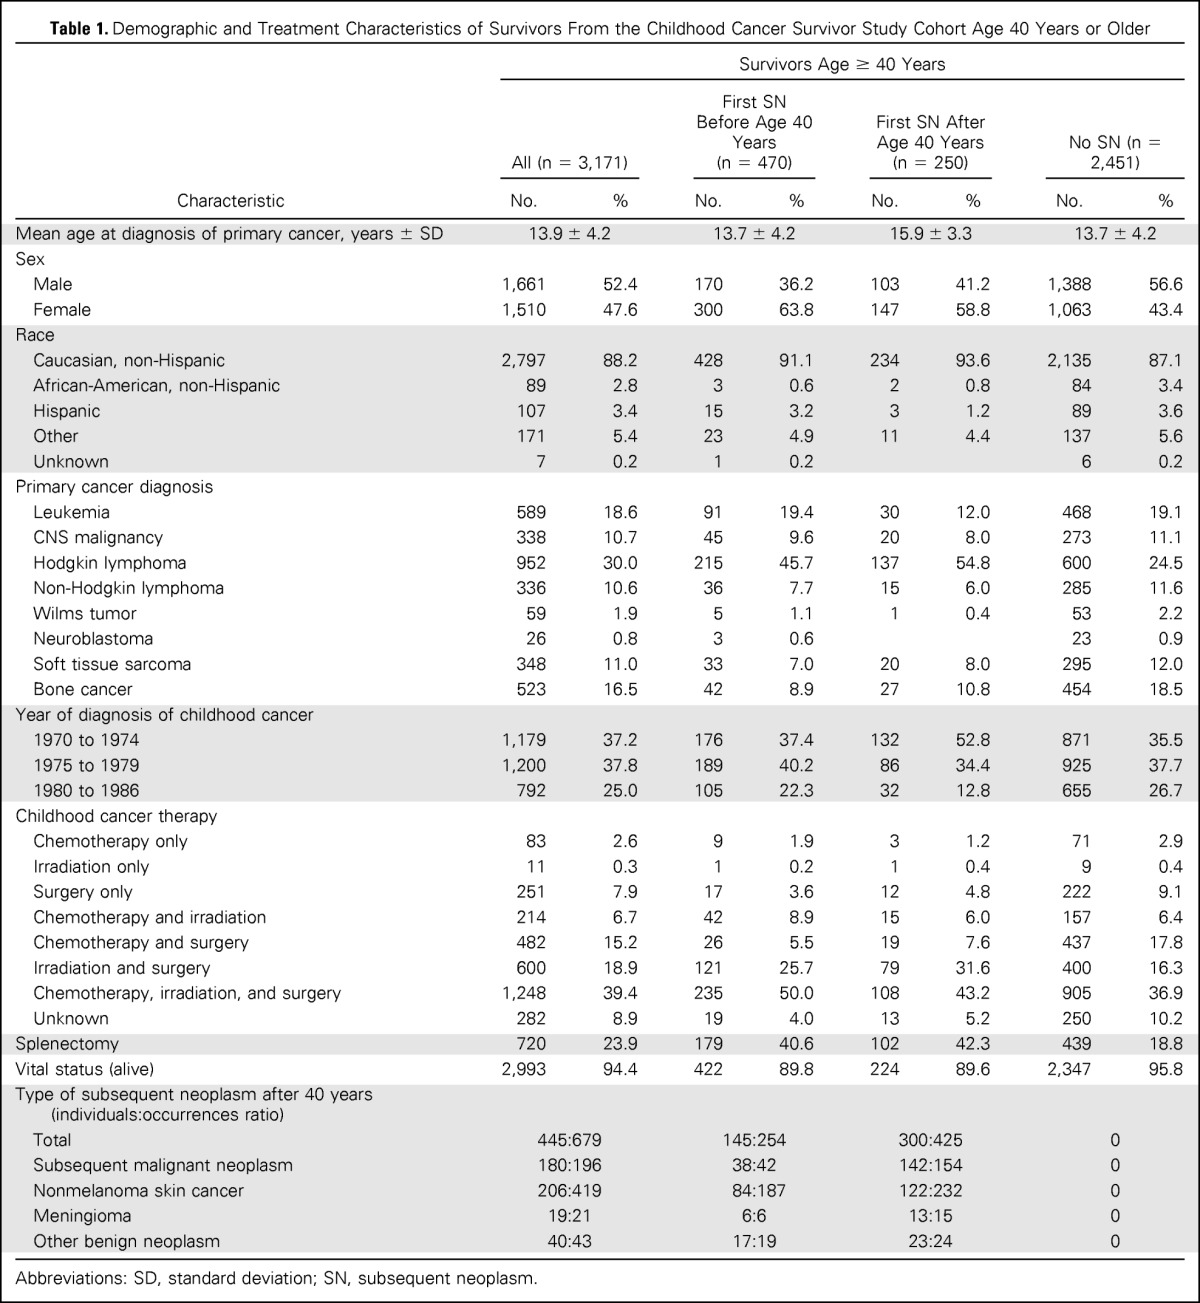
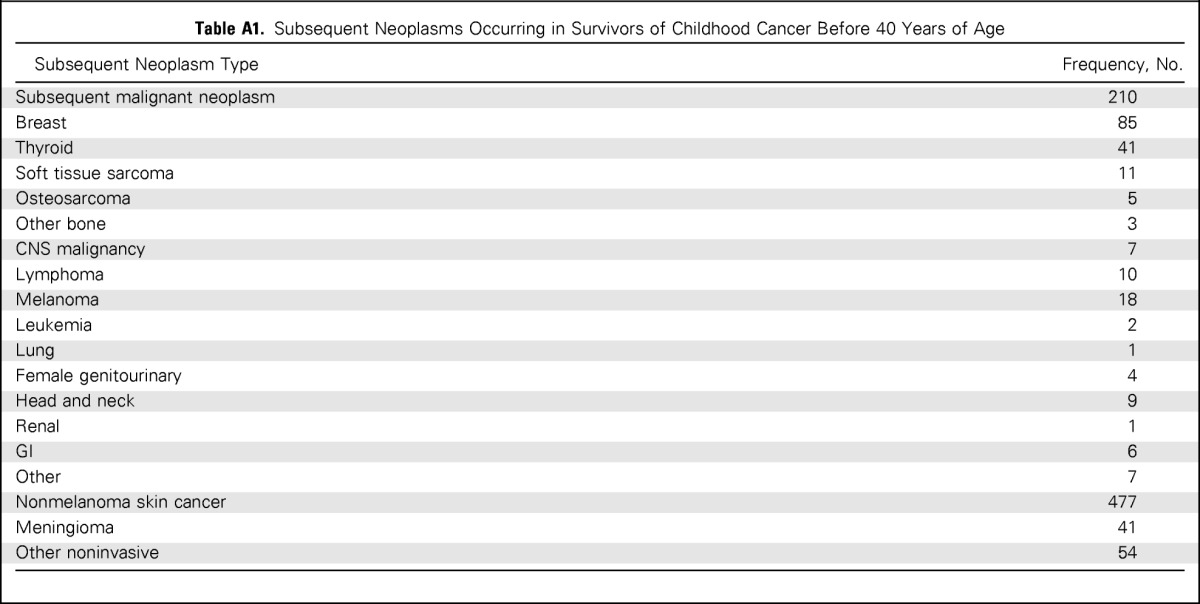
Among 14,364 cohort members, 3,171 completed at least one study questionnaire after age 40 years. These individuals accrued 15,985 person-years of follow-up after age 40. The median age of this group was 44 years (range, 40 to 58 years). Demographic and treatment characteristics are included in Table 1. Diagnosed at 40 years of age or older were 679 SNs, including 196 SMNs, 419 NMSCs, 21 nonmalignant meningiomas, and 43 other noninvasive neoplasms. Of the survivors, 470 (14.8%) had an SN before age 40 years (Appendix Table A1, online only), and 2,701 did not. Among those without a previous SN, 250 had their first SN after turning 40 years old, leaving 2,451 without an SN at the time of last contact (Fig 1).
Table 1.
Demographic and Treatment Characteristics of Survivors From the Childhood Cancer Survivor Study Cohort Age 40 Years or Older
| Characteristic | Survivors Age ≥ 40 Years |
|||||||
|---|---|---|---|---|---|---|---|---|
| All (n = 3,171) |
First SN Before Age 40 Years (n = 470) |
First SN After Age 40 Years (n = 250) |
No SN (n = 2,451) |
|||||
| No. | % | No. | % | No. | % | No. | % | |
| Mean age at diagnosis of primary cancer, years ± SD | 13.9 ± 4.2 | 13.7 ± 4.2 | 15.9 ± 3.3 | 13.7 ± 4.2 | ||||
| Sex | ||||||||
| Male | 1,661 | 52.4 | 170 | 36.2 | 103 | 41.2 | 1,388 | 56.6 |
| Female | 1,510 | 47.6 | 300 | 63.8 | 147 | 58.8 | 1,063 | 43.4 |
| Race | ||||||||
| Caucasian, non-Hispanic | 2,797 | 88.2 | 428 | 91.1 | 234 | 93.6 | 2,135 | 87.1 |
| African-American, non-Hispanic | 89 | 2.8 | 3 | 0.6 | 2 | 0.8 | 84 | 3.4 |
| Hispanic | 107 | 3.4 | 15 | 3.2 | 3 | 1.2 | 89 | 3.6 |
| Other | 171 | 5.4 | 23 | 4.9 | 11 | 4.4 | 137 | 5.6 |
| Unknown | 7 | 0.2 | 1 | 0.2 | 6 | 0.2 | ||
| Primary cancer diagnosis | ||||||||
| Leukemia | 589 | 18.6 | 91 | 19.4 | 30 | 12.0 | 468 | 19.1 |
| CNS malignancy | 338 | 10.7 | 45 | 9.6 | 20 | 8.0 | 273 | 11.1 |
| Hodgkin lymphoma | 952 | 30.0 | 215 | 45.7 | 137 | 54.8 | 600 | 24.5 |
| Non-Hodgkin lymphoma | 336 | 10.6 | 36 | 7.7 | 15 | 6.0 | 285 | 11.6 |
| Wilms tumor | 59 | 1.9 | 5 | 1.1 | 1 | 0.4 | 53 | 2.2 |
| Neuroblastoma | 26 | 0.8 | 3 | 0.6 | 23 | 0.9 | ||
| Soft tissue sarcoma | 348 | 11.0 | 33 | 7.0 | 20 | 8.0 | 295 | 12.0 |
| Bone cancer | 523 | 16.5 | 42 | 8.9 | 27 | 10.8 | 454 | 18.5 |
| Year of diagnosis of childhood cancer | ||||||||
| 1970 to 1974 | 1,179 | 37.2 | 176 | 37.4 | 132 | 52.8 | 871 | 35.5 |
| 1975 to 1979 | 1,200 | 37.8 | 189 | 40.2 | 86 | 34.4 | 925 | 37.7 |
| 1980 to 1986 | 792 | 25.0 | 105 | 22.3 | 32 | 12.8 | 655 | 26.7 |
| Childhood cancer therapy | ||||||||
| Chemotherapy only | 83 | 2.6 | 9 | 1.9 | 3 | 1.2 | 71 | 2.9 |
| Irradiation only | 11 | 0.3 | 1 | 0.2 | 1 | 0.4 | 9 | 0.4 |
| Surgery only | 251 | 7.9 | 17 | 3.6 | 12 | 4.8 | 222 | 9.1 |
| Chemotherapy and irradiation | 214 | 6.7 | 42 | 8.9 | 15 | 6.0 | 157 | 6.4 |
| Chemotherapy and surgery | 482 | 15.2 | 26 | 5.5 | 19 | 7.6 | 437 | 17.8 |
| Irradiation and surgery | 600 | 18.9 | 121 | 25.7 | 79 | 31.6 | 400 | 16.3 |
| Chemotherapy, irradiation, and surgery | 1,248 | 39.4 | 235 | 50.0 | 108 | 43.2 | 905 | 36.9 |
| Unknown | 282 | 8.9 | 19 | 4.0 | 13 | 5.2 | 250 | 10.2 |
| Splenectomy | 720 | 23.9 | 179 | 40.6 | 102 | 42.3 | 439 | 18.8 |
| Vital status (alive) | 2,993 | 94.4 | 422 | 89.8 | 224 | 89.6 | 2,347 | 95.8 |
| Type of subsequent neoplasm after 40 years (individuals:occurrences ratio) | ||||||||
| Total | 445:679 | 145:254 | 300:425 | 0 | ||||
| Subsequent malignant neoplasm | 180:196 | 38:42 | 142:154 | 0 | ||||
| Nonmelanoma skin cancer | 206:419 | 84:187 | 122:232 | 0 | ||||
| Meningioma | 19:21 | 6:6 | 13:15 | 0 | ||||
| Other benign neoplasm | 40:43 | 17:19 | 23:24 | 0 | ||||
Abbreviations: SD, standard deviation; SN, subsequent neoplasm.
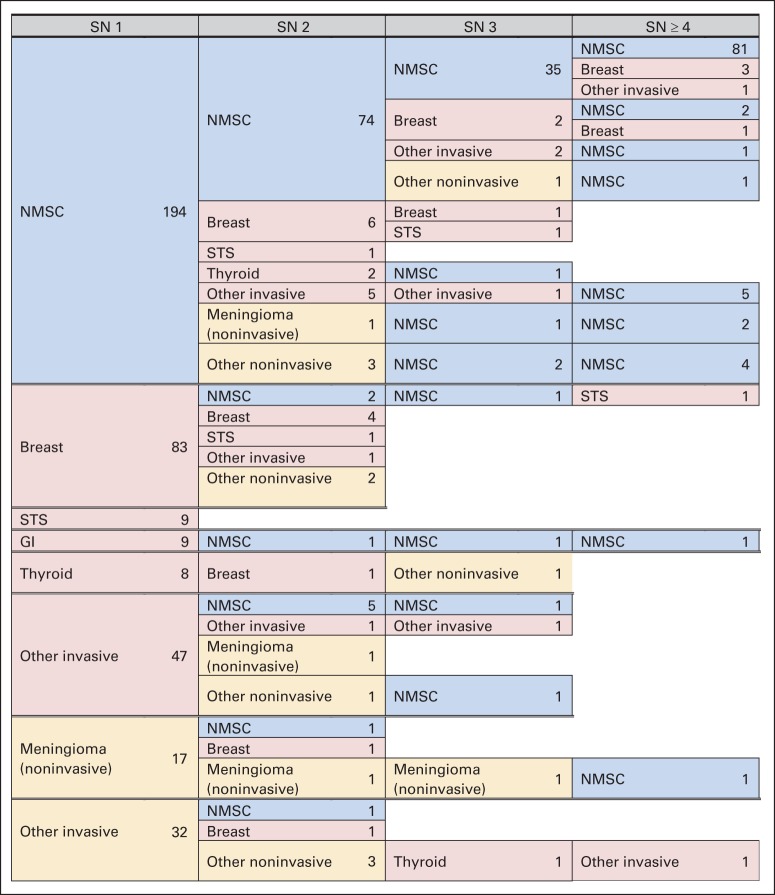
Female survivors accounted for 47.6% of survivors age 40 years or older, but they represented 62% of individuals with an SN (Table 1). Survivors of HL had a disproportionate number of SNs compared with those with other primary diagnoses (48.9%). The distribution of SNs, specifically, SMN, NMSC, or meningioma, is shown in Table 1. Patterns of multiple SNs within individuals are shown in Figure 2.
Fig 2.
Patterns of multiple subsequent neoplasms (SNs) in survivors age 40 years or older. NMSC, nonmelanoma skin cancer; STS, soft tissue sarcoma.
Cumulative Incidence of SNs
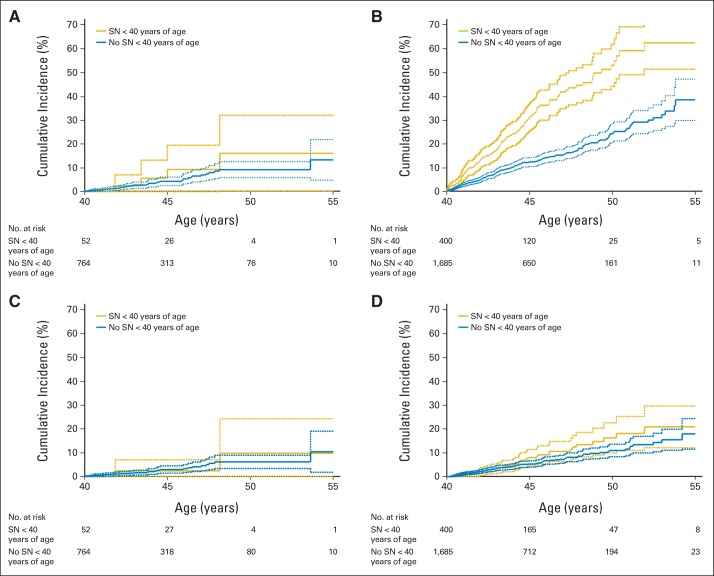
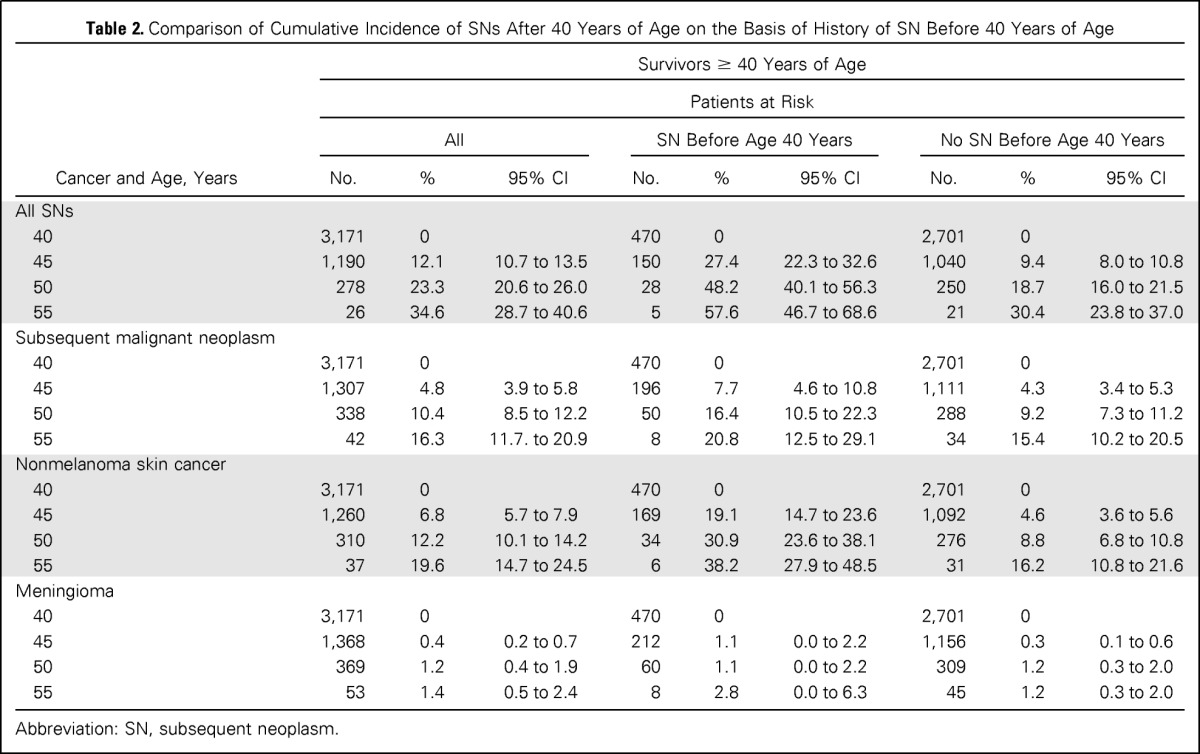
The cumulative incidence of an SN after age 40 years increased rapidly, reaching 34.6% (95% CI, 28.7 to 40.6) at age 55 years (Fig 3 and Table 2). The cumulative incidence at age 55 years was higher among survivors with an SN before age 40 years (57.6%; 95% CI, 46.7 to 68.6) compared with those with no history of SN (30.4%; 95% CI, 23.8 to 37; P = .001; Table 2). The cumulative incidence of an SMN after age 40 years reached 16.3% (95% CI, 11.7 to 20.9) at age 55 years (Fig 3) and was similar for survivors with or without a previous SN (20.8%; 95% CI, 12.5 to 29.1; or 15.4%; 95% CI, 10.2 to 20.5, respectively; P = .35; Table 2). By age 55, the cumulative incidence of NMSCs was 19.6% (95% CI, 14.7 to 24.5), with a higher cumulative incidence of NMSCs observed in survivors with a previous SN (38.2%; 95% CI, 27.9 to 48.5) compared with those without a previous SN (16.2%; 95% CI, 10.8 to 21.6). Treatment with radiation, combined with a history of SN, was associated with the highest cumulative incidence of SN (62.3%; 95% CI, 51.2 to 73.5). The lowest cumulative incidence occurred among survivors without previous radiation therapy and no previous SN (13.3%; 95% CI, 4.8 to 21.8; Fig 4).
Fig 3.
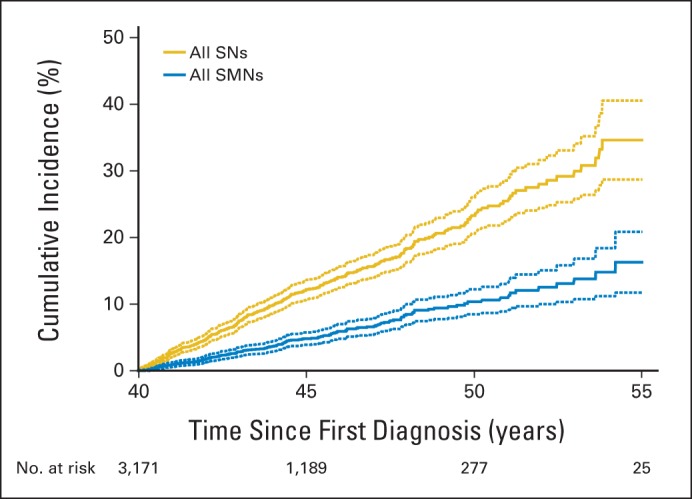
Cumulative incidence of new subsequent neoplasms (SNs) and subsequent malignant neoplasms (SMNs) diagnosed in survivors from the Childhood Cancer Survivor Study age 40 years or older. Solid lines are calculated cumulative incidence values; dashed lines are 95% CIs.
Table 2.
Comparison of Cumulative Incidence of SNs After 40 Years of Age on the Basis of History of SN Before 40 Years of Age
| Cancer and Age, Years | Survivors ≥ 40 Years of Age |
||||||||
|---|---|---|---|---|---|---|---|---|---|
| Patients at Risk | |||||||||
| All |
SN Before Age 40 Years |
No SN Before Age 40 Years |
|||||||
| No. | % | 95% CI | No. | % | 95% CI | No. | % | 95% CI | |
| All SNs | |||||||||
| 40 | 3,171 | 0 | 470 | 0 | 2,701 | 0 | |||
| 45 | 1,190 | 12.1 | 10.7 to 13.5 | 150 | 27.4 | 22.3 to 32.6 | 1,040 | 9.4 | 8.0 to 10.8 |
| 50 | 278 | 23.3 | 20.6 to 26.0 | 28 | 48.2 | 40.1 to 56.3 | 250 | 18.7 | 16.0 to 21.5 |
| 55 | 26 | 34.6 | 28.7 to 40.6 | 5 | 57.6 | 46.7 to 68.6 | 21 | 30.4 | 23.8 to 37.0 |
| Subsequent malignant neoplasm | |||||||||
| 40 | 3,171 | 0 | 470 | 0 | 2,701 | 0 | |||
| 45 | 1,307 | 4.8 | 3.9 to 5.8 | 196 | 7.7 | 4.6 to 10.8 | 1,111 | 4.3 | 3.4 to 5.3 |
| 50 | 338 | 10.4 | 8.5 to 12.2 | 50 | 16.4 | 10.5 to 22.3 | 288 | 9.2 | 7.3 to 11.2 |
| 55 | 42 | 16.3 | 11.7. to 20.9 | 8 | 20.8 | 12.5 to 29.1 | 34 | 15.4 | 10.2 to 20.5 |
| Nonmelanoma skin cancer | |||||||||
| 40 | 3,171 | 0 | 470 | 0 | 2,701 | 0 | |||
| 45 | 1,260 | 6.8 | 5.7 to 7.9 | 169 | 19.1 | 14.7 to 23.6 | 1,092 | 4.6 | 3.6 to 5.6 |
| 50 | 310 | 12.2 | 10.1 to 14.2 | 34 | 30.9 | 23.6 to 38.1 | 276 | 8.8 | 6.8 to 10.8 |
| 55 | 37 | 19.6 | 14.7 to 24.5 | 6 | 38.2 | 27.9 to 48.5 | 31 | 16.2 | 10.8 to 21.6 |
| Meningioma | |||||||||
| 40 | 3,171 | 0 | 470 | 0 | 2,701 | 0 | |||
| 45 | 1,368 | 0.4 | 0.2 to 0.7 | 212 | 1.1 | 0.0 to 2.2 | 1,156 | 0.3 | 0.1 to 0.6 |
| 50 | 369 | 1.2 | 0.4 to 1.9 | 60 | 1.1 | 0.0 to 2.2 | 309 | 1.2 | 0.3 to 2.0 |
| 55 | 53 | 1.4 | 0.5 to 2.4 | 8 | 2.8 | 0.0 to 6.3 | 45 | 1.2 | 0.3 to 2.0 |
Abbreviation: SN, subsequent neoplasm.
Fig 4.
Cumulative incidence curves on the basis of previous history of subsequent neoplasm (SN) and radiation therapy (RT). (A) SNs after age 40 years in individuals who did not receive RT for their primary disease. (B) SNs after age 40 years in individuals who did receive RT for their primary disease. (C) Subsequent malignant neoplasms (SMNs) after age 40 years without previous RT. (D) SMNs after age 40 years with previous RT. Solid lines are calculated cumulative incidence values, and dashed lines are 95% CIs.
Risk of SMNs Among Survivors With a History of SN Before Age 40 Years
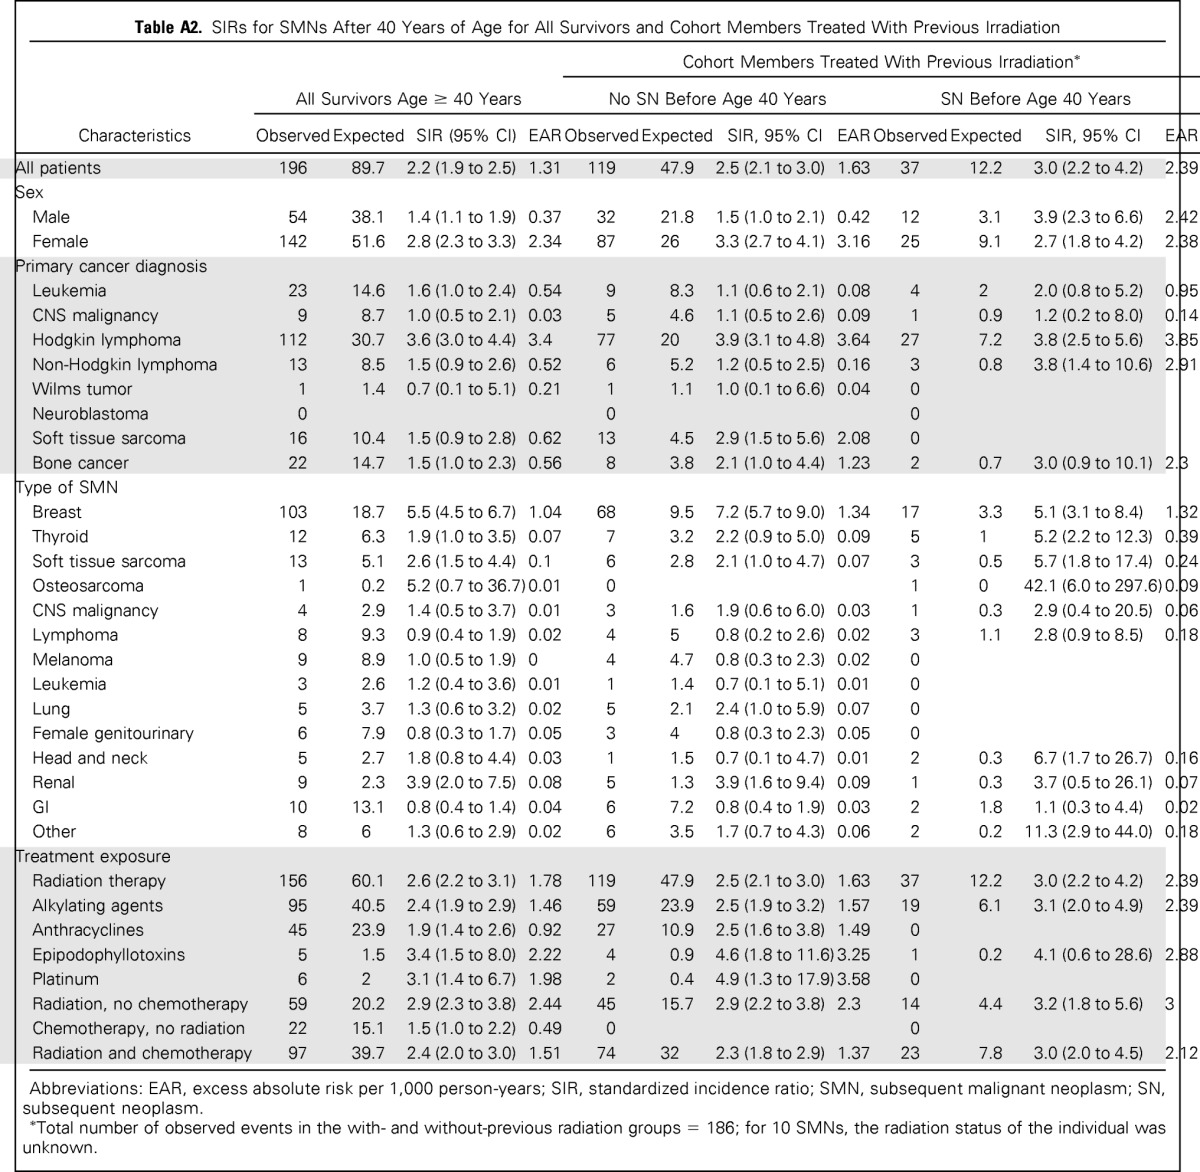
Among the 470 survivors with an SN before age 40, 121 experienced one or more SNs after age 40 years. Forty-two SMNs were observed, with 30 occurring in women (SIR, 3.0; 95% CI, 2.2 to 4.0). HL had the greatest risk among the primary diagnoses (SIR, 3.8; 95% CI, 2.5 to 5.6; EAR, 3.81 per 1,000 person-years). Treatments associated with increased risk of SMN included radiation (SIR, 3.0; 95% CI, 2.2 to 4.2) and alkylating agents (SIR, 2.9; 95% CI, 1.9 to 4.6). Among SMNs, risk was increased for breast cancer (SIR, 5.0; 95% CI, 3.1 to 7.9), cancers of the thyroid (SIR, 4.4; 95% CI, 1.9 to 10.6), head and neck (SIR, 8.6; 95% CI, 2.8 to 26.6), kidney (SIR, 6.3; 95% CI, 1.6 to 25.3), and soft tissue sarcomas (SIR, 4.8; 95% CI, 1.6 to 14.8).
Risk of SMNs Among Survivors Without a History of SN Before Age 40 Years
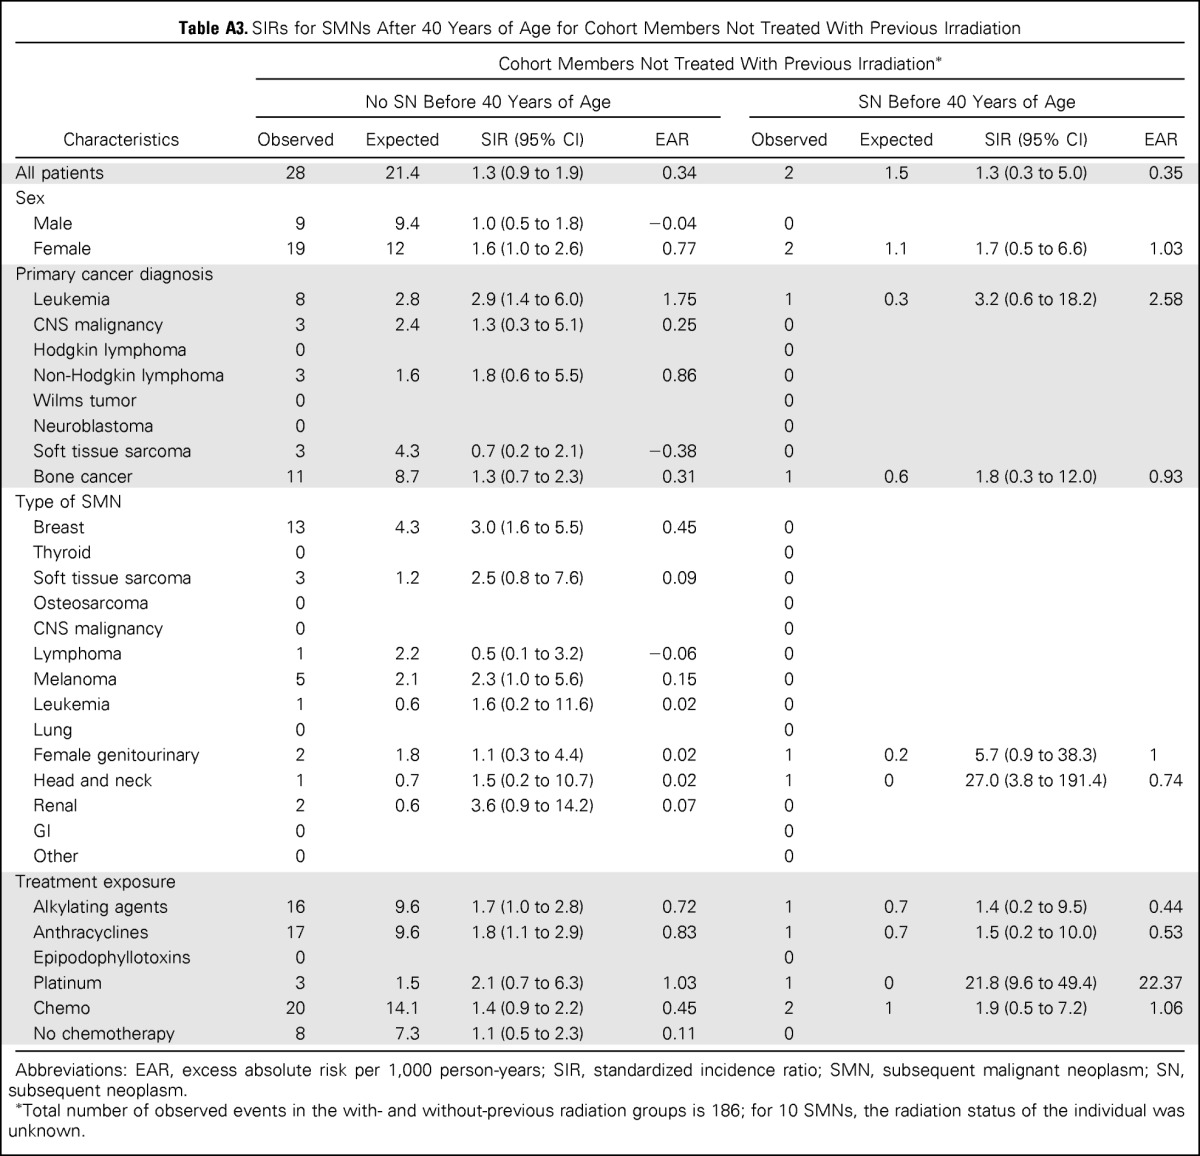
Of the survivors without a previous SN, after age 40 years, 250 had one or more SNs, including 154 SMNs (Table 1). Risk was significantly increased among women (SIR, 2.7; 95% CI, 2.3 to 3.3; EAR, 2.3 per 1,000 person-years) and survivors of HL (SIR, 3.6; 95% CI, 2.9 to 4.4; EAR, 3.28 per 1,000 person-years). Among SMNs, risk was increased for breast cancer (SIR, 5.7; 95% CI, 4.6 to 7.0), renal cancer (SIR, 3.5; 95% CI, 1.7 to 7.3), and soft tissue sarcoma (SIR, 2.2; 95% CI, 1.2 to 4.2). Of the therapeutic exposures, those associated with an increased risk of SMN were radiation (SIR, 2.5; 95% CI, 2.1 to 3.0), alkylating agents (SIR, 2.2; 95% CI, 1.8 to 2.8), anthracyclines (SIR, 2.1; 95% CI, 1.6 to 3.0), epipodophyllotoxins (SIR, 3.3; 95% CI, 1.3 to 8.5) and platinum (SIR, 2.6; 95% CI, 1.1 to 6.2). The risk of SMN was not increased among individuals with no history of SN before age 40 years who did not receive therapeutic radiation (Appendix Tables A2 and A3, online only).
Multivariable Analyses
In the multivariable Poisson regression model for SMNs, candidate risk factors included sex; age at primary diagnosis; history of SN before age 40 years; therapeutic radiation for the primary diagnosis; chemotherapy for the primary diagnosis; and specific classes of chemotherapeutic agents, namely, alkylating agents, anthracyclines, epipodophyllotoxins, and platinum. Female sex (RR, 1.9; 95% CI, 1.3 to 2.6), platinum chemotherapy (RR, 2.3; CI, 1.0 to 5.2), and therapeutic radiation (RR, 2.2; 95% CI, 1.4 to 3.3) remained significantly associated with increased risk of SMN (Appendix Table A4, online only). History of SN before age 40 years was not significant in this model.
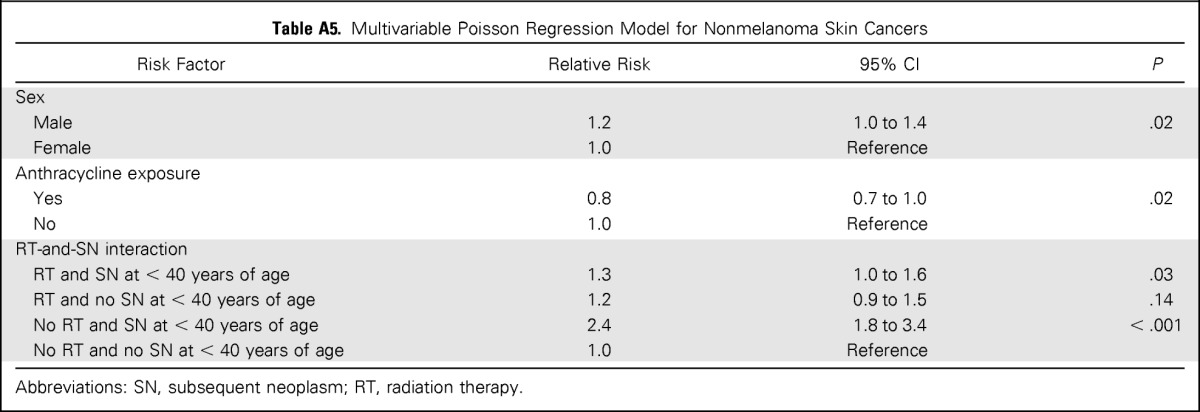
A multivariable analysis for NMSC, including sex, SN before age 40 years, therapeutic radiation exposure for primary diagnosis, and anthracycline exposure, was performed. Male sex was associated with increased risk (RR, 1.2; 95% CI, 1.0 to 1.4). A significant interaction between therapeutic radiation exposure and history of SN before age 40 years was observed such that individuals with previous radiation exposure and a history of SN (RR, 1.3; 95% CI, 1.0 to 1.6), and individuals without exposure to radiation and a SN before age 40 years (RR, 2.4; 95% CI, 1.7 to 3.4), were at increased risk for NMSC compared with those with neither. In contrast, survivors with pervious radiation exposure, but lack of SN history before age 40, did not have a significantly elevated risk of NMSC (Appendix Table A5, online only).
DISCUSSION
We present a comprehensive report on the occurrence of new SNs experienced after 40 years of age among survivors of childhood cancer, with an assessment of risk on the basis of therapeutic exposures during childhood. The risk of developing a SN remains elevated beyond that expected in the general population, even as survivors are entering an age range in which cancer risk increases for the general population. In addition, survivors with an SN before age 40 years, compared with those with no previous SN, had an increased incidence of NMSCs, but this was not a risk factor for SMNs or meningiomas. Therefore, individuals with and those without a previous SN have a substantial risk of a new malignancy in the fifth and sixth decades of life in excess of what is expected among the general US population. Being free of SNs before age 40 years does not preclude survivors from having an increased risk of future SNs. This latency period supports potential genetic susceptibility or underlying biologic mechanisms, in addition to treatment exposures, for the development of SNs.
Studies from the Nordic countries11 and the British Childhood Cancer Survivor Study12 have also shown late-occurring SNs. Across cohorts, all demonstrated similar risk of any SMN between 40 and 60 years of age. For the CCSS at age 40 or older, the SIR was 2.2 (95% CI, 1.9 to 2.5). From the Nordic data for age 40 to 49 years, the SIR was 2.3 (95% CI, not available), and for age 50 to 59 years, the SIR was 1.7 (95% CI, not available). British data showed, for age 40 to 49 years, an SIR of 2.5 (95% CI, 2.1 to 3.0), and for 50 age years or older, an SIR of 1.7 (95% CI, 1.4 to 2.1). However, some differences were observed across cohorts. Our study is limited to individuals treated in the current era of multiagent chemotherapy, whereas both the British and Nordic cohorts include survivors treated between 1940 and 1970. This difference accounts for more survivors age 40 years or older within both cohorts, but a large proportion of those individuals were treated before the current treatment era. Moreover, the Nordic study did not have data regarding cancer treatment exposures. Because the CCSS is a younger cohort, childhood tumors typically occurring at older ages, such as HL, are over-represented, and malignancies of younger childhood, such as neuroblastoma and Wilms tumor, are relatively under-represented. This likely alters the pattern of SMNs observed. Specifically, SIRs for breast cancer were not significantly increased in older age groups in the Nordic or British studies but are increased in our study, and GI and genitourinary cancers were increased in the British study but not in ours.
As anticipated, our analysis of therapeutic exposures demonstrated that therapeutic radiation exposure continues to place survivors at increased risk for SMNs compared with their nonirradiated counterparts well into their fifth and sixth decades of life, indicating a need for ongoing monitoring of this at-risk subgroup. Of interest and some encouragement, male survivors who attained an age of 40 years or older, who were not exposed to therapeutic radiation, did not have an increased risk for SMN after the age 40, regardless of their SN history before this age. Of the chemotherapeutic exposures, only treatment with platinum agents was significantly associated with development of an SMN after 40 years of age.
In our cohort, survivors of HL accounted for 30% of survivors age 40 years or older, and they had a disproportionately high percentage (57%) of new SMNs after age 40 years compared with other primary diagnoses; this reflected the high incidence of breast cancer in this group. Breast cancer risk among survivors of HL was previously reported from the CCSS cohort and others.13,23,24 In addition, survivors of HL comprised more than 50% of survivors who experienced an SMN after age 40 without a history of SN before this age; this finding confirmed that risk persists with increasing age regardless of SN history. High-dose chest-directed radiation therapy was previously a central component of HL therapy and is the primary driver for the high incidence of SNs and risk for SMNs. Of note, when patients with HL were compared with patients with non-HL in separate multivariable models, the radiation effect was significant only in the survivors of HL.
We identified a significant interactive association between radiation exposure and history of SN with risk of NMSC. The highest risk occurred among subjects with a previous SN and no radiation exposure, though risks for the group with radiation exposure and previous SN remained significantly increased. This finding was unexpected in light of previous CCSS analyses that showed a strong association between therapeutic radiation and NMSCs,25 as well as the frequent occurrence of multiple NMSCs within individuals.10 This effect is further illustrated by the significant increase in the cumulative incidence of NMSCs among individuals with a history of SN before age 40 years compared with those without such history. It is possible that the role of previous treatment exposures was more important at younger ages or that other factors, such as underlying genetic susceptibility, are responsible for the high cumulative incidence observed in this population.
Of importance, we did not observe an excess risk for subsequent head and neck, lung, colon, or female genital tract malignancies although rates of these common malignancies increase in the general population in this age group. This contrasts with observations in previous CCSS publications showing an increased risk for these malignancies among survivors, with the reported median time to occurrence ranging from 15 to 23 years.2,26 It is possible that the period of highest risk for these malignancies among survivors occurs before age 40 years and that, as the incidence of these cancers increase with age in the general population, the risk beyond what is experienced by the general population is diminished.
A number of limitations should be considered. Although this analysis represents a large cohort of survivors of childhood cancer, given the dates of inclusion, the cohort remains relatively young. Numbers of survivors who have reached the fifth decade of life are limited. Specifically under-represented are survivors with malignancies, such as Wilms tumor or neuroblastoma, diagnosed at young ages. Similarly, the average age at diagnosis of childhood cancer in this cohort is skewed by over-represented diagnoses in later childhood of cancers such as HL, bone cancer, and sarcoma. Treatment exposures for SNs were not included in this analysis and may contribute to additional SNs. Lifestyle and behavioral data, as well as UV exposure, were not used in this analysis and would be expected to become increasingly important as the cohort ages. In addition, though family history may play a role in the development of late SNs, these data were collected only at baseline, without subsequent updates; therefore, they are not presented here.
As cancer therapies have changed over time, it is anticipated that the occurrence of subsequent late effects will change as well. Investigations of more recently treated survivors will help inform how adoption of newer therapeutic strategies for childhood cancer have changed the pattern of observed late effects, including second cancers. Specifically, we will need to investigate how removal of prophylactic radiation therapy in B-cell acute lymphoblastic leukemia, use of chemotherapy-only or response-based radiation therapy in HL, and use of conformal radiation therapy will affect risk for SNs. Few changes in chemotherapy have occurred during this time that are likely to affect the risk of late-occurring SN.27,28
The data presented here have important implications for long-term screening practices for survivors of childhood cancer and for medical practitioners providing their care. Routine cancer screening, such as with mammography, is typically started around this age in the general population. However, the risks experienced by the survivor population are unique. Survivors without an SN before age 40 may be particularly vulnerable because they have not had previous neoplasms that may have altered screening practices, and, given these data, it is evident that risk persists with age, even in those without a history of SN. The data presented here solidify the importance of future investigations into the underlying biologic mechanisms of SNs, as well as ongoing close surveillance for survivors of childhood cancer. These findings should help inform anticipatory guidance and recommended cancer screening in the fifth decade and later.
Appendix
Table A1.
Subsequent Neoplasms Occurring in Survivors of Childhood Cancer Before 40 Years of Age
| Subsequent Neoplasm Type | Frequency, No. |
|---|---|
| Subsequent malignant neoplasm | 210 |
| Breast | 85 |
| Thyroid | 41 |
| Soft tissue sarcoma | 11 |
| Osteosarcoma | 5 |
| Other bone | 3 |
| CNS malignancy | 7 |
| Lymphoma | 10 |
| Melanoma | 18 |
| Leukemia | 2 |
| Lung | 1 |
| Female genitourinary | 4 |
| Head and neck | 9 |
| Renal | 1 |
| GI | 6 |
| Other | 7 |
| Nonmelanoma skin cancer | 477 |
| Meningioma | 41 |
| Other noninvasive | 54 |
Table A2.
SIRs for SMNs After 40 Years of Age for All Survivors and Cohort Members Treated With Previous Irradiation
| Characteristics | All Survivors Age ≥ 40 Years |
Cohort Members Treated With Previous Irradiation* |
||||||||||
|---|---|---|---|---|---|---|---|---|---|---|---|---|
| No SN Before Age 40 Years |
SN Before Age 40 Years |
|||||||||||
| Observed | Expected | SIR (95% CI) | EAR | Observed | Expected | SIR, 95% CI | EAR | Observed | Expected | SIR, 95% CI | EAR | |
| All patients | 196 | 89.7 | 2.2 (1.9 to 2.5) | 1.31 | 119 | 47.9 | 2.5 (2.1 to 3.0) | 1.63 | 37 | 12.2 | 3.0 (2.2 to 4.2) | 2.39 |
| Sex | ||||||||||||
| Male | 54 | 38.1 | 1.4 (1.1 to 1.9) | 0.37 | 32 | 21.8 | 1.5 (1.0 to 2.1) | 0.42 | 12 | 3.1 | 3.9 (2.3 to 6.6) | 2.42 |
| Female | 142 | 51.6 | 2.8 (2.3 to 3.3) | 2.34 | 87 | 26 | 3.3 (2.7 to 4.1) | 3.16 | 25 | 9.1 | 2.7 (1.8 to 4.2) | 2.38 |
| Primary cancer diagnosis | ||||||||||||
| Leukemia | 23 | 14.6 | 1.6 (1.0 to 2.4) | 0.54 | 9 | 8.3 | 1.1 (0.6 to 2.1) | 0.08 | 4 | 2 | 2.0 (0.8 to 5.2) | 0.95 |
| CNS malignancy | 9 | 8.7 | 1.0 (0.5 to 2.1) | 0.03 | 5 | 4.6 | 1.1 (0.5 to 2.6) | 0.09 | 1 | 0.9 | 1.2 (0.2 to 8.0) | 0.14 |
| Hodgkin lymphoma | 112 | 30.7 | 3.6 (3.0 to 4.4) | 3.4 | 77 | 20 | 3.9 (3.1 to 4.8) | 3.64 | 27 | 7.2 | 3.8 (2.5 to 5.6) | 3.85 |
| Non-Hodgkin lymphoma | 13 | 8.5 | 1.5 (0.9 to 2.6) | 0.52 | 6 | 5.2 | 1.2 (0.5 to 2.5) | 0.16 | 3 | 0.8 | 3.8 (1.4 to 10.6) | 2.91 |
| Wilms tumor | 1 | 1.4 | 0.7 (0.1 to 5.1) | 0.21 | 1 | 1.1 | 1.0 (0.1 to 6.6) | 0.04 | 0 | |||
| Neuroblastoma | 0 | 0 | 0 | |||||||||
| Soft tissue sarcoma | 16 | 10.4 | 1.5 (0.9 to 2.8) | 0.62 | 13 | 4.5 | 2.9 (1.5 to 5.6) | 2.08 | 0 | |||
| Bone cancer | 22 | 14.7 | 1.5 (1.0 to 2.3) | 0.56 | 8 | 3.8 | 2.1 (1.0 to 4.4) | 1.23 | 2 | 0.7 | 3.0 (0.9 to 10.1) | 2.3 |
| Type of SMN | ||||||||||||
| Breast | 103 | 18.7 | 5.5 (4.5 to 6.7) | 1.04 | 68 | 9.5 | 7.2 (5.7 to 9.0) | 1.34 | 17 | 3.3 | 5.1 (3.1 to 8.4) | 1.32 |
| Thyroid | 12 | 6.3 | 1.9 (1.0 to 3.5) | 0.07 | 7 | 3.2 | 2.2 (0.9 to 5.0) | 0.09 | 5 | 1 | 5.2 (2.2 to 12.3) | 0.39 |
| Soft tissue sarcoma | 13 | 5.1 | 2.6 (1.5 to 4.4) | 0.1 | 6 | 2.8 | 2.1 (1.0 to 4.7) | 0.07 | 3 | 0.5 | 5.7 (1.8 to 17.4) | 0.24 |
| Osteosarcoma | 1 | 0.2 | 5.2 (0.7 to 36.7) | 0.01 | 0 | 1 | 0 | 42.1 (6.0 to 297.6) | 0.09 | |||
| CNS malignancy | 4 | 2.9 | 1.4 (0.5 to 3.7) | 0.01 | 3 | 1.6 | 1.9 (0.6 to 6.0) | 0.03 | 1 | 0.3 | 2.9 (0.4 to 20.5) | 0.06 |
| Lymphoma | 8 | 9.3 | 0.9 (0.4 to 1.9) | 0.02 | 4 | 5 | 0.8 (0.2 to 2.6) | 0.02 | 3 | 1.1 | 2.8 (0.9 to 8.5) | 0.18 |
| Melanoma | 9 | 8.9 | 1.0 (0.5 to 1.9) | 0 | 4 | 4.7 | 0.8 (0.3 to 2.3) | 0.02 | 0 | |||
| Leukemia | 3 | 2.6 | 1.2 (0.4 to 3.6) | 0.01 | 1 | 1.4 | 0.7 (0.1 to 5.1) | 0.01 | 0 | |||
| Lung | 5 | 3.7 | 1.3 (0.6 to 3.2) | 0.02 | 5 | 2.1 | 2.4 (1.0 to 5.9) | 0.07 | 0 | |||
| Female genitourinary | 6 | 7.9 | 0.8 (0.3 to 1.7) | 0.05 | 3 | 4 | 0.8 (0.3 to 2.3) | 0.05 | 0 | |||
| Head and neck | 5 | 2.7 | 1.8 (0.8 to 4.4) | 0.03 | 1 | 1.5 | 0.7 (0.1 to 4.7) | 0.01 | 2 | 0.3 | 6.7 (1.7 to 26.7) | 0.16 |
| Renal | 9 | 2.3 | 3.9 (2.0 to 7.5) | 0.08 | 5 | 1.3 | 3.9 (1.6 to 9.4) | 0.09 | 1 | 0.3 | 3.7 (0.5 to 26.1) | 0.07 |
| GI | 10 | 13.1 | 0.8 (0.4 to 1.4) | 0.04 | 6 | 7.2 | 0.8 (0.4 to 1.9) | 0.03 | 2 | 1.8 | 1.1 (0.3 to 4.4) | 0.02 |
| Other | 8 | 6 | 1.3 (0.6 to 2.9) | 0.02 | 6 | 3.5 | 1.7 (0.7 to 4.3) | 0.06 | 2 | 0.2 | 11.3 (2.9 to 44.0) | 0.18 |
| Treatment exposure | ||||||||||||
| Radiation therapy | 156 | 60.1 | 2.6 (2.2 to 3.1) | 1.78 | 119 | 47.9 | 2.5 (2.1 to 3.0) | 1.63 | 37 | 12.2 | 3.0 (2.2 to 4.2) | 2.39 |
| Alkylating agents | 95 | 40.5 | 2.4 (1.9 to 2.9) | 1.46 | 59 | 23.9 | 2.5 (1.9 to 3.2) | 1.57 | 19 | 6.1 | 3.1 (2.0 to 4.9) | 2.39 |
| Anthracyclines | 45 | 23.9 | 1.9 (1.4 to 2.6) | 0.92 | 27 | 10.9 | 2.5 (1.6 to 3.8) | 1.49 | 0 | |||
| Epipodophyllotoxins | 5 | 1.5 | 3.4 (1.5 to 8.0) | 2.22 | 4 | 0.9 | 4.6 (1.8 to 11.6) | 3.25 | 1 | 0.2 | 4.1 (0.6 to 28.6) | 2.88 |
| Platinum | 6 | 2 | 3.1 (1.4 to 6.7) | 1.98 | 2 | 0.4 | 4.9 (1.3 to 17.9) | 3.58 | 0 | |||
| Radiation, no chemotherapy | 59 | 20.2 | 2.9 (2.3 to 3.8) | 2.44 | 45 | 15.7 | 2.9 (2.2 to 3.8) | 2.3 | 14 | 4.4 | 3.2 (1.8 to 5.6) | 3 |
| Chemotherapy, no radiation | 22 | 15.1 | 1.5 (1.0 to 2.2) | 0.49 | 0 | 0 | ||||||
| Radiation and chemotherapy | 97 | 39.7 | 2.4 (2.0 to 3.0) | 1.51 | 74 | 32 | 2.3 (1.8 to 2.9) | 1.37 | 23 | 7.8 | 3.0 (2.0 to 4.5) | 2.12 |
Abbreviations: EAR, excess absolute risk per 1,000 person-years; SIR, standardized incidence ratio; SMN, subsequent malignant neoplasm; SN, subsequent neoplasm.
Total number of observed events in the with- and without-previous radiation groups = 186; for 10 SMNs, the radiation status of the individual was unknown.
Table A3.
SIRs for SMNs After 40 Years of Age for Cohort Members Not Treated With Previous Irradiation
| Cohort Members Not Treated With Previous Irradiation* |
||||||||
|---|---|---|---|---|---|---|---|---|
| No SN Before 40 Years of Age |
SN Before 40 Years of Age |
|||||||
| Characteristics | Observed | Expected | SIR (95% CI) | EAR | Observed | Expected | SIR (95% CI) | EAR |
| All patients | 28 | 21.4 | 1.3 (0.9 to 1.9) | 0.34 | 2 | 1.5 | 1.3 (0.3 to 5.0) | 0.35 |
| Sex | ||||||||
| Male | 9 | 9.4 | 1.0 (0.5 to 1.8) | −0.04 | 0 | |||
| Female | 19 | 12 | 1.6 (1.0 to 2.6) | 0.77 | 2 | 1.1 | 1.7 (0.5 to 6.6) | 1.03 |
| Primary cancer diagnosis | ||||||||
| Leukemia | 8 | 2.8 | 2.9 (1.4 to 6.0) | 1.75 | 1 | 0.3 | 3.2 (0.6 to 18.2) | 2.58 |
| CNS malignancy | 3 | 2.4 | 1.3 (0.3 to 5.1) | 0.25 | 0 | |||
| Hodgkin lymphoma | 0 | 0 | ||||||
| Non-Hodgkin lymphoma | 3 | 1.6 | 1.8 (0.6 to 5.5) | 0.86 | 0 | |||
| Wilms tumor | 0 | 0 | ||||||
| Neuroblastoma | 0 | 0 | ||||||
| Soft tissue sarcoma | 3 | 4.3 | 0.7 (0.2 to 2.1) | −0.38 | 0 | |||
| Bone cancer | 11 | 8.7 | 1.3 (0.7 to 2.3) | 0.31 | 1 | 0.6 | 1.8 (0.3 to 12.0) | 0.93 |
| Type of SMN | ||||||||
| Breast | 13 | 4.3 | 3.0 (1.6 to 5.5) | 0.45 | 0 | |||
| Thyroid | 0 | 0 | ||||||
| Soft tissue sarcoma | 3 | 1.2 | 2.5 (0.8 to 7.6) | 0.09 | 0 | |||
| Osteosarcoma | 0 | 0 | ||||||
| CNS malignancy | 0 | 0 | ||||||
| Lymphoma | 1 | 2.2 | 0.5 (0.1 to 3.2) | −0.06 | 0 | |||
| Melanoma | 5 | 2.1 | 2.3 (1.0 to 5.6) | 0.15 | 0 | |||
| Leukemia | 1 | 0.6 | 1.6 (0.2 to 11.6) | 0.02 | 0 | |||
| Lung | 0 | 0 | ||||||
| Female genitourinary | 2 | 1.8 | 1.1 (0.3 to 4.4) | 0.02 | 1 | 0.2 | 5.7 (0.9 to 38.3) | 1 |
| Head and neck | 1 | 0.7 | 1.5 (0.2 to 10.7) | 0.02 | 1 | 0 | 27.0 (3.8 to 191.4) | 0.74 |
| Renal | 2 | 0.6 | 3.6 (0.9 to 14.2) | 0.07 | 0 | |||
| GI | 0 | 0 | ||||||
| Other | 0 | 0 | ||||||
| Treatment exposure | ||||||||
| Alkylating agents | 16 | 9.6 | 1.7 (1.0 to 2.8) | 0.72 | 1 | 0.7 | 1.4 (0.2 to 9.5) | 0.44 |
| Anthracyclines | 17 | 9.6 | 1.8 (1.1 to 2.9) | 0.83 | 1 | 0.7 | 1.5 (0.2 to 10.0) | 0.53 |
| Epipodophyllotoxins | 0 | 0 | ||||||
| Platinum | 3 | 1.5 | 2.1 (0.7 to 6.3) | 1.03 | 1 | 0 | 21.8 (9.6 to 49.4) | 22.37 |
| Chemo | 20 | 14.1 | 1.4 (0.9 to 2.2) | 0.45 | 2 | 1 | 1.9 (0.5 to 7.2) | 1.06 |
| No chemotherapy | 8 | 7.3 | 1.1 (0.5 to 2.3) | 0.11 | 0 | |||
Abbreviations: EAR, excess absolute risk per 1,000 person-years; SIR, standardized incidence ratio; SMN, subsequent malignant neoplasm; SN, subsequent neoplasm.
Total number of observed events in the with- and without-previous radiation groups is 186; for 10 SMNs, the radiation status of the individual was unknown.
Table A4.
Multivariable Poisson Regression Model for Subsequent Malignant Neoplasm

| Risk Factor | Relative Risk | 95% CI | P |
|---|---|---|---|
| Sex | |||
| Female | 1.9 | 1.3 to 2.6 | < .001 |
| Male | 1.0 | Reference | |
| Platinum | |||
| Yes | 2.3 | 1.0 to 5.2 | .05 |
| No | 1.0 | Reference | |
| Radiation therapy | |||
| Yes | 2.2 | 1.4 to 3.3 | < .001 |
| No | 1.0 | Reference |
Table A5.
Multivariable Poisson Regression Model for Nonmelanoma Skin Cancers
| Risk Factor | Relative Risk | 95% CI | P |
|---|---|---|---|
| Sex | |||
| Male | 1.2 | 1.0 to 1.4 | .02 |
| Female | 1.0 | Reference | |
| Anthracycline exposure | |||
| Yes | 0.8 | 0.7 to 1.0 | .02 |
| No | 1.0 | Reference | |
| RT-and-SN interaction | |||
| RT and SN at < 40 years of age | 1.3 | 1.0 to 1.6 | .03 |
| RT and no SN at < 40 years of age | 1.2 | 0.9 to 1.5 | .14 |
| No RT and SN at < 40 years of age | 2.4 | 1.8 to 3.4 | < .001 |
| No RT and no SN at < 40 years of age | 1.0 | Reference |
Abbreviations: SN, subsequent neoplasm; RT, radiation therapy.
Footnotes
See accompanying editorial on page 3531
Supported in part by the National Cancer Institute Grant No. CA55727; Cancer Center Support Grant No. CA21765; American Lebanese-Syrian Associated Charities; National Institutes of Health Grant No. T32CA099936; and the Children's Cancer Research Fund.
Presented in part at the 50th Annual Meeting of the American Society of Clinical Oncology, Chicago, IL May 30-June 3, 2014.
Authors' disclosures of potential conflicts of interest are found in the article online at www.jco.org. Author contributions are found at the end of this article.
AUTHORS' DISCLOSURES OF POTENTIAL CONFLICTS OF INTEREST
Disclosures provided by the authors are available with this article at www.jco.org.
AUTHOR CONTRIBUTIONS
Conception and design: All authors
Financial support: Leslie L. Robison, Joseph P. Neglia
Administrative support: Leslie L. Robison, Joseph P. Neglia
Provision of study materials or patients: Leslie L. Robison, Joseph P. Neglia
Collection and assembly of data: Lucie M. Turcotte, John A. Whitton, Sue Hammond, Gregory T. Armstrong, Leslie L. Robison, Joseph P. Neglia
Data analysis and interpretation: All authors
Manuscript writing: All authors
Final approval of manuscript: All authors
AUTHORS' DISCLOSURES OF POTENTIAL CONFLICTS OF INTEREST
Risk of Subsequent Neoplasms During the Fifth and Sixth Decades of Life in the Childhood Cancer Survivor Study Cohort
The following represents disclosure information provided by authors of this manuscript. All relationships are considered compensated. Relationships are self-held unless noted. I = Immediate Family Member, Inst = My Institution. Relationships may not relate to the subject matter of this manuscript. For more information about ASCO's conflict of interest policy, please refer to www.asco.org/rwc or jco.ascopubs.org/site/ifc.
Lucie M. Turcotte
No relationship to disclose
John A. Whitton
Honoraria: Novartis
Travel, Accommodations, Expenses: Novartis
Debra L. Friedman
No relationship to disclose
Sue Hammond
No relationship to disclose
Gregory T. Armstrong
No relationship to disclose
Wendy Leisenring
Research Funding: Merck
Leslie L. Robison
No relationship to disclose
Joseph P. Neglia
No relationship to disclose
REFERENCES
- 1.Howlader N, Noone AM, Krapcho M, et al. SEER Cancer Statistics Review, 1975-2011. Bethesda, MD: National Cancer Institute; 2014. [Google Scholar]
- 2.Friedman DL, Whitton J, Leisenring W, et al. Subsequent neoplasms in 5-year survivors of childhood cancer: The Childhood Cancer Survivor Study. J Natl Cancer Inst. 2010;102:1083–1095. doi: 10.1093/jnci/djq238. [DOI] [PMC free article] [PubMed] [Google Scholar]
- 3.Garwicz S, Anderson H, Olsen JH, et al. Second malignant neoplasms after cancer in childhood and adolescence: A population-based case-control study in the 5 Nordic countries. Int J Cancer. 2000;88:672–678. doi: 10.1002/1097-0215(20001115)88:4<672::aid-ijc24>3.0.co;2-n. [DOI] [PubMed] [Google Scholar]
- 4.Hawkins M, Draper GJ, Kingston JE. Incidence of second primary tumours among childhood cancer survivors. Br J Cancer. 1987;56:339–347. doi: 10.1038/bjc.1987.200. [DOI] [PMC free article] [PubMed] [Google Scholar]
- 5.Inskip PD, Curtis RE. New malignancies following childhood cancer in the United States, 1973-2002. Int J Cancer. 2007;121:2233–2240. doi: 10.1002/ijc.22827. [DOI] [PubMed] [Google Scholar]
- 6.Jenkinson HC, Hawkins MM, Stiller CA, et al. Long-term population-based risks of second malignant neoplasms after childhood cancer in Britain. Br J Cancer. 2004;91:1905–1910. doi: 10.1038/sj.bjc.6602226. [DOI] [PMC free article] [PubMed] [Google Scholar]
- 7.Mike V, Meadows AT, D'Angio GJ. Incidence of second malignant neoplasms in children: Results of an international study. Lancet. 1982;2:1326–1331. doi: 10.1016/s0140-6736(82)91524-0. [DOI] [PubMed] [Google Scholar]
- 8.Neglia JP, Friedman DL, Yasui Y, et al. Second malignant neoplasms in five-year survivors of childhood cancer: Childhood Cancer Survivor Study. J Natl Cancer Inst. 2001;93:618–629. doi: 10.1093/jnci/93.8.618. [DOI] [PubMed] [Google Scholar]
- 9.Hijiya N, Hudson MM, Lensing S, et al. Cumulative incidence of secondary neoplasms as a first event after childhood acute lymphoblastic leukemia. JAMA. 2007;297:1207–1215. doi: 10.1001/jama.297.11.1207. [DOI] [PubMed] [Google Scholar]
- 10.Armstrong GT, Liu W, Leisenring W, et al. Occurrence of multiple subsequent neoplasms in long-term survivors of childhood cancer: A report from the Childhood Cancer Survivor Study. J Clin Oncol. 2011;29:3056–3064. doi: 10.1200/JCO.2011.34.6585. [DOI] [PMC free article] [PubMed] [Google Scholar]
- 11.Olsen JH, Moller T, Anderson H, et al. Lifelong cancer incidence in 47,697 patients treated for childhood cancer in the Nordic countries. J Natl Cancer Inst. 2009;101:806–813. doi: 10.1093/jnci/djp104. [DOI] [PubMed] [Google Scholar]
- 12.Reulen RC, Frobisher C, Winter DL, et al. Long-term risks of subsequent primary neoplasms among survivors of childhood cancer. JAMA. 2011;305:2311–2319. doi: 10.1001/jama.2011.747. [DOI] [PubMed] [Google Scholar]
- 13.Bhatia S, Yasui Y, Robison LL, et al. High risk of subsequent neoplasms continues with extended follow-up of childhood Hodgkin's disease: Report from the Late Effects Study Group. J Clin Oncol. 2003;21:4386–4394. doi: 10.1200/JCO.2003.11.059. [DOI] [PubMed] [Google Scholar]
- 14.Hawkins MM, Wilson LM, Stovall MA, et al. Epipodophyllotoxins, alkylating agents, and radiation and risk of secondary leukaemia after childhood cancer. BMJ. 1992;304:951–958. doi: 10.1136/bmj.304.6832.951. [DOI] [PMC free article] [PubMed] [Google Scholar]
- 15.Maule M, Scelo G, Pastore G, et al. Risk of second malignant neoplasms after childhood leukemia and lymphoma: An international study. J Natl Cancer Inst. 2007;99:790–800. doi: 10.1093/jnci/djk180. [DOI] [PubMed] [Google Scholar]
- 16.Pappo AS, Armstrong GT, Liu W, et al. Melanoma as a subsequent neoplasm in adult survivors of childhood cancer: A report from the childhood cancer survivor study. Pediatr Blood Cancer. 2013;60:461–466. doi: 10.1002/pbc.24266. [DOI] [PMC free article] [PubMed] [Google Scholar]
- 17.Leisenring WM, Mertens AC, Armstrong GT, et al. Pediatric cancer survivorship research: Experience of the Childhood Cancer Survivor Study. J Clin Oncol. 2009;27:2319–2327. doi: 10.1200/JCO.2008.21.1813. [DOI] [PMC free article] [PubMed] [Google Scholar]
- 18.Robison LL, Mertens AC, Boice JD, et al. Study design and cohort characteristics of the Childhood Cancer Survivor Study: A multi-institutional collaborative project. Med Pediatr Oncol. 2002;38:229–239. doi: 10.1002/mpo.1316. [DOI] [PubMed] [Google Scholar]
- 19.Robison LL, Armstrong GT, Boice JD, et al. The Childhood Cancer Survivor Study: A National Cancer Institute-supported resource for outcome and intervention research. J Clin Oncol. 2009;27:2308–2318. doi: 10.1200/JCO.2009.22.3339. [DOI] [PMC free article] [PubMed] [Google Scholar]
- 20.World Health Organization. International classification of diseases for oncology. http://apps.who.int/iris/bitstream/10665/96612/1/9789241548496_eng.pdf?ua=1.
- 21.National Cancer Institute. National Cancer Institute, DCCPS, Surveillance Research Program, Cancer Statistics Branch, Surveillance, Epidemiology, and End Results (SEER) Program, 2013. http://seer.cancer.gov/data/seerstat/nov2012/
- 22.Pan W. Akaike's information criterion in generalized estimating equations. Biometrics. 2001;57:120–125. doi: 10.1111/j.0006-341x.2001.00120.x. [DOI] [PubMed] [Google Scholar]
- 23.Kenney LB, Yasui Y, Inskip PD, et al. Breast cancer after childhood cancer: A report from the Childhood Cancer Survivor Study. Ann Intern Med. 2004;141:590–597. doi: 10.7326/0003-4819-141-8-200410190-00006. [DOI] [PubMed] [Google Scholar]
- 24.Moskowitz CS, Chou JF, Wolden SL, et al. Breast cancer after chest radiation therapy for childhood cancer. J Clin Oncol. 2014;32:2217–2223. doi: 10.1200/JCO.2013.54.4601. [DOI] [PMC free article] [PubMed] [Google Scholar]
- 25.Perkins JL, Liu Y, Mitby PA, et al. Nonmelanoma skin cancer in survivors of childhood and adolescent cancer: A report from the childhood cancer survivor study. J Clin Oncol. 2005;23:3733–3741. doi: 10.1200/JCO.2005.06.237. [DOI] [PubMed] [Google Scholar]
- 26.Henderson TO, Oeffinger KC, Whitton J, et al. Secondary gastrointestinal cancer in childhood cancer survivors: A cohort study. Ann Intern Med. 2012;156:757–766. doi: 10.1059/0003-4819-156-11-201206050-00002. w-260. [DOI] [PMC free article] [PubMed] [Google Scholar]
- 27.Green DM, Kun LE, Matthay KK, et al. Relevance of historical therapeutic approaches to the contemporary treatment of pediatric solid tumors. Pediatr Blood Cancer. 2013;60:1083–1094. doi: 10.1002/pbc.24487. [DOI] [PMC free article] [PubMed] [Google Scholar]
- 28.Hudson MM, Neglia JP, Woods WG, et al. Lessons from the past: Opportunities to improve childhood cancer survivor care through outcomes investigations of historical therapeutic approaches for pediatric hematological malignancies. Pediatr Blood Cancer. 2012;58:334–343. doi: 10.1002/pbc.23385. [DOI] [PMC free article] [PubMed] [Google Scholar]


