

Abstract
Background:
The tibial tubercle–trochlear groove (TT-TG) is used as the gold standard for patellofemoral malalignment.
Purpose:
To assess 3 patellar tendon–trochlear groove (PT-TG) angle measurement techniques and the PT-TG distance measurement (tendinous cartilaginous TT-TG) as predictors of patellar instability.
Study Design:
Cohort study (diagnosis); Level of evidence, 3.
Methods:
Three PT-TG angle measurements and the PT-TG distance were measured in 82 participants with patellar instability and 100 controls using magnetic resonance imaging (MRI). Measurement landmarks were the line tangent to the posterior femoral condyles, the deepest point of the trochlea, the transepicondylar line, and the patellar tendon center. All measurements were recorded once by 1 examiner, and the measurements were recorded twice by 2 examiners in a random group of 100 knees. Mean values and standard deviations (SDs) were obtained. Normality cutoff values were defined as 2 and 3 SDs above the mean in the control group. The sensitivity, specificity, and positive likelihood ratio (LR+) were calculated. Inter- and intrarater reliability were assessed based on the intraclass correlation coefficient (ICC).
Results:
The measurements from the patellar instability and control groups, respectively, for angle 1 (16.4° and 8.4°), angle 2 (31° and 15.6°), angle 3 (30.8° and 15.7°), PT-TG distance (14.5 and 8.4 mm), and patellar tilt (21.1° and 7.5°) were significantly different (P < .05). The angle measurements showed greater sensitivity, specificity, and LR+ than the PT-TG distance. Inter- and intrarater ICC values were >0.95 for all measurements.
Conclusion:
The PT-TG angle and the PT-TG distance are reliable and are different between the patellar instability and control groups. PT-TG angles are more closely associated with patellar instability than PT-TG distance.
Clinical Relevance:
PT-TG angle measurements show high reliability and association with patellar instability and can aid in the assessment of extensor mechanism malalignment. A more sensitive and specific evaluation of extensor mechanism malalignment can improve patient care by preventing both redislocation and abnormal tracking of overlooked malalignment and complications of unnecessary tibial tuberosity medialization.
Keywords: patellar dislocation, patellar instability, risk factor, tibial tubercle–trochlear groove, TT-TG, patellofemoral, MRI
Patellar instability is a debilitating condition that primarily affects young athletes and has an incidence of 5.8 per 100,000 people.14,16 The main predisposing factors for patellar instability are trochlear dysplasia, lateral patellar inclination, patella alta, and increased lateral quadriceps vector.1,8 The gold standard for assessing the increased lateral quadriceps vector is the tibial tubercle–trochlear groove (TT-TG) distance measured on computed tomography (CT) images. However, the TT-TG distance does not represent the functional quadriceps vector well because it underestimates the malalignment due to a more lateral insertion of the patellar tendon relative to the most anterior point of the tibial tuberosity (TT).17,24,32 Therefore, the measurement of the cartilaginous tendon TT-TG or the patellar tendon–trochlear groove (PT-TG) distance has become relevant.25,32,33
Both the TT-TG and PT-TG distance measurements present limitations. The lateral quadriceps vector increases due to internal rotation of the distal femur, knee rotation (tibia external rotation relative to the femur) and lateral translation, and external rotation of the patellar tendon insertion and the TT, increasing the patellar inclination.4,9,11,22,26,31,34 These deviations may occur in varying degrees of severity.5,7,31 The PT-TG distance only assesses the translational component of these deviations in the coronal plane and thus does not fully represent the deformity. For this reason, Diederichs et al11 showed a weak correlation between TT-TG and knee rotation.
Arendt and Dejour1 highlighted the importance of carefully assessing either TT-TG or PT-TG because of the underlying unrecognized rotational deviations. Angular deformities are typically assessed by femoral neck anteversion and external tibial torsion.4,11,24,27 However, these measurements assess the rotational deformity of the limb rather than the extensor mechanism. Kobayashi et al18 developed a tridimensional technique to assess the extensor mechanism alignment; however, this technique is too complex to implement. Simpler methods have been described but have not been thoroughly investigated.23,24,30
Therefore, it is important to develop a simple method to measure the angular deviations of the extensor mechanism. For this purpose, we conducted a case-control study to assess 3 angular measurement techniques (PT-TG angle) and a distance measurement (PT-TG distance) as predictors of patellar instability, considering the hypothesis that the angle measurements would be more predictive of patellar instability than linear measurements.
Methods
Our study was approved by our institutional review board, and informed consent was waived because the study was a retrospective cross-sectional review. All magnetic resonance images (MRIs) from the period between 2008 and 2013, from patients suffering from recurrent patellar instability who attended our hospital, were used in this study. The diagnosis of patellar instability was verified through the examination of medical records. The diagnostic criteria were as follows: clinical history (patellar luxation reduced in an emergency service and a compelling story of patellar luxation), related physical examination (swollen joints or medial knee pain in the region of the medial patellofemoral ligament, patella, or retinaculum), or radiological findings (contusion of the lateral femoral condyle or medial portion of the patella, osteochondral fragment, lesion of the medial patellofemoral ligament or retinaculum). A total of 100 consecutive patients (50 male and 50 female) younger than 45 years with knee MRIs were selected for the control group. Patients with multiligament injuries, osteoarthritis, bone fractures, patella magna or bipartite patella, previous knee surgeries, deformities, patellar incongruence (assessed by patellar tilt >20° or patellar subluxation), and patellofemoral cartilage lesions grades 3 and 4 (International Cartilage Repair Society [ICRS] score) were excluded.29 Bone bruises were not considered an exclusion criterion once they did not hinder measurements. The diagnoses among the patients in the control group included tendonitis, osteochondritis dissecans, stress fractures, meniscal tears, and anterior cruciate ligament (ACL) injury; the last 2 conditions were observed most frequently. We chose a control group that was 50% male and 50% female, despite the proportion in the patellar instability group, to obtain an average parameter representing the broader population. Patients from both groups with low-quality MRIs and/or anatomic abnormalities that hindered anatomic characterization adequate to perform the measurements were also excluded.
Therefore, 82 patients (64 women, 18 men) with patellar instability were selected for the patellar instability group, and 100 patients (50 women, 50 men) were selected for the control group. The mean ages of the instability and control groups were 24.7 ± 1 years (range, 10-53 years) and 28.5 ± 0.8 years (range, 13-45 years), respectively. The instability group had 9 skeletally immature patients, and the control group had 4. There were 93 left knees and 89 right knees assessed.
MRIs were obtained on a Signa HDxt 1.5-T system device (GE Medical Systems) equipped with a dedicated knee coil (HDTR Knee). The patients lay in a supine position with the knee at the maximum extension allowed by the dedicated knee coil. Sagittal T2 fat-saturated (FRFSE-XL), coronal T2 fat-saturated (FRFSE-XL), and axial T2 fat-saturated (FRFSE-XL) sequences were analyzed (sagittal T2-weighted fat-saturated images: repetition time [TR], 3400 ms; echo time [TE], 45 ms; frequency × phase, 320 × 256; number of excitations [NEX], 2; field of view [FOV], 17.0 cm; slice, 3.5 mm; space, 0.5 mm; ecotrain, 12; bandwidth, 31.25 kHz) (coronal T2-weighted fat-saturated images: TR, 3667 ms; TE, 45 ms; frequency × phase, 288 × 224; NEX, 2; FOV, 17.0 cm; slice, 3.0 mm; space, 0.6 mm; ecotrain, 12; bandwidth, 31.25 kHz) (axial T2-weighted fat-saturated: TR, 4917 ms; TE, 45 ms; frequency × phase, 288 × 224; NEX, 2; FOV, 16 cm; slice, 3.0 mm; space, 0.3 mm; ecotrain, 12; bandwidth, 31.25 kHz). We used software (Advanced Open-Source PACS Workstation DICOM Viewer) allowing the lines traced in one cut to be transferred to another cut in the examination.
Three PT-TG angle measurements, PT-TG distance, and patellar tilt were assessed as described below.
PT-TG Angle 1 (PT-TG Posterior Condylar Trochlear Referenced Angle)
On the axial cut, where one could identify the deepest point of the trochlear groove (trochlear axial cut), a line was drawn tangent to the posterior portion of the lateral and medial condyles of the femur (condylar line). A line perpendicular to that tangent was drawn through the deepest point of the trochlear cartilage (condylar trochlear line). The condylar line and the condylar trochlear line were transferred to the most proximal axial cut where the patellar tendon was fully inserted into the TT (patellar tendon axial cut), and its center was marked (patellar tendon center). The angle was formed by the condylar trochlear line and the line connecting the intersection of the condylar trochlear and condylar lines and the patellar tendon center (Figure 1).
Figure 1.
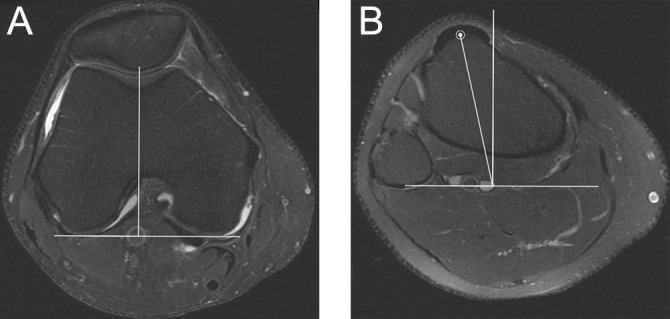
Patellar tendon–trochlear groove (PT-TG) posterior condylar trochlear referenced angle in T2 fat suppression. (A) Trochlear axial cut: condylar line and condylar trochlear line. (B) Patellar tendon axial cut: condylar line, condylar trochlear line, patellar tendon center, and PT-TG angle 1.
PT-TG Angle 2 (PT-TG Central Condylar Trochlear Referenced Angle)
A condylar line, a condylar trochlear line, and a line connecting the medial and lateral epicondyles (transepicondylar line), considered the knee rotational axis during flexion and extension, were drawn and then transferred to the patellar tendon axial cut.13,34 The intersection between the condylar trochlear line and the transepicondylar line was considered the center of the knee. The angle was formed by the condylar trochlear line and the line between the center of the knee and the patellar tendon center (Figure 2).
Figure 2.
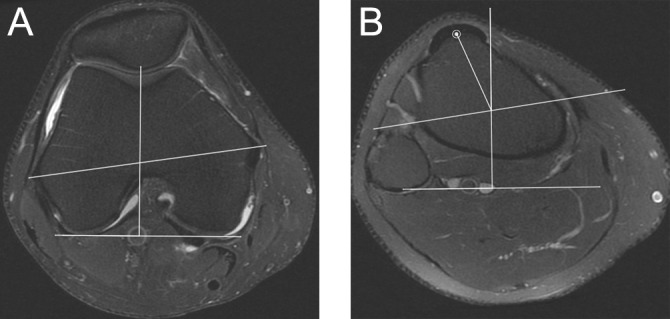
Patellar tendon–trochlear groove (PT-TG) central condylar trochlear referenced angle in T2 fat suppression. (A) Trochlear axial cut: condylar line, condylar trochlear line, and transepicondylar line. (B) Patellar tendon axial cut: condylar line, condylar trochlear line, transepicondylar line, patellar tendon center, and PT-TG angle 2.
PT-TG Angle 3 (PT-TG Central Transepicondylar Trochlear Referenced Angle)
On the trochlear axial cut, a line perpendicular to the transepicondylar line and another line perpendicular crossing the deepest point of the trochlear cartilage (transepicondylar trochlear line) were drawn and then transferred to the patellar tendon axial cut. The angle was formed by the transepicondylar trochlear line and the line between the intersection of the transepicondylar line with the transepicondylar trochlear line and the patellar tendon center (Figure 3).30
Figure 3.
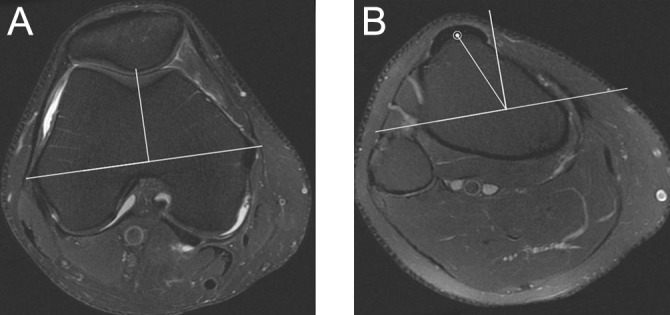
Patellar tendon–trochlear groove (PT-TG) central transepicondylar trochlear referenced angle in T2 fat suppression. (A) Trochlear axial cut: transepicondylar line and transepicondylar trochlear line. (B) Patellar tendon axial cut: transepicondylar line, transepicondylar trochlear line, patellar tendon center, and PT-TG angle 3.
PT-TG Distance
The condylar line and the condylar trochlear line were transferred to the patellar tendon axial cut. A line perpendicular to the condylar line was drawn at the intersection of the patellar tendon center (patellar tendon line). The shortest distance between the condylar trochlear and patellar tendon lines was the PT-TG distance (Figure 4).28
Figure 4.
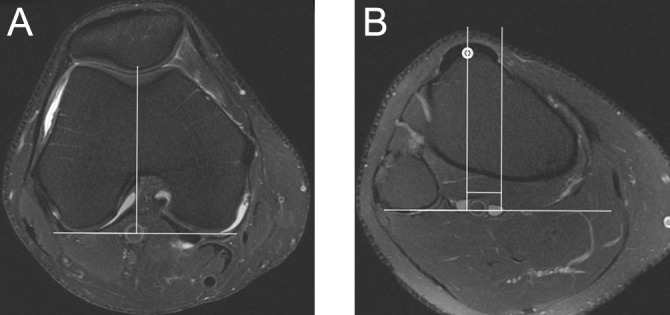
Patellar tendon–trochlear groove (PT-TG) distance in T2 fat suppression. (A) Trochlear axial cut: condylar line and condylar trochlear line. (B) Patellar tendon axial cut: condylar line, condylar trochlear line, patellar tendon center, patellar tendon line, and PT-TG distance.
Patellar Tilt
The condylar line was transferred to the axial cut with the longest patellar axis. The patellar tilt was the angle formed between the condylar line and a line transecting the longest patellar axis (Figure 5).22
Figure 5.
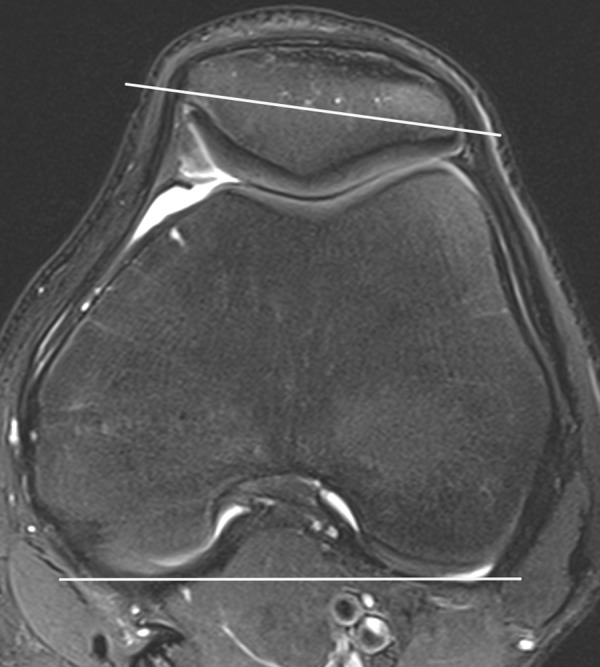
Patellar tilt in T2 fat suppression. Axial cut: condylar line and patellar axis line. Patellar tilt is the angle between these 2 lines.
Image Analysis
Image analyses were performed without identification of the patients or their diagnoses. All knee measurements were performed by the same examiner (B.B.H.), an orthopaedic knee surgeon with 5 years of experience. All 5 measurements were performed at the same time, using the same landmarks for each patient. Thus, we reduced landmark selection bias and confounding factors between measurements.
To evaluate the inter- and intrarater reliability, we selected a random sample of 100 patients (50 with patellar instability and 50 controls). The angle measurements and the PT-TG distances were performed and calculated by a second examiner (E.N.K.F.), a musculoskeletal radiologist with 5 years of experience, to assess inter-rater reliability. Both examiners repeated the measurements of the 100 patients after 2 weeks to assess intrarater reliability.
Statistical Analysis
The mean values and standard deviations (SDs) of the 5 measurements were calculated for the patellar instability and control groups and for male and female subgroups. Student t tests were used to determine significant differences between the groups and subgroups.
The upper limit for normality was defined as 2 SDs and 3 SDs from the mean of the control group, representing approximately 95% and 99% of the values, respectively. These values were used as cutoffs for categorizing patients with (above the cutoff value) and without predisposing factors.
The sensitivity, specificity, and positive likelihood ratio (LR+) of the predisposing factors were calculated for each measurement. The associations between the angles, PT-TG distance, and patellar tilt (ie, the patellar incongruence) were calculated using the Pearson correlation test. An intraclass correlation coefficient (ICC) was calculated to assess inter- and intrarater reliability. A t test between 2 subgroups of the control group (ACL injury and other injuries) was conducted to assess ACL injury as a confounding factor. Statistical significance was considered when P < .05.
Results
In all 5 measurements, statistically significant differences between the patellar instability and control groups were observed. Table 1 shows the percentage increase for the patellar instability group compared with the control group. Higher increases were found for the 3 PT-TG angles than for the PT-TG distance.
TABLE 1.
Mean Values and Differences Between Groupsa
| Measurement | Instability | Control | Instability-Controlb | % Increase |
|---|---|---|---|---|
| PT-TG angle 1, deg | 16.4 ± 8.2 (14.6-18.2) | 8.4 ± 0.4 (7.8-9.0) | 8.0 ± 0.96 (6.2-9.9) | 95 |
| PT-TG angle 2, deg | 31.0 ± 14.2 (27.9-34.1) | 15.6 ± 5.6 (14.5-16.7) | 15.4 ± 1.7 (12.1-18.7) | 99 |
| PT-TG angle 3, deg | 30.8 ± 13.3 (27.9-33.7) | 15.7 ± 5.6 (14.6-16.8) | 15.1 ± 1.6 (12.0-18.2) | 96 |
| PT-TG distance, mm | 14.5 ± 6.9 (13.0-16.0) | 8.4 ± 3.2 (7.8-9.0) | 6.1 ± 0.8 (4.5-7.7) | 73 |
| Patellar tilt, deg | 21.1 ± 13.4 (18.1-24.1) | 7.5 ± 4.9 (6.5-8.5) | 13.6c | 181 |
aValues are reported as mean ± SD (95% CI) unless otherwise indicated. PT-TG, patellar tendon–trochlear groove.
bP < .001.
cNonnormal distribution, CI not calculable.
In the control group, the mean differences in PT-TG angles 1, 2, and 3; PT-TG distance; and patellar tilt between male and female patients were 1.5°, 2.8°, 2.8°, 0.5 mm, and 0.2°, respectively. All values were greater in females; however, only the PT-TG angles were significantly different (P < .05).
In the instability group, the values were greater in the male subgroup. The mean differences in PT-TG angles 1, 2, and 3; PT-TG distance; and patellar tilt between male and female patients were 1.5°, 1.6°, 0.9°, 4 mm, and 2.5°, respectively. Only the PT-TG distance was significantly different (P < .05).
Table 2 shows the cutoff values calculated for 2 SDs and 3 SDs, sensitivity, specificity, the patients’ distributions, and the LR+ between groups. Sensitivity, specificity, and LR+ were greater for PT-TG angles 2 and 3. These 2 angles were also the most discriminative. The PT-TG angles 1, 2, and 3 and the PT-TG distance were all similarly associated with patellar tilt, showing correlation values of 0.79, 0.76, 0.75, and 0.73, respectively (P < .001).
TABLE 2.
Patient Prevalence Rates and Their Respective Cutoff Valuesa
| Measurement | Cut | Patellar Instability, n (%) (n = 82) | Control, n (%) (n = 100) | LR (95% CI) | Sensitivityb | Specificityb |
|---|---|---|---|---|---|---|
| PT-TG angle 1, deg | ≥14 | 48 (58.5) | 5 (5) | 11.7 (4.9-28) | 0.58 | 0.95 |
| 2 SDs | <14 | 34 | 95 | |||
| PT-TG angle 1, deg | ≥17 | 29 (35.4) | 0 (0) | NC | 0.35 | 1 |
| 3 SDs | <17 | 53 | 100 | |||
| PT-TG angle 2, deg | ≥27 | 47 (57.3) | 2 (2) | 28.7 (7.1-114.4) | 0.57 | 0.98 |
| 2 SDs | <27 | 35 | 98 | |||
| PT-TG angle 2, deg | ≥32 | 30 (36.6) | 1 (1) | 36.6 (5-262.5) | 0.36 | 0.99 |
| 3 SDs | <32 | 52 | 99 | |||
| PT-TG angle 3, deg | ≥27 | 45 (54.9) | 2 (2) | 27.4 (6.9-109.7) | 0.55 | 0.98 |
| 2 SDs | <27 | 37 | 98 | |||
| PT-TG angle 3, deg | ≥33 | 29 (35.4) | 1 (1) | 35.4 (4.9-254.1) | 0.35 | 0.99 |
| 3 SDs | <33 | 53 | 99 | |||
| PT-TG distance, mm | ≥14 | 35 (42.7) | 6 (6) | 7.1 (3.1-16.0) | 0.43 | 0.94 |
| 2 SDs | <14 | 47 | 94 | |||
| PT-TG distance, mm | ≥17 | 20 (24.4) | 1 (1) | 24.4 (3.3-177.9) | 0.24 | 0.99 |
| 3 SDs | <17 | 62 | 99 |
aLR, likelihood ratio; NC, not calculable; PT-TG, patellar tendon–trochlear groove.
b95% CI.
Both inter- and intrarater reliabilities were strong (ICC >0.98) (Table 3). These values were equivalent in the patellar instability and control subgroups.
TABLE 3.
Intraclass Correlation Coefficients (n = 100)a
| PT-TG Angle 1 | PT-TG Angle 2 | PT-TG Angle 3 | PT-TG Distance | |
|---|---|---|---|---|
| Intrarater 1 | 0.989 | 0.992 | 0.991 | 0.988 |
| Intrarater 2 | 0.991 | 0.991 | 0.992 | 0.988 |
| Interrater | 0.985 | 0.986 | 0.988 | 0.981 |
aPT-TG, patellar tendon–trochlear groove.
A common reason for MRI referral in the control group was ACL injury, which was not considered a confounding factor, as the subgroup analysis showed no significant difference between the ACL injury and other injury groups.
Discussion
The large lateral quadriceps vector is a major predisposing factor for patellar instability, and the gold standard measurement of these values is the TT-TG distance, measured by a CT scan.8 Values greater than 15 to 20 mm currently serve as indication for TT medialization osteotomy.4,8,15,19
TT-TG and PT-TG measurements have limitations in that they only measure the translational component of the extensor mechanism deviations in the coronal plane and do not fully represent the lateral quadriceps vector.
Mild to severe patellofemoral joint rotational deviations are frequent.5,7,31 According to Yoshioka et al,34 angular variations are more common than linear variations in normal femur anatomy. Cases with severe angular deformities are straightforward to identify, as they present internal rotations of the distal femur and patella during a physical examination. Additionally, external tibial rotation and increased femoral neck anteversion may be present. Surgical correction requires several derotational osteotomies, which are difficult to perform.9,12,26
Mild deviations may be present in patients with anterior pain and/or patellar instability; the need for assessment in such cases has been highlighted by Arendt and Dejour.1 In a study assessing rotational deviations using MRI in patients with patellar instability, Diederichs et al11 identified significantly greater femoral neck anteversion and knee rotation in patients with patellar instability compared with controls but found no difference between groups in external tibial rotation. Muneta et al24 also found no difference in external tibial rotation between patients with and without anterior knee pain. In the same study, using CT, the authors described the TT rotational angle. Patients with anterior knee pain and greater patellar inclination presented increased TT rotation, suggesting that TT position may cause patellar subluxation.24 Knee rotation also increases patellar inclination.22 Therefore, knee rotation and TT external rotation may be important rotational deformities involved in the genesis of patellar instability and subluxation, but they may not be related to external tibial rotation. In addition to contributing to patellar instability, these factors also increase the pressure on the lateral facet of the patella and may worsen the anterior pain typically associated with patellar instability.21
In this study, all angle measurements included femur internal rotation, knee rotation, and TT external rotation. The mean PT-TG distance in the control group (8.4 mm) is similar to the values reported by other authors (10 ± 1 mm for 100 patients with possible meniscal injury,25 9.4 ± 0.6 mm for 20 patients with ACL or meniscal injury33) and slightly lower than the value reported by Wilcox et al,32 which included anterior pain patients and potential bias (11.61 mm for 50 patients with ligament or meniscal injury or anterior pain).
In 2000, Tsujimoto et al30 measured the TT lateral angular deviation via CT scan (similar to PT-TG angle 3 assessed in this study). These authors reported values of 36.3° for the patellar instability group and 20.2° for the control group (case-control study with 18 patellar instability patients vs 35 controls); these values were slightly greater than the values measured for the patellar instability patients and controls in our study (30.8° and 15.7°, respectively). It is difficult to compare values from CT scans and MRIs once studies have shown that linear measures such as TT-TG and PT-TG are not identical.17 There are no studies comparing the angular measurements between CT and MRI.
The increased female values found in the control group are similar to the results reported in the literature.2 The increased male values found in the instability group may reflect the difference in sample size between male and female patients or more severe deformities in males with patellar instability and should be further investigated. Subgroup analyses were not extensively studied, as the purpose of this initial study was to evaluate the reliability of the measures and its correlation with patellar instability.
Our data show that all measurements were significantly different between the patellar instability and control groups. The increases in PT-TG angle measurements were at least 20% higher than the increase in PT-TG distance. Cutoff values for each measurement were calculated to have a low frequency in the control group. The PT-TG angle measurements were more sensitive and specific than the PT-TG distance measurement. The specificity of the angle measurements was high because deviations are infrequent in the control population. Although much more frequent in the patellar instability group than in the control group, patellofemoral malalignment is present in only a small subgroup of patients, and therefore, the sensitivity is not high. This result is consistent with the literature, which reports incidences of high TT-TG (>20 mm) in a group of patellar instability patients between 6% and 15%.2,3,6,20 The LR+ for the 2 SD and 3 SD cutoff values showed stronger associations between PT-TG angles 2 and 3 and patellar instability compared with other measurements.
The larger the sensitivity, specificity, and LR+, the stronger the association of the measurements with patellar instability. Thus, all the angular measurements were more closely associated with patellar instability than the distance measurement. The strong association between the PT-TG angles and distance with patellar tilt suggests that these factors could be considered a cause of patellar tilt increase and incongruence. It is important to emphasize that these measures are not supposed to be used for the diagnosis of patellar instability, but rather help the assessment of the lateral quadriceps vector. Values over 2 SDs can be considered abnormal and over 3 SDs definitely abnormal (>27° and > 32°, respectively, for PT-TG angle 2). However, the decision for TT osteotomy should not rely solely on the diagnosis of quadriceps vector abnormality; other factors such as coronal alignment, correction of the Q angle during flexion, associated risk factors (tilt, patella alta, and trochlear dysplasia), and cartilage lesions or patellofemoral pain should also influence the decision. Thus, after adequate clinical research on the matter, the PT-TG angle could be more useful than the traditional TT-TG for the indication of tibial tubercle osteotomies.
The 3 PT-TG angles measured showed excellent reliability (ICC >0.8), similar to the PT-TG distance in this study and the values described in the current literature.25,32 Therefore, PT-TG angle measurements demonstrate high reliability and association with patellar instability and patellar incongruence and can assist in the assessment of extensor mechanism malalignment. These measurements can help surgeons to more accurately determine which patients will benefit from TT medialization osteotomy.
Each of the angles measured in this study presented advantages and disadvantages. Their general advantage is in assessing internal femur rotation, in addition to knee rotation and TT external rotation. PT-TG angle 1 is the simplest; however, it is less useful than the others because it does not assess the TT rotation around the center of the knee and has significantly lower association with patellar instability. When the PT-TG distance is measured along with the PT-TG angle 2, the condylar trochlear line is used for both measurements, with the addition of the transepicondylar line for the angle measurement. When the PT-TG distance is measured along with PT-TG angle 3, there are no common landmarks, and all lines should be measured independently. This is a disadvantage of using PT-TG angle 3 compared with PT-TG angle 2. The difference between PT-TG angles 2 and 3 is not the traditional 3° of rotation between the epicondylar axis and the posterior condylar axis because the reference trochlear groove lines cross the transepicondylar line at different points in each of these angles, changing the position of the vertices of the angles. The difference between them is not a simple rotation around the same reference point; instead, it involves rotation as well as translation. As a result, those 2 angles ended up having very similar values. Hence, our preferred method for PT-TG angle measurement is PT-TG angle 2, which should be standardized as the PT-TG angle measurement.
A possible bias of this study is the inclusion of patients with knee injuries, mainly ACL injuries, in the control group. The ideal control group might be healthy volunteers, but due to the cost of the examinations and unknown effects of selection bias, we decided to use the standard methods for control selection found in the literature.2,3,6,20,25,32 Additionally, there was no significant difference between ACL injury patients and other patients in the control group. The study currently cannot attribute clinical relevance to the PT-TG angles because there has been no follow-up of the patients or interventions. Patients are being followed for future studies. Another limitation is the mismatch between male and female populations in the instability and control groups. Although this limitation is relevant, it is difficult to find large male sample sizes with patellar instability. The cases and controls were not paired because we prioritized a large sample size and an average measure of the general population, which we consider important in this first study. Additionally, if the pattern found in this study holds, with a smaller number of male patients in the control group versus the instability group, increasing the number of males in the instability group would only accentuate the differences found; therefore, we accepted the sample difference and believe it does not invalidate the findings. Because the PT-TG angles are ratios and not absolute measurements, they might not vary with age and growth as the PT-TG distance varies, thus being more appropriate for evaluation in children.10 Sex and age differences will be examined in future studies.
Conclusion
The PT-TG angles and PT-TG distance are reliable measurements and different between patellar instability and control groups. PT-TG angles are more closely associated with patellar instability than the PT-TG distance, with greater sensitivity, specificity, and positive likelihood ratio.
Footnotes
The authors declared that they have no conflicts of interest in the authorship and publication of this contribution.
References
- 1. Arendt EA, Dejour D. Patella instability: building bridges across the ocean a historic review. Knee Surg Sports Traumatol Arthrosc. 2013;21:279–293. [DOI] [PubMed] [Google Scholar]
- 2. Balcarek P, Jung K, Ammon J, et al. Anatomy of lateral patellar instability: trochlear dysplasia and tibial tubercle-trochlear groove distance is more pronounced in women who dislocate the patella. Am J Sports Med. 2010;38:2320–2327. [DOI] [PubMed] [Google Scholar]
- 3. Balcarek P, Jung K, Frosch KH, Sturmer KM. Value of the tibial tuberosity-trochlear groove distance in patellar instability in the young athlete. Am J Sports Med. 2011;39:1756–1761. [DOI] [PubMed] [Google Scholar]
- 4. Beaconsfield T, Pintore E, Maffulli N, Petri GJ. Radiological measurements in patellofemoral disorders. A review. Clin Orthop Relat Res. 1994;308:18–28. [PubMed] [Google Scholar]
- 5. Bruce WD, Stevens PM. Surgical correction of miserable malalignment syndrome. J Pediatr Orthop. 2004;24:392–396. [DOI] [PubMed] [Google Scholar]
- 6. Camp CL, Stuart MJ, Krych AJ, et al. CT and MRI measurements of tibial tubercle-trochlear groove distances are not equivalent in patients with patellar instability. Am J Sports Med. 2013;41:1835–1840. [DOI] [PubMed] [Google Scholar]
- 7. Cooke TD, Price N, Fisher B, Hedden D. The inwardly pointing knee. An unrecognized problem of external rotational malalignment. Clin Orthop Relat Res. 1990;260:56–60. [PubMed] [Google Scholar]
- 8. Dejour H, Walch G, Nove-Josserand L, Guier C. Factors of patellar instability: an anatomic radiographic study. Knee Surg Sports Traumatol Arthrosc. 1994;2:19–26. [DOI] [PubMed] [Google Scholar]
- 9. Delgado ED, Schoenecker PL, Rich MM, Capelli AM. Treatment of severe torsional malalignment syndrome. J Pediatr Orthop. 1996;16:484–488. [DOI] [PubMed] [Google Scholar]
- 10. Dickens AJ, Morrell NT, Doering A, Tandberg D, Treme G. Tibial tubercle-trochlear groove distance: defining normal in a pediatric population. J Bone Joint Surg Am. 2014;96:318–324. [DOI] [PubMed] [Google Scholar]
- 11. Diederichs G, Kohlitz T, Kornaropoulos E, Heller MO, Vollnberg B, Scheffler S. Magnetic resonance imaging analysis of rotational alignment in patients with patellar dislocations. Am J Sports Med. 2013;41:51–57. [DOI] [PubMed] [Google Scholar]
- 12. Dodgin DA, De Swart RJ, Stefko RM, Wenger DR, Ko JY. Distal tibial/fibular derotation osteotomy for correction of tibial torsion: review of technique and results in 63 cases. J Pediatr Orthop. 1998;18:95–101. [PubMed] [Google Scholar]
- 13. Eckhoff DG, Bach JM, Spitzer VM, et al. Three-dimensional mechanics, kinematics, and morphology of the knee viewed in virtual reality. J Bone Joint Surg Am. 2005;87(suppl 2):71–80. [DOI] [PubMed] [Google Scholar]
- 14. Fithian DC, Paxton EW, Stone ML, et al. Epidemiology and natural history of acute patellar dislocation. Am J Sports Med. 2004;32:1114–1121. [DOI] [PubMed] [Google Scholar]
- 15. Fulkerson JP. Anteromedialization of the tibial tuberosity for patellofemoral malalignment. Clin Orthop Relat Res. 1983;177:176–181. [PubMed] [Google Scholar]
- 16. Hawkins RJ, Bell RH, Anisette G. Acute patellar dislocations. The natural history. Am J Sports Med. 1986;14:117–120. [DOI] [PubMed] [Google Scholar]
- 17. Hinckel BB, Gobbi RG, Filho EN, et al. Are the osseous and tendinous-cartilaginous tibial tuberosity-trochlear groove distances the same on CT and MRI? Skeletal Radiol. 2015;44:1085–1093. [DOI] [PubMed] [Google Scholar]
- 18. Kobayashi T, Fujikawa K, Nemoto K, Yamazaki M, Obara M, Sato S. Evaluation of patello-femoral alignment using MRI. Knee. 2005;12:447–453. [DOI] [PubMed] [Google Scholar]
- 19. Koeter S, Diks MJ, Anderson PG, Wymenga AB. A modified tibial tubercle osteotomy for patellar maltracking: results at two years. J Bone Joint Surg Br. 2007;89:180–185. [DOI] [PubMed] [Google Scholar]
- 20. Köhlitz T, Scheffler S, Jung T, et al. Prevalence and patterns of anatomical risk factors in patients after patellar dislocation: a case control study using MRI. Eur Radiol. 2013;23:1067–1074. [DOI] [PubMed] [Google Scholar]
- 21. Lee TQ, Morris G, Csintalan RP. The influence of tibial and femoral rotation on patellofemoral contact area and pressure. J Orthop Sports Phys Ther. 2003;33:686–693. [DOI] [PubMed] [Google Scholar]
- 22. Lin YF, Jan MH, Lin DH, Cheng CK. Different effects of femoral and tibial rotation on the different measurements of patella tilting: an axial computed tomography study. J Orthop Surg Res. 2008;3:5. [DOI] [PMC free article] [PubMed] [Google Scholar]
- 23. Metin Cubuk S, Sindel M, Karaali K, Arslan AG, Akyildiz F, Ozkan O. Tibial tubercle position and patellar height as indicators of malalignment in women with anterior knee pain. Clin Anat. 2000;13:199–203. [DOI] [PubMed] [Google Scholar]
- 24. Muneta T, Yamamoto H, Ishibashi T, Asahina S, Furuya K. Computerized tomographic analysis of tibial tubercle position in the painful female patellofemoral joint. Am J Sports Med. 1994;22:67–71. [DOI] [PubMed] [Google Scholar]
- 25. Pandit S, Frampton C, Stoddart J, Lynskey T. Magnetic resonance imaging assessment of tibial tuberosity-trochlear groove distance: normal values for males and females. Int Orthop. 2011;35:1799–1803. [DOI] [PMC free article] [PubMed] [Google Scholar]
- 26. Paulos L, Swanson SC, Stoddard GJ, Barber-Westin S. Surgical correction of limb malalignment for instability of the patella: a comparison of 2 techniques. Am J Sports Med. 2009;37:1288–1300. [DOI] [PubMed] [Google Scholar]
- 27. Reikeras O. Is there a relationship between femoral anteversion and leg torsion? Skeletal Radiol. 1991;20:409–411. [DOI] [PubMed] [Google Scholar]
- 28. Schoettle PB, Zanetti M, Seifert B, Pfirrmann CW, Fucentese SF, Romero J. The tibial tuberosity-trochlear groove distance; a comparative study between CT and MRI scanning. Knee. 2006;13:26–31. [DOI] [PubMed] [Google Scholar]
- 29. Song CY, Lin JJ, Jan MH, Lin YF. The role of patellar alignment and tracking in vivo: the potential mechanism of patellofemoral pain syndrome. Phys Ther Sport. 2011;12:140–147. [DOI] [PubMed] [Google Scholar]
- 30. Tsujimoto K, Kurosaka M, Yoshiya S, Mizuno K. Radiographic and computed tomographic analysis of the position of the tibial tubercle in recurrent dislocation and subluxation of the patella. Am J Knee Surg. 2000;13:83–88. [PubMed] [Google Scholar]
- 31. Turner MS, Smillie IS. The effect of tibial torsion of the pathology of the knee. J Bone Joint Surg Br. 1981;63-B:396–398. [DOI] [PubMed] [Google Scholar]
- 32. Wilcox JJ, Snow BJ, Aoki SK, Hung M, Burks RT. Does landmark selection affect the reliability of tibial tubercle-trochlear groove measurements using MRI? Clin Orthop Relat Res. 2012;470:2253–2260. [DOI] [PMC free article] [PubMed] [Google Scholar]
- 33. Wittstein JR, Bartlett EC, Easterbrook J, Byrd JC. Magnetic resonance imaging evaluation of patellofemoral malalignment. Arthroscopy. 2006;22:643–649. [DOI] [PubMed] [Google Scholar]
- 34. Yoshioka Y, Siu D, Cooke TD. The anatomy and functional axes of the femur. J Bone Joint Surg Am. 1987;69:873–880. [PubMed] [Google Scholar]