

Abstract
Linking the heavy chain (HC) and light chain (LC) genes required for monoclonal antibodies (mAb) production on a single cassette using 2A peptides allows control of LC and HC ratio and reduces non-expressing cells. Four 2A peptides derived from the foot-and-mouth disease virus (F2A), equine rhinitis A virus (E2A), porcine teschovirus-1 (P2A) and Thosea asigna virus (T2A), respectively, were compared for expression of 3 biosimilar IgG1 mAbs in Chinese hamster ovary (CHO) cell lines. HC and LC were linked by different 2A peptides both in the absence and presence of GSG linkers. Insertion of a furin recognition site upstream of 2A allowed removal of 2A residues that would otherwise be attached to the HC. Different 2A peptides exhibited different cleavage efficiencies that correlated to the mAb expression level. The relative cleavage efficiency of each 2A peptide remains similar for expression of different IgG1 mAbs in different CHO cells. While complete cleavage was not observed for any of the 2A peptides, GSG linkers did enhance the cleavage efficiency and thus the mAb expression level. T2A with the GSG linker (GT2A) exhibited the highest cleavage efficiency and mAb expression level. Stably amplified CHO DG44 pools generated using GT2A had titers 357, 416 and 600 mg/L for the 3 mAbs in shake flask batch cultures. Incomplete cleavage likely resulted in incorrectly processed mAb species and aggregates, which were removed with a chromatin-directed clarification method and protein A purification. The vector and methods presented provide an easy process beneficial for both mAb development and manufacturing.
Keywords: CHO, monoclonal antibody, 2A peptide, cleavage efficiency, furin, GSG linker
Abbreviations
- CHO
Chinese hamster ovary
- HC
heavy chain
- LC
light chain
- mAb
monoclonal antibody
- F2A
2A peptide derived from the foot-and-mouth disease virus
- E2A
2A peptide derived from the equine rhinitis virus
- P2A
2A peptide derived from the porcine teschovirus-1
- T2A
2A peptide derived from the Thosea asigna virus
- GF2A
F2A with the GSG linker
- GE2A
E2A with the GSG linker
- GP2A
P2A with the GSG linker
- GT2A
T2A with the GSG linker
- IgG
immunoglobulin G
- IRES
internal ribosome entry site
- G
glycine
- P
proline
- K
lysine
- MTX
methotrexate
- SEC
size exclusion chromatography
- MS
mass spectrometry
- PFM
protein-free medium
- HT
hypoxanthine and thymine
- GFP
green fluorescence protein
- PVDF
polyvinylidene difluoride
Introduction
Immunoglobulin G monoclonal antibodies (IgG mAbs) are the best-selling class of biopharmaceuticals on the market.1 Chinese hamster ovary (CHO) cells are the dominant host for producing mAb because of their capacity to perform proper folding, assembly and human-like glycosylation.2 Each IgG molecule consists of 2 identical heavy chain (HC) and 2 identical light chain (LC) polypeptides. Generating a mAb-producing cell line starts with transfecting CHO cells with plasmid vectors carrying the LC, HC and selection marker genes. Stably transfected clones with plasmid vectors integrated into the genome are then screened for high productivity, stable production and good product quality. LC, HC and the selection marker gene(s) are often co-transfected on separate vectors or placed on a single vector with multiple promoters where each gene is under the control of its own promoter.3 Poor coupling of the mAb and selection marker genes for such designs results in a significant proportion of non-expressing clones surviving drug selection.4-6 Another disadvantage of having separate expression units is the lack of accurate control of the relative LC and HC expression levels. Varied LC:HC ratios had been reported for clones generated using both co-transfection vectors and multi-promoter single vectors.6-9 The ratio of LC:HC expression affects both mAb expression level and quality, such as aggregation and glycosylation.8-17
Tricistronic vectors using internal ribosome entry sites (IRES) or 2A peptides to express the LC, HC and a selection marker gene in one transcript provides accurate control of the relative expression of LC over HC.6 Expressing the LC, HC and selection marker genes on one transcript also minimizes non-expressing clones because none of the 3 genes will be expressed should the vector be fragmented.6,18,19 IRES and 2A peptides use different mechanisms for co-expression of multiple genes in one transcript. When using IRES to express multiple genes in one mRNA, the gene directly downstream of the promoter is translated by the canonical cap-dependent mechanism, and those downstream of IRES are translated by a cap-independent mechanism. Because the cap-independent mechanism has lower translation efficiency than the cap-dependent mechanism,20 co-expressing LC and HC using IRES will result in unbalanced expression with lower expression of the IRES-driven gene.6, 15,18,21,22
In contrast, 2A linked genes are translated in one open reading frame and “self-cleavage” occurs co-translationally to give equal amounts of the co-expressed proteins.23-25 Many 2A peptides have been identified from viruses.26 F2A from the foot-and-mouth disease virus, which is the most studied 2A, has been used for mAb expression in mammalian cells and for in vivo gene therapy.18,21,27-31 2A peptides have approximately 20 amino acids and “self-cleavage” occurs between the last 2 amino acids, glycine (G) and proline (P). Adding a furin recognition sequence between the first gene and 2A aids in removing 2A residues from the upstream gene.21,28 Productivities of F2A vector derived clones have been shown to be comparable to those generated using an industry reference vector designed to use separate expression units for each gene.29 Studies had also shown that using F2A gave over 2-fold higher mAb expression levels than IRES in transient transfections and 20% higher expression in stable transfection.18,21 However, incomplete cleavage of F2A was observed in some studies, resulting in HC-F2A-LC or LC- F2A-HC fusion proteins and LC and HC attached with F2A remnants.18,27,30 The incorrectly processed peptides formed aggregates that could not be removed by protein A purification.18
Besides F2A, E2A from equine rhinitis A virus, P2A from porcine teschovirus-1 and T2A from Thosea asigna virus have also been used widely in biomedical research.32 There are conflicting reports on the relative cleavage efficiency of these 2A peptides. One study showed T2A had the highest cleavage efficiency, followed by E2A, P2A and F2A, when compared using in vitro transcription/translation experiments,33 while another study reported F2A and T2A had higher efficiency than E2A in a similar experimental setup.34 When evaluated in human cell lines, zebrafish and mice, P2A exhibited the highest cleavage efficiency followed by T2A, E2A and F2A.32 The cleavage efficiency of a 2A peptide may be affected by the nature of the protein expressed,33,35 the order of genes flanking 2A,18,36 the length of the 2A peptide used,33,37 and the linker between the upstream protein and 2A.34,38,39 Inserting GSG and SGS linkers, V5 epitope tag (GKPUPNPLLGLDST) and 3xFlag epitope tag immediately preceding 2A has been shown to improve 2A cleavage efficiency,34,39,40 while inserting an ad-hoc sequence for cloning purposes resulted in decreased cleavage efficiency.38 The different cleavage efficiencies observed for these 2A peptides could be due to the changes in the experimental designs.
To date, only F2A has been evaluated for mAb expression in mammalian cells. In this work, we compared use of F2A, P2A, E2A and T2A in the expression of 3 biosimilar IgG1 monoclonal antibodies, trastuzumab, adalimumab and bevacizumab, in 2 CHO cell lines, CHO DG44 and CHO K1, in transient and stable transfections. HC and LC are linked by different 2A peptides in the absence and presence of GSG linkers. A furin recognition site is added upstream of 2A to remove the 2A residues left after 2A cleavage. The cleavage efficiencies at the furin and 2A recognition sites were compared and aggregate levels of the expressed mAbs were also examined. A purification method was further developed to remove the incorrectly processed mAb due to incomplete cleavage of 2A peptide.
Results
Comparison of mAb expression and cleavage efficiency in transient transfections
F2A, P2A, E2A and T2A with added upstream furin recognition sites were compared for expression and cleavage efficiency of biosimilar trastuzumab IgG1 using CHO DG44 cells in transient transfections. Eight tricistronic vectors were constructed with HC and LC linked by different 2A peptides in the absence and presence of GSG linkers (Fig. 1). 2A peptides with GSG linkers were designated as GX2A. For example, F2A would be a 2A peptide from the foot-and-mouth disease virus and GF2A would be the F2A with a GSG linker. DHFR was under the control of a mutant IRES with attenuated translation for stringent selection of high producing cells in stable transfections.18
Figure 1.
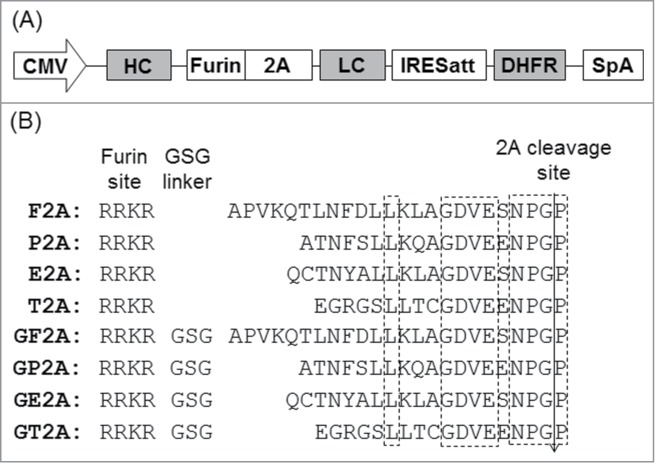
Schematic representation of the vectors containing different 2A peptides for mAb expression (A) and corresponding amino acid sequences of various 2A peptides (B). The conserved regions of 2A peptides are highlighted in dotted boxes. CMV, human cytomegalovirus IE gene promoter; HC, heavy chain cDNA; Furin, DNA encoding furin recognition sequence RRKR; LC, light chain cDNA; IRESatt, mutated encephalomyocarditis virus (EMCV) internal ribosomal entry site; DHFR, dihydrofolate reductase cDNA; SpA, simian virus 40 early polyadenylation signal.
The eight vectors were transfected into CHO DG44 cells. Supernatant was collected 48 h post-transfection for analysis of mAb concentration and cleavage efficiency. The changes in mAb expression from different vectors were normalized to an internal GFP control and the vector containing the F2A (Fig. 2A). P2A and E2A had 18.5% and 58.8% of the normalized mAb expression from F2A, respectively, while T2A enhanced mAb expression by 2.6-fold. Inserting a GSG linker enhanced mAb expression for F2A, P2A and T2A but had no effect on E2A. GF2A gave expression 1.8-fold higher than F2A and GP2A was 12.0-fold higher than P2A. GT2A gave the highest mAb expression among different 2A peptides.
Figure 2.

Comparison of 2A peptides for mAb expression and cleavage efficiency in transient transfections. (A) Expression of trastuzumab in CHO DG44. (B) Expression of adalimumab in CHO DG44. (C) Expression of bevacizumab in CHO DG44. (D) Expression of trastuzumab in CHO K1. CHO DG44 or K1 cells were co-transfected with an appropriate vector containing a specific 2A peptide and an internal control vector expressing GFP. mAb expression was quantified by ELISA at 48 h post-transfection and then normalized to GFP expression. GFP normalized expression was further normalized to the control vector containing F2A. Each point of normalized mAb expression represents the average and standard deviation of duplicate measurements from 2 independent transfections. Cleavage efficiency of each furin-2A peptide was determined by western blotting analysis of supernatant under reducing conditions. Protein A purified biosimilar trastuzumab expressed from a previously described IRES-mediated tricistronic vector was used as positive control,6 and supernatant from non-transfected cells as blank.
Cleavage efficiencies at the furin and 2A recognition sites were determined by western blotting under reducing conditions. “Self-cleavage” of 2A peptides occurs between the last 2 amino acids, G and P.23 The P attached to the LC will be removed together with the signal peptide. Cleavage at the furin recognition site occurs in the middle of RRKR. RR residues left after furin cleavage together with the last K on the C-terminus of HC will be removed by carboxypeptidases.28 Successful cleavages at both the furin and 2A recognition sites are required to generate correctly processed HC and LC polypeptides. Presence of HC-Furin-2A-LC indicates failure of cleavage at both the furin and 2A recognition sites. Presence of HC-Furin-2A indicates successful cleavage at the 2A recognition site, but cleavage failure at the furin recognition site. Presence of 2A-LC indicates successful furin cleavage but failed 2A cleavage.
Western blotting analysis detected 4 bands in product expressed from F2A. The bands corresponded to HC-Furin-F2A-LC at 80 kDa, HC-Furin-F2A at 55 kDa, HC at 50 kDa and LC at 25 kDa. This result is consistent with our previous study.18 In contrast, cleavage of P2A was more efficient at the furin recognition site but less efficient at the 2A recognition site, as indicated by the absence of HC-Furin-2A band at 55 kDa and the presence of a significant P2A-LC band at 30 kDa, respectively. Three bands corresponding to HC-Furin-E2A-LC, HC-Furin-E2A, and LC were detected in product from E2A. Absence of the correct HC indicated complete failure of furin cleavage. T2A exhibited the highest cleavage efficiency at both the furin and 2A recognition sites. Only one incorrect species, HC-Furin-2A, was detected at very low amount. Inserting a GSG linker slightly enhanced cleavage efficiency at the furin and 2A recognition sites for F2A as indicated by the reduced relative intensity of the HC-Furin-2A-LC band. For P2A, GSG dramatically enhanced the cleavage efficiency at the 2A recognition site and reduced the 2A-LC in product from GP2A. Inserting GSG improved furin cleavage efficiency and reduced HC-Furin-2A in product expressed from GE2A compared to E2A. GT2A did not exhibit any significant improvement over T2A. 2A cleavage efficiency correlated to mAb expression level. T2A and GT2A had the highest cleavage efficiency at the 2A recognition site and also the highest mAb expression. P2A had the lowest cleavage efficiency and mAb expression. GSG enhanced cleavage efficiency at the 2A recognition site for F2A and P2A, and mAb expressions from these 2 2A peptides increased. Interestingly, enhancing cleavage at the furin recognition site did not result in enhanced mAb expression from GE2A compared to E2A.
The four 2A peptides were also compared for transient expression of biosimilar adalimumab and bevacizumab IgG1 antibodies in CHO DG44 cells and biosimilar trastuzumab in CHO K1 cells (Fig. 2B, C and D). Similar trends of mAb expression and cleavage efficiencies were observed for the other biosimilar products, and for trastuzumab in CHO K1 cells. T2A and GT2A still gave the highest mAb expression and cleavage efficiency, and P2A had lowest mAb expression and cleavage efficiency. Similarly, GSG enhanced mAb expression for F2A and P2A and cleavage efficiency for F2A, P2A and E2A.
Comparison of mAb expression and cleavage efficiency in stable transfections
The 2A peptides were next compared for expression and cleavage efficiency of biosimilar trastuzumab in stable transfections using CHO DG44 cells. Two stably transfected pools were generated for each vector and sequentially amplified in medium containing MTX at 50 nM and 500 nM. The final amplified pools at 500 nM MTX were obtained 2 months after transfection. The amplified pools at 500 nM were characterized in shake flask batch culture for about 10 d before viability declined below 50%. Peak viable cell densities were similar between pools generated using different 2A peptides, reaching approximately 4 × 10⁶ cells/mL at day 5 or 6. Supernatant was collected at the end of culture for mAb titer quantification by rate nephelometry and cleavage analysis by protein gel blot. mAb titers in the stably amplified pools displayed a similar trend as the transient transfections (Fig. 3A). P2A still gave the lowest mAb titer of 23.0 mg/L in shake flask batch cultures. T2A and GT2A had the highest mAb titers of around 600 mg/L. GSG linkers again increased mAb titers for F2A and P2A. Similarly, cleavage efficiency was the lowest for P2A and the highest using T2A and GT2A (Fig. 3B). Cleavage efficiency for F2A, P2A and E2A also improved with linker addition.
Figure 3.

Comparison of different 2A peptides for biosimilar trastuzumab expression and cleavage in stably transfected pools. (A) Titer of trastuzumab in stably transfected pools generated using vectors containing various 2A peptides. Each point represents the average and standard deviation of duplicate measurements from 2 independent stably transfected pools. (B) Western blotting of supernatants in stable transfected pools generated using vectors containing various 2A peptides. Protein A purified biosimilar trastuzumab expressed from a previously described IRES-mediated tricistronic vector was used as standard,6 and supernatant from non-transfected cells as blank.
GT2A was subsequently used to generate stably transfected and amplified CHO DG44 pools expressing biosimilar adalimumab and bevacizumab. Titers of biosimilar adalimumab and bevacizumab in the amplified pools at MTX 500 nM reached 416.0 and 357.0 mg/L, respectively, in shake flask batch cultures, confirming that GT2A can be used for high level expression of different antibodies.
Protein A purification and quality analysis of mAb
The biosimilar trastuzumab products expressed from different 2A peptides were first purified using a traditional clarification method of centrifuging and filtration before protein A affinity purification. The purified products were analyzed on SDS-PAGE under both reducing and non-reducing conditions (Fig. 4A). The relative intensities of HC-Furin-2A-LC, HC-Furin-2A, HC, and 2A-LC for the different 2A peptides detected on SDS-PAGE under reducing conditions were consistent to those detected on western blot (Fig. 3B). HC-Furin-2A-LC and HC-2A were detected in products from all 2A peptides. Correspondingly, aggregates with molecular weights greater than 150 kDa was observed for all 2A peptides under non-reducing condition. The level of aggregates correlated with the relative amount of incorrectly processed products detected under reducing conditions. Product from T2A and GT2A, which had more correctly cleaved products, contained relatively lower levels of aggregates, compared with product from F2A, P2A and E2A, which had more incorrect species exhibited higher aggregate levels.
Figure 4.

Quality analysis of biosimilar trastuzumab expressed from various 2A peptides and purified using traditional clarification method and protein A. (A) SDS-PAGE analysis of purified mAbs under non-reducing and reducing conditions. Protein A purified biosimilar trastuzumab expressed from a previously described IRES-mediated tricistronic vector was used as standard,6 and supernatant from non-transfected cells as blank. (B) Quantitative comparison of aggregates for various 2A peptides. Each point represents the average and standard deviation of the duplicate measurements from 2 independent stably transfected pools.
Aggregates in the purified products from duplicate stably transfected pools of each 2A peptide were quantified using size exclusion chromatography (SEC) coupled to a UV detector and a dynamic light scattering detector. The average level of aggregate is shown in Figure 4B. Products from P2A had the highest aggregation level followed by E2A, F2A and T2A. Adding a GSG linker reduced aggregates for all 2A peptides. Product from GT2A had less than 10% aggregate. SEC fractions were collected and further analyzed on SDS-PAGE to identify their species. A representative UV chromatogram (Fig. 5A) and SDS-PAGE image of reduced fractions (Fig. 5B) for GT2A product are shown. The higher molecular weighted P1 and P2 peaks contained mainly incorrectly processed HC-2A-LC and HC-2A. P3 with molecular weight corresponding to IgG monomer was mostly correctly processed HC and LC, but also contained low amounts of HC-2A. Similar results were observed for products expressed from other 2A peptides (data not shown).
Figure 5.

Characterization of aggregate in biosimilar trastuzumab expressed from GT2A and purified using traditional clarification method and protein A. (A) UV chromatogram of a purified sample. Peak P1 and P2 correspond to aggregate and P3 corresponds to IgG monomer. (B) SDS-PAGE analysis of the fractions separated by SEC. Protein A purified biosimilar trastuzumab expressed from a previously described IRES-mediated tricistronic vector was used as standard,6 and supernatant from non-transfected cells as blank.
Improved purification with added chromatin-directed clarification step
An alternative chromatin-directed clarification method was added to test for its ability to remove the unwanted incorrectly processed mAb products.41,42 The harvested supernatant was treated with a clarification cocktail before being subjected to centrifuge, filtration and protein A purification. The clarification cocktail consisted of MacroPrep™ High-Q, MacroPrep High-S, MacroPrep t-Butyl, Chelex™-100, allantoin and ethacridine, which were suggested to be effective for removing large molecular assemblies. The purified biosimilar trastuzumab was analyzed on SDS-PAGE and SEC. Incorrect HC-Furin-2A-LC and HC-Furin-2A species were completely removed (Fig. 6A). The level of aggregate was reduced to less than 1% (Fig. 6B). Over 90% IgG monomer was recovered after protein A purification by using the novel clarification method. The recovery rate was similar to the use of traditional clarification method. This protocol was also applied to the purification of biosimilar adalimumab and bevacizumab expressed from GT2A. Incorrect mAb species were also effectively removed as determined by SDS-PAGE and SEC (data not shown).
Figure 6.

Quality analysis of biosimilar trastuzumab purified using improved purification method. (A) SDS-PAGE analysis of reduced product purified using either traditional or improved clarification methods and protein A. 1X, 2X, and 4X represent loading amount of purified mAb of 10, 5, and 2.5 μg. (B) UV chromatogram of a sample purified using improved clarification and protein A.
NanoLC-MS/MS analysis of mAbs purified using improved purification method
To obtain more accurate protein characterization, biosimilar trastuzumab, adalimumab and bevacizumab expressed from GT2A and purified using the improved method were analyzed on NanoLC-mass spectrometry (MS)/MS. Samples purified by the chromatin-directed clarification and protein A were separated on SDS-PAGE under reducing conditions. The excised bands corresponding to LC and HC polypeptides were digested by trypsin or chymotrypsin before NanoLC-MS/MS analysis. No miscleaved signal peptides were observed on LC and HC for mAbs and RR residues left after furin cleavage were removed together with the last lysine (K) of HC in all mAb.
Discussion
We compared F2A, P2A, E2A and T2A alone and with added GSG linkers for expression of 3 IgG1 mAbs in CHO DG44. In each vector, HC and LC were linked in one open reading frame by a furin recognition site and a 2A peptide. Obtaining correctly processed HC and LC polypeptides requires cleavage at both the furin and 2A recognition sites. Incomplete cleavage would result in HC-2A-LC fusion proteins and HC or LC attached with 2A residues. Complete cleavage was not observed for any 2A peptides even with GSG linkers. In the absence of GSG, T2A had the highest cleavage efficiencies at both furin and 2A recognition sites followed by F2A. P2A had the lowest 2A cleavage efficiency and E2A had the lowest furin cleavage efficiency. Cleavage efficiency at the furin and 2A recognition sites are both affected by the expressed proteins and the amino acids immediately surrounding their respective recognition sites.33,35,43,44 P2A was reported to have the highest cleavage efficiency compared to the other 3 2A peptide in a previous study.32 The low cleavage efficiency of P2A observed in this work could be due to the nature of HC and LC polypeptides. Another possibility is that the furin recognition sequence exerted negative effect on P2A's cleavage. The low cleavage efficiency of furin in the context of E2A could be due to the amino acids at the N-terminus of E2A. GSG linkers enhanced cleavage efficiency at both furin and 2A recognition sites and was most effective for 2A peptides with lower cleavage efficiency. As GSG affords more flexibility, it may enhance cleavage efficiency at both sites by creating more favorable conformations by increasing exposure of furin recognition site at the protein surface and preventing inhibition of 2A cleavage caused by interference from protein upstream of 2A.
The relative cleavage efficiency at furin and 2A recognition sites remained similar for expression of different IgG1 in different CHO cell lines. This is not surprising as different IgG1 molecules have similar tertiary structures and conserved constant regions. The 2A “ribosome-skip” cleavage mechanism, which is determined by the interaction between 2A peptide and the ribosome tunnel, is conserved in all mammalian cells. It can be expected that the relative cleavage efficiency of 2A peptides should remain similar for expressing the same class of mAbs, such as IgG1, even in other mammalian cells. Because cleavage efficiency at the furin and 2A recognition sites are both affected by the amino acids immediately surrounding their respective recognition sites,33,35,42,43 the ranking of cleavage efficiency for these 4 2A peptides may change when expressing other types of mAbs that have different amino acids in the constant regions. Evidence of this is the complete cleavage of F2A observed when expressing a rat IgG1 in a previous study,21 but not for humanized IgG1 as shown in this work. It would be advisable to evaluate the cleavage efficiency of different 2A peptides when expressing different antibodies or recombinant proteins.
The best furin-2A combination identified in this work, GT2A, was unable to provide complete cleavage at both the furin and 2A recognition sites. The incorrectly processed HC and LC polypeptides resulted in approximately 10% aggregate. Although these incorrect species and aggregate can be removed by an easy clarification method, it is not favorable for mAb expression. Cleavage efficiency at the 2A recognition site could be improved by using longer versions of the 2A peptides or optimization of the linker preceding 2A. Besides GSG or SGS, insertion of the V5 epitope tag (GKPUPNPLLGLDST) and 3xFlag epitope tag immediately preceding 2A had also been shown to improve 2A cleavage efficiency.34,39,40 2A peptides with higher cleavage efficiency could also be identified by screening other 2A peptides, which were recently identified, but have yet to be well characterized.26 The consensus sequence for furin cleavage is RXXR, but the potential for actual cleavage is dependent on the amino acids immediately surrounding the recognition site.44 A recent study found that the 2 amino acids upstream and 4 amino acids downstream of RXXR were critical for cleavage and the frequency of these amino acids in the best substrates for furin cleavage were determined.43 Furin recognition sequences with improved cleavage could be designed based on these highly conserved sequences. As furin and 2A amino acids could interfere with each other, optimization of furin and 2A cleavage should be carried out in the same context.
SDS-PAGE analysis indicated that the aggregate in products expressed from 2A peptides contained mainly aberrant forms of IgG, consisting of HC-2A-LC fusion proteins and HC attached with 2A residues. The incorrectly processed HC and LC are inclined to form aggregate probably due to improper folding and assembly, resulting in mAb with unfavorable conformation. Because protein A binds to the IgG Fc region and is unable to discriminate between incorrect and correctly assembled HC polypeptides, aggregates and incorrect IgG species could not be removed by protein A purification. Recent studies found that mAb aggregate existed mostly in complex with chromatin derived species released from dead cells, such as histones and genomic DNA.41,42 It was postulated that the chromatin-directed clarification method removed aggregate by the combined actions of different components in the clarification cocktail: (1) allantoin binds large molecular assemblages by multi-point hydrogen bonding, (2) ethacridine facilitates aggregate dissociation by weakening protein-DNA interactions, and (3) multimodal particles enhance removal of aggregates and residual additives.41,42 Notably, we found the chromatin-directed clarification method effectively removed all the unwanted IgG species contributing to the aggregates and even the incorrectly processed HC-2A previously eluted with the IgG monomer P3 peak seen in Figure 5B. This suggests that the clarification cocktail had specific interactions with the incorrect IgG species. As the aggregates contained mainly incorrect IgG species, aggregate removal by the chromatin-clarification method was likely by interaction with the incompletely cleaved HC and LC. The difference between the incorrect and correct IgG species is the 2A peptide sequence (plus GSG and furin recognition site). The clarification cocktail may discriminate the correct and incorrect IgG species by specifically interacting with the 2A peptide sequence or confirmation change caused these extra amino acids.
The GT2A tricistronic vector designed in this work enables easy generation of high mAb-producing stably transfected pools in short time. The timeline required from transfection to obtaining stable pools was about 2 months, giving titers of a few hundred mg/L in shake flask batch cultures without the need of clone isolation. Higher titers could be obtained by using additional commercially available feed media. Highly purified IgGs could be obtained by protein A in combination with a chromatin-directed clarification. This shortened and easy process of mAb expression and purification is beneficial for both mAb manufacturing and development. Sufficient amounts of mAb can be produced in stable pools for preclinical studies. The high producing pools would also reduce the number of clones to be screened for high productivity.
Materials and Methods
Cell culture and media
CHO K1 (ATCC, CCL-61) and CHO DG44 (Life Technologies, A11000–01) cells were cultured in a protein-free medium (PFM) consisting of an equal ratio of CD CHO (Life Technologies, 10743–029) and HyQ PF (Hyclone, SH30333.01), supplemented with 6 mM glutamine (Sigma-Aldrich, G8540), 1 g/L sodium bicarbonate (Sigma-Aldrich, S5761), 0.05% Pluronic F-68 (Life Technologies, 24040–032), and 1% sodium hypoxanthine and thymine (HT; Life Technologies, 11067–030, for CHO DG44 cells only). Both cells were maintained in 125 mL shake flasks (Corning, NY). Subculturing was carried out every 3 to 4 d by diluting the cultures to 3×10⁵ cells/mL in fresh medium each time. Cell viability and density were determined by trypan blue exclusion method using a Vi-Cell XR analyzer (Beckman Coulter, CA).
Vector construction
Tricistronic vectors containing different 2A peptides and mAb genes were constructed by replacing the HC-Furin-F2A-LC region in a previously described vector with HC-Furin-2A-LC elements containing HC cDNA, DNA encoding a furin recognition site, DNA encoding a specific 2A peptide and LC cDNA.18 HC instead of LC was arranged upstream of furin-2A for higher 2A cleavage efficiency.18 The DNA elements encoding different furin-2A peptides were synthesized by 1ST base (Singapore). The HC and LC cDNA of biosimilar trastuzumab, adalimumab, and bevacizumab were synthesized by Genescript (Piscataway). The HC cDNA, furin-2A and LC cDNA were assembled by overlapping PCR. The amino acid sequences of each furin-2A peptide were shown in Figure 1. The DNA sequences of each 2A peptide were designed based on the literature.32 One set of 2A peptides was designed without GSG linkers, and the other set contained GSG linkers for higher 2A cleavage efficiency.34,39
Transient transfections
Transient transfections of CHO DG44 and K1 cells were carried out using Nucleofactor kit V (Lonza, VCA1003) and program U-24 on a Nucleofector II system (Lonza, Cologne, Germany) following the manufacturer's instructions. Five × 106 cells were co-transfected with 2 μg of an appropriate mAb expressing plasmid and 0.2 μg of a green fluorescence protein (GFP) expressing plasmid pMax-GFP (Lonza, VDF1011) in each transfection. The pMax-GFP acts as an internal control to normalize the variations in transfection efficiency. The transfected cells were then resuspended with 2 mL of PFM for CHO K1 or PFM containing HT for CHO DG44 cells in 6-well suspension culture plates (Thermos Scientific, 150239). At 48 h post-transfections, supernatant was collected for quantification of mAb expression by using ELISA as previously described.12 Cells were also collected at the same time for measuring GFP fluorescence intensity, which reached peak at 48 h post-transfection, by using a FACS Calibur (Becton Dickinson, MA). The capture antibodies for ELISA were affinity purified goat anti-human IgA+IgG+IgM (HC+LC) (KPL, 01–10–07), and the detection antibodies were goat anti-human IgG (Fc specific) conjugated to alkaline phosphatase (Sigma-Aldrich, A9544).
Stable transfections
Transfections to generate stable pools were performed using the same protocol as for transient transfections with slight modifications. One × 107 CHO DG44 cells were transfected with 5 μg of an appropriate linearized mAb expressing plasmid. The transfected cells were then resuspended in 2 mL HT-containing PFM in 6-well suspension culture plate. At 24 h post-transfection, the transfected cell culture were centrifuged at ∼100 × g for 5 min. Cell pellets were then resuspended in 25 mL PFM without HT in 125 mL shake flasks to select for stable transfectants. When viability of stably transfected pools recovered above 95%, stepwise methotrexate (MTX, Sigma, M8407) amplification was carried out with concentrations of 50 nM to 500 nM. Productivity of amplified pools at 500 nM was determined in 125 mL shake flask batch cultures. Cells were seeded at 2 × 10⁵ cells/mL. Cell density and viability were monitored using Vi-Cell every day until viability dropped to below 50%. The supernatant was collected at the end of culture and analyzed for mAb concentration using a nephelometric method on an IMMAGE 800 immunochemistry system (Beckman Coulter, Buckinghamshire, England). The IMMAGE 800 system uses anti-human Fc region antibodies for IgG detection.
Western blotting
Supernatants collected from transient transfections and stably transfected pools were analyzed using protein gel blotting. Phosphate-buffered saline (Life Technologies, 21600–010) were added as required for each sample and heated at 95°C for 2 min. Samples containing 2 ng of mAb determined by ELISA were loaded onto NuPAGE 4–12% Bis-Tris gel (Life Technologies, NP0335BOX) in 1x MES buffer (Life Technologies, NP0002). Proteins were transferred to polyvinylidene difluoride (PVDF, Life Technologies, IB401001) membranes using the iBlot system (Life Technologies). Membranes were blocked in 5% blocking milk (Biorad, L1706404) in TBS with 0.1% Tween for 1 h at room temperature and incubated overnight in HRP conjugated goat anti-human IgG Fc antibody (1:2000; Bethyl Laboratories, A80–304P) and HRP conjugated goat anti-human Kappa LC (1:5000; Bethyl Laboratories, A80–115P). Detection was done using ECL Prime (Amersham-GE Healthcare Life Sciences, RPN2232) and exposed on Lumi-Film Chemiluminescent Detection Film (Roche, 11666916001).
mAb purification
Supernatants collected from stably transfected pools at the end of culture were processed using 2 protocols prior to protein A purification. In the first protocol, supernatants were directly centrifuged at 4000 × g for 20 min at room temperature, followed by filtration through 0.22 μm Nalgene® Rapid-Flow Filters (Thermo Scientific, cat. 295–3345). The second protocol, which can reduce aggregate, was carried out as described previously.41,42 In brief, an equilibrated mixture of particles was first prepared by mixing equal amount of MacroPrep® High-Q (Bio-Rad Laboratories, cat. 156–0041), MacroPrep® High-S (Bio-Rad Laboratories, cat. 156–0031), MacroPrep® t-Butyl (Bio-Rad Laboratories, cat. 156–0091) and Chelex® 100 (Bio-Rad Laboratories, cat. 142–2832) and washing with PBS at pH 7.2. Allantoin (Merck Millipore, cat. 101015) and ethacridine (Sigma-Aldrich, cat. D16606) were added to the cell-containing supernatant at concentrations of 1% and 0.025%, respectively. The suspension was mixed for 60 minutes, and then the equilibrated mixed particles prepared beforehand were added at a proportion of 5% (v/v). The suspension was mixed again for overnight at 4°C. Solids were removed by centrifuged at 4000 × g for 20 min at room temperature and the supernatant was further microfiltered or passed through a Sartoclear® PC1 Cap depth filter capsule (Sartorius-Stedim, Göttingen, Germany). The clarified supernatants from either protocol were finally purified using protein A on a GE ÄKTA Explorer 100 (GE Healthcare, Uppsala, Sweden) as described previously.15
Size exclusion chromatography
Purified mAb was analyzed for aggregation using SEC as previously described.15 Briefly, 80 μg of IgG was injected to an HPLC system (Shimadzu, Kyoto, Japan), which was connected in series with a TSK Guard column SWXL, 6 mm × 40 mm, a TSK gel G3000 SWXL, 7.8 mm × 300 mm (both from Tosoh Corporation, Tokyo, Japan), a UV-Vis detector, followed by a MALS detector (Dawn 8 from Wyatt Technology Corporation, CA, USA). IgG aggregates and monomers were separated by the SEC column (TSK gel G3000 SWXL), which was kept at 25°C, using an isocratic mobile phase of aqueous solution containing 0.3 M sodium dihydrogen phosphate (Merck, cat.# 1.06346), 84 mM disodium hydrogen phosphate (Merck, cat.# 1.06586) and 0.1 M potassium sulfate at pH 6.0 (Merck, cat.# 1.05153) at 0.5 mL/min. The molecular weight of each elution peak was estimated by ASTRA V 5.3.4.20 software (Wyatt Technology Corporation, CA). Relative peak areas from the UV280 nm channel were used to calculate the percentage of IgG aggregates and monomers. The SEC-MALS HPLC system was calibrated using monomeric bovine serum albumin.
SDS-PAGE analysis
Prior to SDS-PAGE separation of the purified mAbs, 4 μg of each purified mAb sample was denatured by boiling in the presence of 25 mM reducing agent DTT (Bio-Rad Laboratories, 161–0611) for reduced gel and absence of reducing agent for non-reducing gel at 95°C for 10 min in the 1x Laemmli buffer [62.5 mM Tris-HCl, pH 6.8, 10.5% glycerol (BDH, 101186), 2% SDS (Bio Rad, 161–0148), 0.01% Bromophenol Blue (PlusOne, 17–1329–01)]. The reduced and non-reduced denatured mAb protein samples were separated by Bio-Rad Mini-PROTEAN® TGX™ polyacrylamide precast gels (4–15%) for 30 min at 200 V, and stained with 0.1% Coomassie blue R-250 (Pierce, 20278) in 50% methanol,10% acetic acid, 40% H2O (V/V). The gel was destained with 10% methanol and 5% acetic acid and 30% ethanol, and then scanned on Imagescanner III (GE Healthcare).
NanoLC-MS/MS analysis
Purified mAbs were analyzed for the N- and C-terminal cleavage using NanoLC-MS/MS. Briefly, the gel bands for heavy chain and light chain were excised from the SDS-PAGE, washed with 25 mM ammonium bicarbonate-50% acetonitrile and dehydrated with acetonitrile, reduced with 25 mM DTT in 50 mM ammonium bicarbonate at 56°C for 25 min, and alkylated with 55 mM iodoacetamide at room temperature in the dark for 30 min. After dehydration, gel plugs were digested with 10 ng/μL mass spectrometry grade trypsin gold (Promega, V5280) or chymotrypsin (Promega, V1062) in 25 mM ammonium bicarbonate at 37°C overnight. Peptides were extracted first with 20 mM ammonium bicarbonate, then with 50% acetonitrile, 5% formic acid in H2O, pooled peptides were evaporated to dryness in SpeedVac (Savant Instruments, Holbrook, NY), and re-suspended with 20 μL of 2% methonal-1% formic acid.
Nanoscale liquid chromatography (NanoLC) was performed on nanoACQUITY UPLC System (Waters). In-gel digested peptides (2 μL) was desalted in Symmetry C18 trapping column, 180 μm x 20 mm, 5 μm (Waters) for 5 min with 2% mobile phase B (0.1% formic acid in acetonitrile) at 8 μL/min. The desalted peptides were separated online in nanoACQUITY UPLC BEH130 C18 column, 1.7 μm, 75 μm × 150 mm (Waters Milford, MA). The flow rate was 0.3 μL/min, and the column temperature was 35°C. Mobile phase A was composed of 0.1% formic acid while mobile phase B was 0.1% formic acid in acetonitrile, the 40 min gradient was from 2–40% B for 25 min, 40–97% B for 5 min, 97% B for 5 min, 10% B for 0.5 min, and then 10% B for 5 min.
MS analysis was performed on LTQ-Orbitrap Velos Pro Mass Spectrometer (Thermo Fisher Scientific, San Jose, CA) using nanoelectrospray in positive ionization mode (CID) at 1.7 kV. The LTQ-Orbitrap Velos Pro was operated in a top-10 data dependent mode using survey scans at 60,000 resolution from 300 to 1800 m/z. Tandem MS scans were acquired with normalized collision energy set to 35 V for CID, Ion trap and Orbitrap maximal injection times were set to 100 ms and 10 ms, respectively. Raw data files were converted by Thermo Scientific MSFileReader 2.2, and analyzed by PEAKS studio 7.0 software (Bioinformatics Solutions Inc..). The peptide and fragment ion mass tolerances used were ± 5 ppm and ± 0.5 Da, respectively. The specified search parameters were carbamidomethylation of cysteine as fixed modification, oxidation of methionine as dynamic modification and tryptic digestion with 1 missed cleavage. De novo sequencing, database search and Spider program against in-house created trastuzumab, adalimumab, bevacizumab database with sequentially shortened antibody sequences from the N-terminal translational start based on the DNA coding sequences.
Disclosure of Potential Conflicts of Interest
The authors declare no commercial or financial conflict of interest.
Funding
This work was supported by the Biomedical Research Council/Science and Engineering Research Council of A*STAR (Agency for Science, Technology and Research), Singapore.
References
- 1. Nelson AL, Dhimolea E, Reichert JM. Development trends for human monoclonal antibody therapeutics. Nat Rev Drug Discov 2010; 9:767-74; PMID:20811384; http://dx.doi.org/ 10.1038/nrd3229 [DOI] [PubMed] [Google Scholar]
- 2. Ho SCL, Tong YW, Yang YS. Generation of monoclonal antibody-producing mammalian cell lines. Pharmaceut Bioprocess 2013; 1:71-87; http://dx.doi.org/ 10.4155/pbp.13.8 [DOI] [Google Scholar]
- 3. Birch JR, Racher AJ. Antibody production. Adv Drug Deliv Rev 2006; 58:671-85; PMID:16822577; http://dx.doi.org/ 10.1016/j.addr.2005.12.006 [DOI] [PubMed] [Google Scholar]
- 4. Barnes LM, Bentley CM, Moy N, Dickson AJ. Molecular analysis of successful cell line selection in transfected GS-NS0 myeloma cells. Biotechnol Bioeng 2007; 96:337-48; PMID:17001634; http://dx.doi.org/ 10.1002/bit.21119 [DOI] [PubMed] [Google Scholar]
- 5. Ng SK, Lin W, Sachdeva R, Wang DI, Yap MG. Vector fragmentation: characterizing vector integrity in transfected clones by Southern blotting. Biotechnol Prog 2010; 26:11-20; PMID:19847885; http://dx.doi.org/ 10.1002/btpr.281 [DOI] [PubMed] [Google Scholar]
- 6. Ho SCL, Bardor M, Feng HT, Mariati, Tong YW, Song Z, Yap MG, Yang Y. IRES-mediated Tricistronic vectors for enhancing generation of high monoclonal antibody expressing CHO cell lines. J Biotechnol 2012; 157:130-9; PMID:22024589; http://dx.doi.org/ 10.1016/j.jbiotec.2011.09.023 [DOI] [PubMed] [Google Scholar]
- 7. Chusainow J, Yang YS, Yeo JH, Toh PC, Asvadi P, Wong NS, Yap MG. A study of monoclonal antibody-producing CHO cell lines: what makes a stable high producer? Biotechnol Bioeng 2009; 102:1182-96; PMID:18979540; http://dx.doi.org/ 10.1002/bit.22158 [DOI] [PubMed] [Google Scholar]
- 8. Lee CJ, Seth G, Tsukuda J, Hamilton RW. A clone screening method using mRNA levels to determine specific productivity and product quality for monoclonal antibodies. Biotechnol Bioeng 2009; 102:1107-18; PMID:18985612; http://dx.doi.org/ 10.1002/bit.22126 [DOI] [PubMed] [Google Scholar]
- 9. Schlatter S, Stansfield SH, Dinnis DM, Racher AJ, Birch JR, James DC. On the optimal ratio of heavy to light chain genes for efficient recombinant antibody production by CHO cells. Biotechnol Prog 2005; 21:122-33; PMID:15903249; http://dx.doi.org/ 10.1021/bp049780w [DOI] [PubMed] [Google Scholar]
- 10. Gonzalez R, Andrews BA, Asenjo JA. Kinetic model of BiP- and PDI-mediated protein folding and assembly. J Theor Biol 2002; 214:529-37; PMID:11851365; http://dx.doi.org/ 10.1006/jtbi.2001.2478 [DOI] [PubMed] [Google Scholar]
- 11. Li JD, Zhang CC, Jostock T, Dubel S. Analysis of IgG heavy chain to light chain ratio with mutant Encephalomyocarditis virus internal ribosome entry site. Protein Eng Des Sel 2007; 20:491-6; PMID:17951613; http://dx.doi.org/ 10.1093/protein/gzm038 [DOI] [PubMed] [Google Scholar]
- 12. Yang YS, Mariati, Ho SCL, Yap MGS. Mutated polyadenylation signals for controlling expression levels of multiple genes in mammalian cells. Biotechnol Bioeng 2009; 102:1152-60; PMID:18973284; http://dx.doi.org/ 10.1002/bit.22152 [DOI] [PubMed] [Google Scholar]
- 13. O'Callaghan PM, McLeod J, Pybus LP, Lovelady CS, Wilkinson SJ, Racher AJ, Porter A, James DC. Cell line-specific control of recombinant monoclonal antibody production by CHO cells. Biotechnol Bioeng 2010; 106:938-51; PMID:20589672; http://dx.doi.org/ 10.1002/bit.22769 [DOI] [PubMed] [Google Scholar]
- 14. Koh EYC, Ho SCL, Mariati, Song ZW, Bi XZ, Bardor M, Yang Y. An internal ribosome entry site (IRES) mutant library for tuning expression level of multiple genes in mammalian cells. Plos One 2013; 8:e82100; PMID:24349195; http://dx.doi.org/ 10.1371/journal.pone.0082100 [DOI] [PMC free article] [PubMed] [Google Scholar]
- 15. Ho SCL, Koh EYC, van Beers M, Mueller M, Wan C, Teo G, Song Z, Tong YW, Bardor M, Yang Y. Control of IgG LC:HC ratio in stably transfected CHO cells and study of the impact on expression, aggregation, glycosylation and conformational stability. J Biotechnol 2013; 165:157-66; PMID:23583871; http://dx.doi.org/ 10.1016/j.jbiotec.2013.03.019 [DOI] [PubMed] [Google Scholar]
- 16. Pybus LP, Dean G, West NR, Smith A, Daramola O, Field R, Wilkinson SJ, James DC. Model-directed engineering of "difficult-to-express'' monoclonal antibody production by chinese hamster ovary cells. Biotechnol Bioeng 2014; 111:372-85; PMID:24081924; http://dx.doi.org/ 10.1002/bit.25116 [DOI] [PubMed] [Google Scholar]
- 17. Pybus LP, James DC, Dean G, Slidel T, Hardman C, Smith A, Daramola O, Field R. Predicting the expression of recombinant monoclonal antibodies in chinese hamster ovary cells based on sequence features of the CDR3 domain. Biotechnol Prog 2014; 30:188-97; PMID:24311306; http://dx.doi.org/ 10.1002/btpr.1839 [DOI] [PubMed] [Google Scholar]
- 18. Ho SCL, Bardor M, Li B, Lee JJ, Song ZW, Tong YW, Goh LT, Yang Y. Comparison of internal ribosome entry site (IRES) and urin-2A (F2A) for onoclonal antibody expression level and quality in CHO cells. Plos One 2013; 8:e63247; PMID:23704898; http://dx.doi.org/ 10.1371/journal.pone.0063247 [DOI] [PMC free article] [PubMed] [Google Scholar]
- 19. Mielke C, Tummler M, Schubeler D, von Hoegen I, Hauser H. Stabilized, long-term expression of heterodimeric proteins from tricistronic mRNA. Gene 2000; 254:1-8; PMID:10974530; http://dx.doi.org/ 10.1016/S0378-1119(00)00294-8 [DOI] [PubMed] [Google Scholar]
- 20. Hennecke M, Kwissa M, Metzger K, Oumard A, Kroger A, Schirmbeck R, Reimann J, Hauser H. Composition and arrangement of genes define the strength of IRES-driven translation in bicistronic mRNAs. Nucleic Acids Res 2001; 29:3327-34; PMID:11504870; http://dx.doi.org/ 10.1093/nar/29.16.3327 [DOI] [PMC free article] [PubMed] [Google Scholar]
- 21. Fang J, Qian JJ, Yi S, Harding TC, Tu GH, VanRoey M, Jooss K. Stable antibody expression at therapeutic levels using the 2A peptide. Nat Biotechnol 2005; 23:584-90; PMID:15834403; http://dx.doi.org/ 10.1038/nbt1087 [DOI] [PubMed] [Google Scholar]
- 22. Li J, Menzel C, Meier D, Zhang C, Dubel S, Jostock T. A comparative study of different vector designs for the mammalian expression of recombinant IgG antibodies. J Immunol Methods 2007; 318:113-24; PMID:17161420; http://dx.doi.org/ 10.1016/j.jim.2006.10.010 [DOI] [PubMed] [Google Scholar]
- 23. de Felipe P, Luke GA, Hughes LE, Gani D, Halpin C, Ryan MD. E unum pluribus: multiple proteins from a self-processing polyprotein. Trends Biotechnol 2006; 24:68-75; PMID:16380176; http://dx.doi.org/ 10.1016/j.tibtech.2005.12.006 [DOI] [PubMed] [Google Scholar]
- 24. Doronina VA, de Felipe P, Wu C, Sharma P, Sachs MS, Ryan MD, Brown JD. Dissection of a co-translational nascent chain separation event. Biochem Soc Trans 2008; 36:712-6; PMID:18631146; http://dx.doi.org/ 10.1042/BST0360712 [DOI] [PubMed] [Google Scholar]
- 25. Doronina VA, Wu C, De Felipe P, Sachs MS, Ryan MD, Brown JD. Site-specific release of nascent chains from ribosomes at a sense codon. Mol Cell Biol 2008; 28:4227-39; PMID:18458056; http://dx.doi.org/ 10.1128/MCB.00421-08 [DOI] [PMC free article] [PubMed] [Google Scholar]
- 26. Sharma P, Yan F, Doronina VA, Escuin-Ordinas H, Ryan MD, Brown JD. 2A peptides provide distinct solutions to driving stop-carry on translational recoding. Nucleic Acids Res 2012; 40:3143-51; PMID:22140113; http://dx.doi.org/ 10.1093/nar/gkr1176 [DOI] [PMC free article] [PubMed] [Google Scholar]
- 27. Davies SL, O'Callaghan PM, McLeod J, Pybus LP, Sung YH, Rance J, Wilkinson SJ, Racher AJ, Young RJ, James DC. Impact of gene vector design on the control of recombinant monoclonal antibody production by chinese hamster ovary cells. Biotechnol Prog 2011; 27:1689-99; PMID:21882365; http://dx.doi.org/ 10.1002/btpr.692 [DOI] [PubMed] [Google Scholar]
- 28. Fang J, Yi S, Simmons A, Tu GH, Nguyen M, Harding TC, VanRoey M, Jooss K. An antibody delivery system for regulated expression of therapeutic levels of monoclonal antibodies in vivo. Mol Ther 2007; 15:1153-9; PMID:17375065 [DOI] [PubMed] [Google Scholar]
- 29. Jostock T, Dragic Z, Fang J, Jooss K, Wilms B, Knopf HP. Combination of the 2A/furin technology with an animal component free cell line development platform process. Appl Microbiol Biotechnol 2010; 87:1517-24; PMID:20461511; http://dx.doi.org/ 10.1007/s00253-010-2625-0 [DOI] [PubMed] [Google Scholar]
- 30. Li M, Wu YM, Qiu YH, Yao ZY, Liu SL, Liu YX, Shi J, Zheng D. 2A Peptide-based, Lentivirus-mediated Anti-death Receptor 5 Chimeric Antibody Expression Prevents Tumor Growth in Nude Mice. Mol Ther 2012; 20:46-53; PMID:21934654; http://dx.doi.org/ 10.1038/mt.2011.197 [DOI] [PMC free article] [PubMed] [Google Scholar]
- 31. Simmons AD, Moskalenko M, Creson J, Fang JM, Yi SL, VanRoey MJ, Allison JP, Jooss K. Local secretion of anti-CTLA-4 enhances the therapeutic efficacy of a cancer immunotherapy with reduced evidence of systemic autoimmunity. Cancer Immunol Immunother 2008; 57:1263-70; PMID:18236040; http://dx.doi.org/ 10.1007/s00262-008-0451-3 [DOI] [PMC free article] [PubMed] [Google Scholar]
- 32. Kim JH, Lee SR, Li LH, Park HJ, Park JH, Lee KY, Kim MK, Shin BA, Choi SY. High cleavage efficiency of a 2A peptide derived from porcine teschovirus-1 in human cell lines, zebrafish and mice. Plos One 2011; 6:e18556; PMID:21602908; http://dx.doi.org/ 10.1371/journal.pone.0018556 [DOI] [PMC free article] [PubMed] [Google Scholar]
- 33. Donnelly MLL, Hughes LE, Luke G, Mendoza H, ten Dam E, Gani D, Ryan MD. The 'cleavage' activities of foot-and-mouth disease virus 2A site-directed mutants and naturally occurring '2A-like' sequences. J Gen Virol 2001; 82:1027-41; PMID:11297677 [DOI] [PubMed] [Google Scholar]
- 34. Szymczak AL, Workman CJ, Wang Y, Vignali KM, Dilioglou S, Vanin EF, Vignali DA. Correction of multi-gene deficiency in vivo using a single 'self-cleaving' 2A peptide-based retroviral vector. Nat Biotechnol 2004; 22:589-94; PMID:15064769; http://dx.doi.org/ 10.1038/nbt957 [DOI] [PubMed] [Google Scholar]
- 35. De Felipe P, Luke GA, Brown JD, Ryan MD. Inhibition of 2A-mediated 'cleavage' of certain artificial polyproteins bearing N-terminal signal sequences. Biotechnol J 2010; 5:213-23; PMID:19946875; http://dx.doi.org/ 10.1002/biot.200900134 [DOI] [PMC free article] [PubMed] [Google Scholar]
- 36. Anderson RP, Voziyanova E, Voziyanov Y. Flp and Cre expressed from Flp-2A-Cre and Flp-IRES-Cre transcription units mediate the highest level of dual recombinase-mediated cassette exchange. Nucleic Acids Res 2012; 40:e62; PMID:22270085; http://dx.doi.org/ 10.1093/nar/gks027 [DOI] [PMC free article] [PubMed] [Google Scholar]
- 37. Minskaia E, Nicholson J, Ryan MD. Optimisation of the foot-and-mouth disease virus 2A co-expression system for biomedical applications. BMC Biotechnol 2013; 13:67; PMID:23968294; http://dx.doi.org/ 10.1186/1472-6750-13-67 [DOI] [PMC free article] [PubMed] [Google Scholar]
- 38. Minskaia E, Ryan MD. Protein coexpression using FMDV 2A: effect of "linker" residues. Biomed Res Int 2013; 2013:291730; PMID:23878801; 10.1155/2013/291730 [DOI] [PMC free article] [PubMed] [Google Scholar]
- 39. Yang S, Cohen CJ, Peng PD, Zhao Y, Cassard L, Yu Z, Zheng Z, Jones S, Restifo NP, Rosenberg SA, et al. Development of optimal bicistronic lentiviral vectors facilitates high-level TCR gene expression and robust tumor cell recognition. Gene Ther 2008; 15:1411-23; PMID:18496571; http://dx.doi.org/ 10.1038/gt.2008.90 [DOI] [PMC free article] [PubMed] [Google Scholar]
- 40. Tan YP, Liang HR, Chen AE, Guo XF. Coexpression of double or triple copies of the rabies virus glycoprotein gene using a 'self-cleaving' 2A peptide-based replication-defective human adenovirus serotype 5 vector. Biologicals 2010; 38:586-93; PMID:20682459; http://dx.doi.org/ 10.1016/j.biologicals.2010.06.001 [DOI] [PubMed] [Google Scholar]
- 41. Gan HT, Lee J, Latiff SMA, Chuah C, Toh P, Lee WY, Gagnon P. Characterization and removal of aggregates formed by nonspecific interaction of IgM monoclonal antibodies with chromatin catabolites during cell culture production. J Chromatogr A 2013; 1291:33-40; PMID:23598159; http://dx.doi.org/ 10.1016/j.chroma.2013.03.028 [DOI] [PubMed] [Google Scholar]
- 42. Gagnon P, Nian R, Lee J, Tan L, Latiff SMA, Lim CL, Chuah C, Bi X, Yang Y, Zhang W, et al. Nonspecific interactions of chromatin with immunoglobulin G and protein A, and their impact on purification performance. J Chromatogr A 2014; 1340:68-78; PMID:24661871; http://dx.doi.org/ 10.1016/j.chroma.2014.03.010 [DOI] [PubMed] [Google Scholar]
- 43. Izidoro MA, Gouvea IE, Santos JAN, Assis DM, Oliveira V, Judice WAS, Juliano MA, Lindberg I, Juliano L. A study of human furin specificity using synthetic peptides derived from natural substrates, and effects of potassium ions. Arch Biochem Biophys 2009; 487:105-14; PMID:19477160; http://dx.doi.org/ 10.1016/j.abb.2009.05.013 [DOI] [PMC free article] [PubMed] [Google Scholar]
- 44. Vandeven WJM, Voorberg J, Fontijn R, Pannekoek H, Vandenouweland AMW, Vanduijnhoven HLP, Roebroek AJ, Siezen RJ. Furin is a subtilisin-like proprotein processing enzyme in higher eukaryotes. Mol Biol Rep 1990; 14:265-75; PMID:2094803; http://dx.doi.org/ 10.1007/BF00429896 [DOI] [PubMed] [Google Scholar]