Abstract
High titer (>10 g/L) monoclonal antibody (mAb) cell culture processes are typically achieved by maintaining high viable cell densities over longer culture durations. A corresponding increase in the solids and sub-micron cellular debris particle levels are also observed. This higher burden of solids (≥15%) and sub-micron particles typically exceeds the capabilities of a continuous centrifuge to effectively remove the solids without a substantial loss of product and/or the capacity of the harvest filtration train (depth filter followed by membrane filter) used to clarify the centrate. We discuss here the use of a novel and simple two-polymer flocculation method used to harvest mAb from high cell mass cell culture processes. The addition of the polycationic polymer, poly diallyldimethylammonium chloride (PDADMAC) to the cell culture broth flocculates negatively-charged cells and cellular debris via an ionic interaction mechanism. Incorporation of a non-ionic polymer such as polyethylene glycol (PEG) into the PDADMAC flocculation results in larger flocculated particles with faster settling rate compared to PDADMAC-only flocculation. PDADMAC also flocculates the negatively-charged sub-micron particles to produce a feed stream with a significantly higher harvest filter train throughput compared to a typical centrifuged harvest feed stream. Cell culture process variability such as lactate production, cellular debris and cellular densities were investigated to determine the effect on flocculation. Since PDADMAC is cytotoxic, purification process clearance and toxicity assessment were performed.
Keywords: monoclonal antibody, polycationic flocculation harvest, mammalian cell culture, reagent clearance, cytotoxicity, in-vitro hemolysis, in-vivo rodent toxicity
Abbreviations
- mAb
monoclonal antibody
- PCV
packed cell volume
- PDADMAC
poly diallyldimethylammonium chloride
- DADMAC
diallyldimethylammonium chloride
- PEG
polyethylene glycol
- PBS
phosphate buffered saline
- VCD
viable cell density
- TC
total cells
- CCF
clarified centrifuged cell culture fluid
- RBC
red blood cells
- CHO
Chinese hamster ovary
- QPCR
quantitative polymerase chain reaction
- FBRM
focused beam reflectance measurement
- HI
hemolytic index
- rcf
relative centrifugal force
- NTU
Nephelometric Turbidity Unit
- MW
molecular weight
- w/v
weight to volume
- particles/s
particles per second
- IV
intravenous
- n-aPA
neutralized acidified Protein A pool
- HCP
host cell proteins
- MF
microfiltration
- DF
diafiltration volume
Introduction
Mammalian cell culture harvest processes are typically composed of a primary recovery operation that removes the larger particle solids followed by a secondary recovery operation that removes the smaller particle components that foul the subsequent membrane filtration or purification column steps. The solids produced in a cell culture process comprise a wide particle size range, and consist of viable and non-viable cells, cellular debris, colloids, and insoluble media components.1 Typically, the larger solids containing cells and large cellular debris are removed by continuous centrifugation or by microfiltration (MF), and the smaller sub-micron particles are removed by a two-stage filtration train consisting of a depth filter followed by a membrane filter (Fig. 1).2 Of the two bulk solid separation methods, centrifugation has become the primary recovery method due to the advent of low shear disk stack centrifuges that result in lower operating costs and more robust processes compared to MF.2,3
Figure 1.
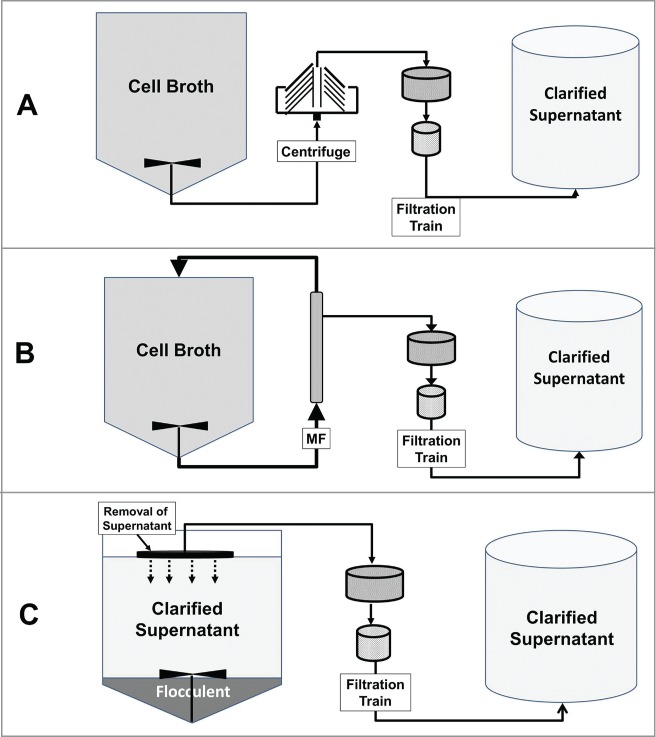
Typical harvest process flow diagram for a (A) continuous centrifuge harvest process, (B) MF harvest process, and (C) a flocculation harvest process. The harvested clarified supernatant is processed further by the downstream purification process to produce drug substance (not shown). A flocculation harvest processing involves: 1) flocculant addition and mixing, 2) flocculent settling, 3) clarified supernatant removal, and 4) a two-stage filtration train to prevent flocculent contamination of the harvested supernatant and clear cytotoxic flocculant from the process stream. A typical MF harvest process is performed by limiting the permeate flux in a trans-flow filtration mode to minimize filter fouling. A low shear disk stack centrifuge is routinely used to harvest mammalian cells.
Recently, a number of biopharmaceutical manufacturers have demonstrated cell culture processes that produce mAb titers as high as 25 g/L, accomplished by increasing or maintaining the viable cell density (VCD) over a longer duration.4,5 High VCD generally corresponds to higher packed cell volumes (PCV) or solids level that range from 15 to 40%.4 These high solids level easily exceed the capacity of a disk stack centrifuge to adequately clarify the cell broth containing 10–12% solids without a significant loss of product.2 Along with the high VCD, the level of non-viable cells and sub-micron cellular debris produced in these higher titer cell culture processes is significantly higher than a typical cell culture process.1 This sub-micron cellular debris is not removed by a disk stack centrifuge, and results in the fouling of the MF or the downstream harvest filtration train.1-3,6,7 Thus, the limitations of the disk stack centrifuge or MF methods are apparent with high VCD cell culture processes.
Since cells and cellular debris have a slightly negative charge in cell broth,8 one harvest strategy is to flocculate with a polycationic polymer. Polycationic polymers bind the negatively-charged cells and cellular debris leading to the formation of larger particles that easily settled out or removed by centrifugation. A number of polycationic polymers have been used to flocculate cells, including polyethyleneimine, poly (diallyldimethylammonium chloride) or PDADMAC, chitosan, polycationic polyacrylamides, and partially benzylated poly(allylamine), e.g., smart Polymer E.7–13
PDADMAC has several advantages over the other polycationic polymers that have been used to clarify cell broth. In contrast to some of the other polycationic polymers, PDADMAC is supplied as a chloride salt solution and requires no sample conditioning prior to use. PDADMAC flocculation of cells can be explained by the patch/neutralization model and the mechanism is solely based on electrostatic interaction.12 In comparison, chitosan and the polycationic polyacrylamides flocculate is explained by the bridging model which involves a multitude of interactions that include electrostatic, hydrophobic, or hydrogen bonding.10,12 Flocculent particles produced by the patch/neutralization flocculation model are more resistant to shear fragmentation compared to flocculent particles produced by bridging.12 Shear resistant flocculent particles are desirable from a commercial manufacturing standpoint because it is known that shear forces due to high mixing rates or prolonged mixing during the addition of the flocculant into the cell culture broth may inhibit flocculent growth or fragment the flocculent producing smaller and slower settling flocculent particles.14
The choice of flocculant used in this study, PDADMAC, has been approved by the Food and Drug Administration for use as an antimicrobial agent in wound dressing for humans.15 The synthesis of PDADMAC from the monomer, DADMAC, produces a linear polymer with a wide molecular weight (MW) range from monomer to a multimeric polymer.16 Commercially produced PDADMAC can be obtained with different average MW ranges and different MW distributions within the average MW range. PDADMAC is also widely used in the treatment of potable water or waste water from mine tailing ponds around the world, and it is manufactured in large quantities.17 As such, regulatory agencies have established permissible residual levels for PDADMAC used in potable water or waste water treatment.12,17
Similar to other polycationic polymers used to flocculate cells, PDADMAC is known to be cytotoxic in vitro.8,18 However, no in vivo data were found in the examined literature. PDADMAC cytotoxicity increases with an increase in polymer dose and MW.19 Thus, the removal of the polycation polymer from the process stream must be demonstrated by subsequent process operations to ensure clinical safety of the drug. This is a daunting task since methods that detect and quantify PDADMAC are applied to potable water and not to complex solutions like cell culture broth or process intermediates.
In this study we demonstrate that PDADMAC binds to negatively-charged Chinese hamster ovary (CHO) cells (both viable and non-viable cells) and cellular debris to form large flocculated particles that settle out with gravity and produce cell culture fluid that is substantially free of harvest filtration fouling agents. Biomass levels at the end of cell culture production, as well as cellular stresses such as lactate production, are shown to affect flocculent settling rate: low settling rates can be improved with the addition of a non-ionic polymer. Since polycations are known to be cytotoxic by disruption of the cellular membrane,18 clearance of PDADMAC by the subsequent mAb purification process steps was monitored. To further evaluate the safety of PDADMAC used in the production of a biotherapeutic, a red blood cell hemolysis assay and in vivo rodent studies were performed.
Results
Cell broth contains a wide distribution of particle sizes, varying from whole cells to sub-micron cellular debris and metabolites, each with a different settling rate in the absence of flocculating agents. A polycationic flocculating agent, such as PDADMAC, binds to cells and cellular debris resulting in the formation of large flocculated particles that rapidly settle by gravity. As shown in Fig. 2, this produces a supernatant that has a considerably higher filter throughput compared to the non-flocculated centrifuged clarified supernatant. The clarity of the flocculated supernatant is comparable to harvest material that has been processed by centrifugation followed by depth filtration and membrane filtration, 20 to 40 Nephelometric Turbidity Units (NTU).
Figure 2.
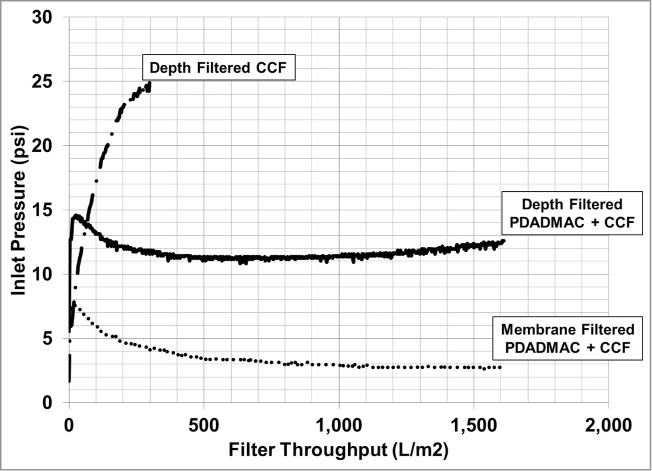
Harvest filtration throughput for cell broth clarified by centrifugation (CCF) or by PDADMAC flocculation (PDADMAC + CCF). Centrifuged cell broth throughput for a membrane filter was not tested.
Flocculation and its settling are dependent on many known variables, including the polycationic polymer chemistry, MW, flocculant dose, as well as the cell culture process performance such as cell/cellular debris level and cell surface charge density.4,7–12 Also, product recovery for a harvest method utilizing flocculation will be dependent on the volume of cell culture fluid (CCF) recovered and any potential interaction of the product with the flocculent (flocculated cell/cellular debris particle) or the polycationic polymer. The parameters investigated in the development of a CHO cell culture PDADMAC flocculation harvest method are discussed in the following sections.
PDADMAC Flocculation of CHO Cell Broth
Effect of PDADMAC average MW on flocculation
As mentioned previously, the PDADMAC average MW and distribution is a known variable that affects the flocculation process. Four average MW ranges were tested and compared to assess the time needed for cell settling, supernatant clarity, the dosing requirement for effective settling, and the robustness of settling as a function of dose variations.
PDADMAC flocculation using an average polymer MW range of 400–500 kDa consistently resulted in the shortest flocculent setting time with the widest dose range that provided consistent flocculent settling compared to flocculation with a lower polymer average MW range (Fig. 3). PDADMAC flocculation with an average polymer MW range below 200 kDa required a significantly longer settling time at a higher flocculant dose to achieve a comparable harvest recovery volume compared to PDADMAC flocculation with an average polymer MW of greater than 200 to 350 kDa. Additionally, the best optical clarity, 30 NTU, was achieved with the highest average polymer MW compared to the lower average MW clarity of 220 NTU (Fig. 4). Based on the wide flocculant dosing range and robustness of the flocculation performance (clarity and flocculent settling rate), the PDADMAC polymer with the highest average MW range, 400 to 500kDa, was chosen for future work.
Figure 3.

Flocculated cell mass settling rate for PDADMAC with an average MW of 400 to 500 kDa, 200 to 350 kDa, and 100 to 200 kDa. Flocculate dosing based on (w/v). Shown in all the figures is the (w/v) PDADMAC dose at 0.04% [♦], 0.06% [▪], 0.08% [▴], and 0.10% [•].
Figure 4.
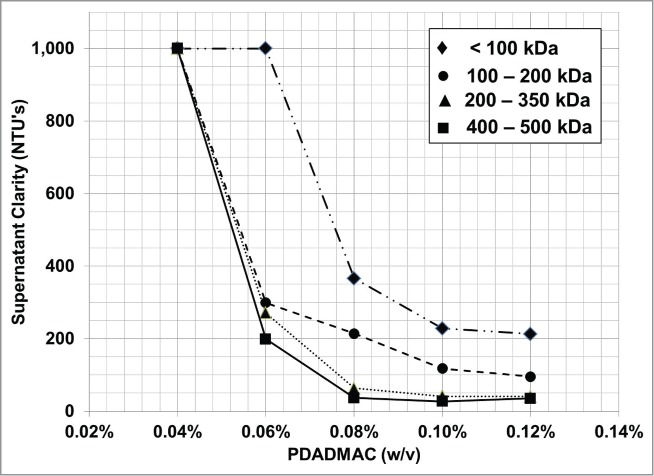
Supernatant clarity after flocculation with increasing average MW PDADMAC. The average polymer MW is shown in the legend.
PDADMAC dosing
Previous investigators based the flocculant dose on the mass of polymer per volume of cell broth (w/v).4,7–12 Since PDADMAC binds to the negatively-charged cells (both viable and non-viable cells) and cellular debris in the cell culture broth, a high cell density cell culture process requires a larger flocculation dose per volume compared to a lower cell density culture process to achieve the optimum flocculation performance (clarity, product recovery, and settling period). To account for cell culture process variability from process to process and run-to-run, a dosing regimen based on the cellular mass is desired.
The amount of cellular material is commonly determined by the solids level and the concentration of viable and non-viable cells. The amount of solids is measured by the volume of packed cells (PCV) after centrifugation. The total cells, viable and non-viable cells densities are measured by the trypan blue exclusion method and routinely determined using an automated cell counter on a daily basis. While the measurement of the total number of cells correlates to the solids level, the solid volume is a function of the cell size and large (<1 μm) cellular debris particles. The trypan blue exclusion method measures the total number of cells, both viable and non-viable, per area and is independent of the cellular volume.
Three different methods were tested to calculate the effective PDADMAC dose that achieved the highest recovery of clarified fluid in 2 hours for cell broth containing a wide range of solids (10% to 25%). Three dosing methods were tested: 1) pg per total number of cells (includes both viable and non-viable cells), 2) mg per L of solids, and 3) g per L of cell broth. PDADMAC dosing based on the total cell number (TC) was constant for all conditions tested and a dose of 45 pg of PDADMAC per total cell (pg/TC) provided consistent flocculation performance (Table 1). In comparison, PDADMAC dosing based on solids or the cell broth volume was dependent on the cellular mass generated. The optimal flocculant dose increased from 5.6 to 7.9 mg of PDADMAC per L of solids and 0.6 to 1.8 g of PDADMAC per L of cell broth (Table 1). Because of the insensitivity to the varying levels of cell culture process solids and duration, PDADMAC dosing based on total cells is the flocculant dosing method for future studies.
Table 1.
PDADMAC dose required for optimal flocculation performance at varying solids content in the cell broth. Cell broth was diluted with cell culture media to adjust the solids content. Optimal flocculation performance is the combination of the shortest flocculent settling period and with an optical clarity of less than 40 NTU
| Normalized Flocculent Dosing To: |
||||
|---|---|---|---|---|
| Solids | Flocculent Dose (g/L) | Volume (g/L Cell Broth) | Solids (mg/L Solids) | Total Cells (pg/TC) |
| 10.8% | 0.6 | 0.6 | 5.6 | 48.5 |
| 16.1% | 1.0 | 1.0 | 6.2 | 43.6 |
| 20.5% | 1.3 | 1.3 | 6.3 | 44.2 |
| 25.4% | 1.8 | 1.8 | 7.9 | 43.5 |
| Mean Dose | 1.2 | 6.5 | 45.0 | |
| % sM | ± 68.5% | ± 24.1% | ± 8.4% | |
The limitation of dosing based on total cells is that it does not account for negatively-charged sub-micron cellular debris that will bind to PDADMAC. This limitation also applies to the solids- and volume-based flocculant dosing methods. The flocculant dosing method used in this study assumes that the ratio of sub-micron cellular debris to total cells is constant or similar throughout the cell culture process, and from run-to-run that would result in minor variations in the harvested recovery.
PDADMAC dosing is also dependent on the cell's chromosome sets (polyploidy) or the cell size. We have observed that large tetraploid-like CHO cells with a diameter of 22–24 μm, require approximately double the dose of PDADMAC compared to smaller diploid-like CHO cells with a diameter of 15–18 μm, 45 and 25 pg/TC respectively. The dosing difference can be attributed to the difference in the total charge density of the cell, since PDADMAC dosing based on TC is a constant. As the flocculant dosing is likely dependent on cell type and cell size, it is recommended that a dosing study be performed during the development of the flocculation process.
Cell Culture Process Parameters Affecting Flocculent Settling Rate
Effect of cell density on flocculent settling and product recovery
Figure 5 shows that the flocculent settling rate is dependent on the solids level. As the flocculent settles, a decrease in settling rate with time is observed due to the electrostatic repulsion forces, that prevent flocculent settling, overcomes the van der Waals attraction forces that result in flocculent settling.20 Thus, cell culture processes that generate high solid levels, or cell densities, will have a slower flocculent settling rate and require a longer period to achieve the steady-state settling (the point where no flocculent settling occurs).
Figure 5.
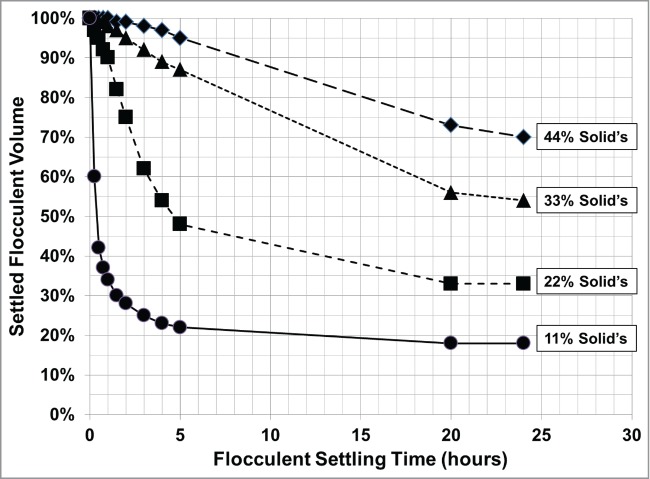
PDADMAC-only flocculent settling profile of cell broth containing increasing concentration of solids per volume of fluid. Varying cell broth solids level was achieved by diluting with cell culture media. All conditions dosed at 45 pg/TC.
As the flocculent settles, a corresponding decrease in the percentage of entrapped supernatant in the settling flocculent occurs and reaches its minimum at steady-state. Unless there is product loss due to product-flocculant interaction or phase separation during the flocculation, this entrapped supernatant contains product that can be recovered. Therefore, it is desirable that the flocculation harvest process achieves a steady-state flocculent settling and produces a dry settled flocculent, with a minimal amount of volume of supernatant entrapped in the flocculent, VE, to maximize the recovery of supernatant and hence the product.
Using Figure 5, the average VE was 38%, ranging from 36% to 40% for all the solid levels tested after flocculent settling for 24 hours, using the equation described in the Materials and Methods Cell Broth Flocculation section. Based on the amount of recoverable entrapped supernatant at steady-state, the effect of cell broth dilutions on the product recovery and the harvest volume can be calculated.
Knowing the settled flocculent liquid content, VE, the steady-state flocculent volume, harvest volume, and product recovery can be calculated with respect to the cell broth solids level using the modeling equations described in the Materials and Methods Cell Broth Flocculation and Modeling the Flocculent Steady-state Settled Volume sections. Using Figure 5 solids level and average VE, the model calculated the predicted steady-state settled flocculent volume, harvest volume, and product recovery with respect to diluting the cell broth solids. The model's predictions were compared to the experimental results [Table 2].
Table 2.
Increasing dilution of cell broth starting at 44% solids, increases product recovery and harvested volume. The modeled recovery and volume was based on the % VE at the flocculent steady state for a PDADMAC-only flocculation in Figure 5, and compared to the experimental results. All harvested volumes are relative to the bioreactor working volume. Experimental product recovery and harvest volume not determined (ND) at a solid level of 11% and 33%
| Settled Flocculent Volume |
Harvest Volume |
Product Recovery |
||||
|---|---|---|---|---|---|---|
| Solids | Predicted | Experimental | Predicted | Experimental | Predicted | Experimental |
| 44% | 71% | 71% | 0.39 | 0.38 | 70% | 67% |
| 33% | 55% | 55% | 0.73 | ND | 81% | ND |
| 22% | 36% | 36% | 1.39 | 1.32 | 89% | 84% |
| 11% | 18% | 18% | 3.39 | ND | 95% | ND |
As the solids concentration decreases with increasing dilution, the model predicts that the level of product recovery increases from 70% to 95% along with a corresponding increase in the harvest volume from 0.39 to 3.39 bioreactor volumes [Table 2]. The experimental results show similar increases in recovery and harvest volume as the modeling, but were slightly lower than the modeled calculation for recovery and harvest pool volume. This difference is due to an inability to completely recover the clarified supernatant by decanting without disturbing the settled flocculent, resulting in the carryover of flocculent into the clarified supernatant.
An equal volume of re-suspension wash can recover product entrained in the settled flocculent. Using the same model described above, modeling the re-suspension wash recovery predicts that the overall harvest recovery increases by 4.6% with a corresponding increase in the harvest volume of 0.4 bioreactor volumes over the initial or primary PDADMAC flocculent settling harvest product and volume recovery. In practice, the settling times required for the re-suspension are significantly longer (additional 16 hours and longer) compared to the primary settling time due to the mixing required to re-suspend the settled flocculent. The shear forces required for settled flocculent re-suspension break the large flocculents into smaller floccules that take significantly longer to settle. Maximizing product recovery thus requires a re-suspension wash step but at the expense of increasing the harvesting duration. Such an equal volume re-suspension wash results in a slightly smaller harvest volume compared to diluting with an equal volume of cell broth prior to PDADMAC flocculation.
Effect of sub-micron cellular debris particles PDADMAC dosing
A cell culture process continuously generates sub-micron cellular debris. This cellular debris is generated by the degradation of non-viable cells to smaller debris, and is accelerated by mechanical shear forces generated in the bioreactor, such as mixing, pumping, or the bursting of air bubbles during sparging. This sub-micron cellular debris is expected to have the same negative charge as the larger viable and non-viable cells, and flocculate upon the addition of PDADMAC. At high enough levels, this smaller cellular debris could affect the PDADMAC dose required for optimum performance.
To understand the effect of sub-micron cellular debris on flocculation, cell broth was subjected to a short burst of high shear forces sufficient to fragment cells into smaller cellular debris. Disruption of the cells resulted in an increase in the centrifuged-clarified supernatant turbidity from 250 NTU to greater than 1,000 NTU. The sub-10 μm particle level, the sum total of all particles from 0.8 to 10 μm as measured by FBRM, increased by the same magnitude, i.e., from 24 to 88 particles/s. The addition of PDADMAC to the centrifuge-clarified sheared and non-sheared cell broth dramatically increased the level of sub-10 μm particles greater than 2 logs for both, from 24 to 3,340 particles/s for non-sheared cell broth and 88 to 28,117 particles/s for sheared cell broth. Thus, it can be concluded that a typical cell culture process contains particles that are below the FBRM's detection limit of 0.8 μm and PDADMAC flocculates these sub-micron cell debris particles to form larger FBRM-detectable flocculated particles. The removal of these sub-micron particles significantly improves depth filtration (Fig. 2). It has been shown previously that the removal of these sub-micron particles improves membrane filtration throughput at least 6-fold.2,21
Flocculation of the sheared cell broth, which had approximately 10 times the amount of sub-micron particles as the non-sheared cell broth, required a 2-fold increase in the PDADMAC dose to achieve a similar settled flocculent volume in 2 hours compared to flocculation of non-sheared cell broth (Fig. 6). Also, the generation of sub-micron cellular debris by shear resulted in a slightly slower settling rate and a slightly larger settled flocculent volume compared to the cell broth with lower levels of sub-micron cellular debris (comparison of the 60 pg/TC dose settling curves in Fig. 6, Non-Sheared and Sheared).
Figure 6.
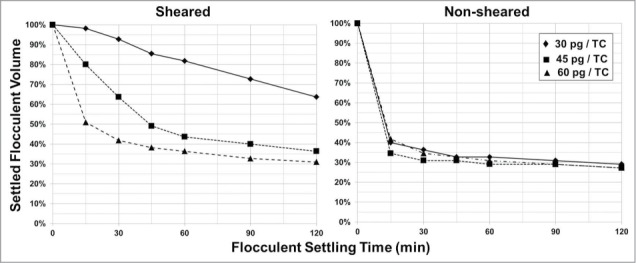
PDADMAC / PEG flocculation of cell broth non-sheared and sheared. Shown in both figures is the PDADMAC dose at 30 pg/TC [♦], 45 pg/TC [▪], and 60 pg/TC [▴]. PEG 3,000 concentration was 3% (w/v).
Cell metabolites
Certain media components (e.g., salts) and other ionic cell metabolites (e.g., lactate) can disrupt the electrostatic interaction between cells and cellular debris with PDADMAC. This will result in the degradation of flocculation performance by limiting the flocculent growth or preventing the flocculent formation. Lactate is commonly produced by cells during the cell culture process. To decouple the effect of lactate production in a cell culture process from other variables that potentially can affect the settling rate of the flocculated biomass, lactate was spiked into broth from a cell culture process that produced less than 0.1 g/L of lactate. Lactate levels as low as 3 g/L decreased the flocculent settling rate and required a significantly longer processing time to achieve the same settled volume as non-spiked flocculated cell broth (Fig. 7).
Figure 7.
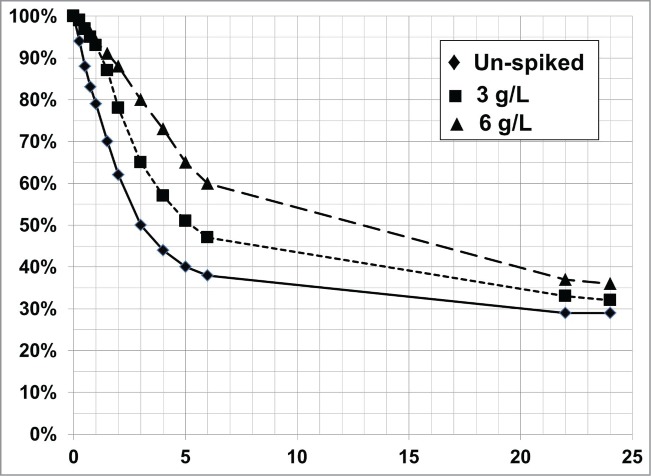
Lactate addition to cell broth decreases the PDADMAC-only flocculent settling rate compared to the un-spiked cell broth [♦]. Lactate was spiked into cell broth at 3 g/L [▪] and 6 g/L [▴].
Effect of Non-Ionic Additives to PDADMAC Flocculation
Non-ionic polymers
The addition of non-ionic polymers (e.g., PEG, dextran) into the PDADMAC flocculation is shown to accelerate flocculent settling relative to the addition of smaller non-ionic compounds such as sucrose or zwitterionic compounds such as betaine (Fig. 8). This improved flocculent settling rate was accomplished by increasing the flocculent size. The average flocculent size measured by FBRM for a PDADMAC only flocculent was 25 μm and 87 μm for a PEG plus PDADMAC flocculent. The mechanism of increasing the flocculent size in a non-ionic polymer/PDADMAC flocculation reaction is by depletion forces, where the non-ionic polymer concentrates the flocculated cells and cellular debris by volume exclusion and PDADMAC neutralizes the negative charge found on the cells and cellular debris, allowing for the formation of large flocculated particles that settle rapidly.22
Figure 8.
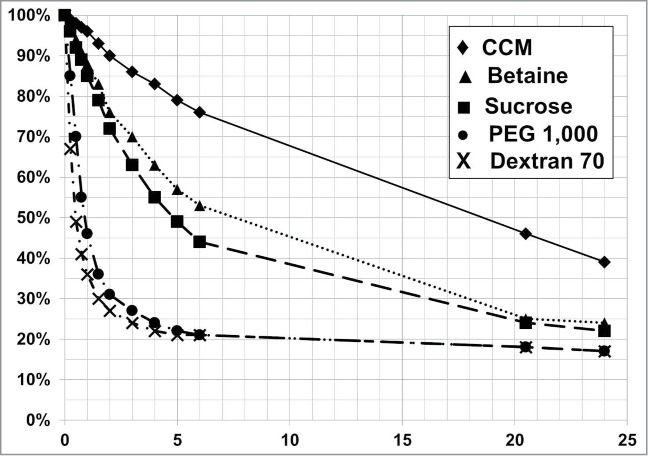
PDADMAC flocculent settling profile for cell broth diluted with different diluents. Cell broth was diluted to 33% with cell culture media (CCM) [♦], 9% (w/v) sucrose [▪], 32 g/L betaine [▴], 10% (w/v) dextran 70 with 30 g/L betaine [•], and 14.6% (w/v) PEG 1,000 [X]. Diluents' stock concentration was based on an osmolality of 300 mOsmo/kg. The lactate concentration at the end of cell culture production was 9 g/L.
Flocculation with PDADMAC in combination with the non-ionic polymers dextran and PEG significantly decreases the flocculent settling times for a cell culture processes that generate high levels of lactate, 9 g/L (Fig. 8). The flocculent settling rate is dependent on the solids level, PEG concentration, and PDADMAC concentration (Figs. 9 and 10). The flocculent settling rate is not dependent on the non-ionic polymer's MW, but on the non-ionic polymers cell broth concentration for optimal flocculent settling (Figs. 8 and 10). The addition of non-ionic polymer, PEG, without PDADMAC is detrimental to the biomass settling rate compared to the settling profile of the PDADMAC-only treated cell broth (Fig. 9). Thus, the combination of PDADMAC flocculating agent and a non-ionic polymer is required to accelerate the flocculated cell mass settling rate.
Figure 9.
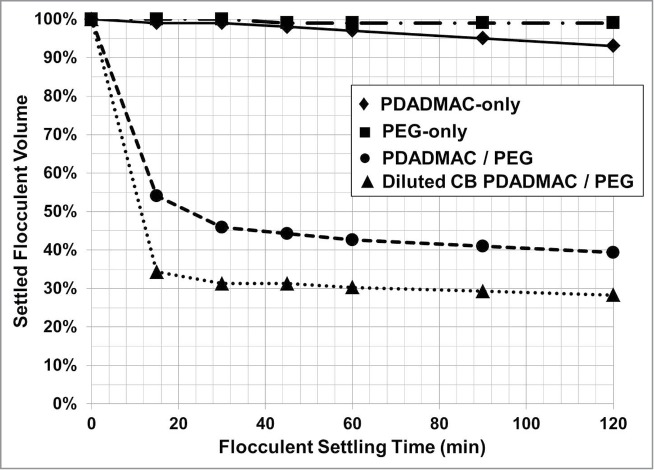
The effect of PEG 3,000 on the flocculent settling profile for cell broth containing 32% solids. Flocculation was performed with PDADMAC only [♦], PEG only [▪], PDADMAC/PEG [•] and cell broth diluted 33% with cell culture media (final solids of 20%) prior to PDADMAC/PEG flocculation [▴]. Final cell broth concentration of PEG was 3% (w/v) and PDADMAC dose was 25 pg/TC.
Figure 10.
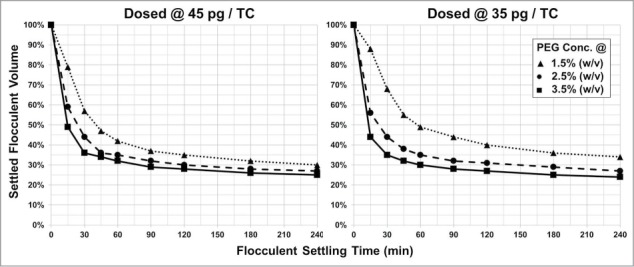
Increasing PEG and PDADMAC concentration decreases flocculent settling time. PDADMAC dosing concentration is 45 pg/TC and 35 pg/TC. Shown in both figures is the final cell broth PEG 6,000 concentration at 1.5% (w/v) [▴], 2.5% (w/v) [•], and 3.5% (w/v) [▪].
mAb solubility in cell broth with PEG
By increasing concentration of PEG in conjunction with higher PDADMAC dosing, the flocculated biomass settled at a quicker rate and to a smaller volume (Fig. 10). PEG, however, is known to precipitate proteins, including mAbs.23 Thus, there is likely an upper PEG concentration boundary that will enhance PDADMAC flocculent settling without precipitation of the mAb from the cell broth.
To decouple product loss due to flocculation with PDADMAC from product loss by PEG precipitation or co-precipitation with cellular debris, cell broth with and without PDADMAC was clarified by centrifugation followed by PEG addition. For this mAb, the control showed that the titer was equivalent for cell broth flocculated with only PDADMAC followed by centrifuge clarification and non-PDADMAC centrifuge-clarified fluid. For non-PDADMAC clarified fluid treated with PEG 6,000, mAb loss was observed for all PEG concentrations tested (Fig. 11). In comparison, there was no product loss from the clarified PDADMAC cell culture fluid until the concentration was greater than 3.5% (w/v) (Fig. 11). These results suggest that mAb co-precipitates with sub-micron cellular debris or an intracellular component(s) in the presence of PEG. This co-precipitation of mAb was prevented by the addition of PDADMAC to the cell broth prior to the addition of PEG by either the flocculation of the co-precipitating agent(s) or charge neutralization. The addition order of the polycation flocculant and the flocculation accelerant is thus critical for the recovery of product during harvest.
Figure 11.
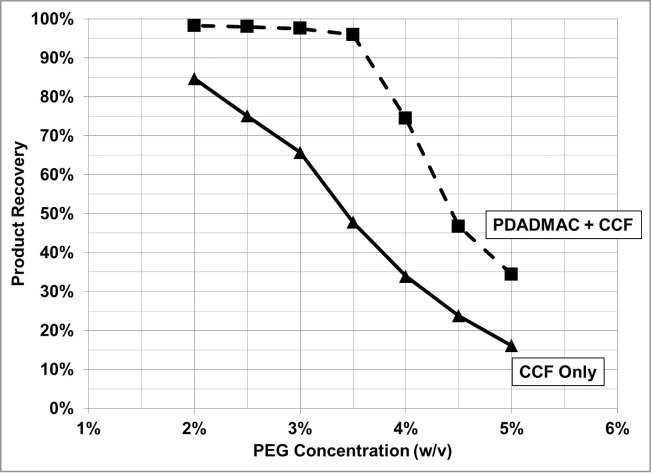
mAb solubility with respect to PEG 6,000 concentration in cell broth clarified by centrifugation (CCF) [▴], and cell broth flocculated with PDADMAC followed by centrifugation [▪].
Product solubility was determined for different molecular weight PEG's using the same PDADMAC clarified cell culture fluid feed stock as described above. The upper PEG concentration boundary, that did not result in more than 5% product loss, was 6% (w/v) for PEG 1,500, 4.5% (w/v) for PEG 3,000, 3.5% for PEG 6,000, and 3% (w/v) for PEG 8,000. This upper concentration boundary for the different PEG MW also enhanced flocculation (Figs. 8–10; not shown is the flocculent settling profile with PEG 8,000 and PEG 1,500).
Safety of Drug Product Prepared From PDADMAC Harvested Material
Due to its cytotoxicity, clearance of PDADMAC from the drug product must be demonstrated prior to clinical use. PDADMAC binds and disrupts the cell membrane releasing the intracellular soluble components.18 Using a smaller MW weight PDADMAC (54 kDa), Fischer et al.18 measured the rat red blood cells hemolytic level at 10 g of PDADMAC per L or 10 mg/mL. The hemolytic level for the larger MW PDADMAC with an average MW of 400–500 kDa was 20 mg/mL, and is similar to the results of Fischer et al. Human red blood cells PDADMAC hemolytic level was 3-fold lower than rat red blood cells [Table 3]. The monomer, DADMAC, hemolytic concentrations are 4-to 5-fold higher than PDADMAC, and are in agreement with the observations of Fischer et al.18
Table 3.
Hemolysis of red blood cells (RBC) in the presence of PDADMAC and its monomer, DADMAC
| Non-Hemolytic |
Hemolytic |
||||
|---|---|---|---|---|---|
| Treatment | RBC | Conc. (mg/mL) | % HI (Mean ± sM) | Conc. (mg/mL) | % HI (Mean ± sM) |
| DADMAC | Rat | 50 | 1.3 ± 0.1 | 100 | 9.4 ± 1.6 |
| Human | 200 | 1.5 ± 0.1 | 250 | 2.5 ± 0.2 | |
| PDADMAC | Rat | 10 | 1.8 ± 0.1 | 20 | 2.1 ± 0.1 |
| Human | 30 | 0.8 ± 0.1 | 60 | 7.8 ± 1.0 | |
In the rodent in vivo study, all animals survived and there were no PDADMAC-related clinical observations or effects on body weight. PDADMAC-related clinical pathology changes were limited to a minimal decrease of alkaline phosphatase in males and total bilirubin in females at 1.25 mg/kg compared to the control group without PDADMAC. There were no light microscopic changes attributed to PDADMAC. The no-observed adverse effect level was considered to be 1.25 mg/kg. Using this data, an acceptable exposure limit for intravenous (IV) or subcutaneous dosing can be estimated based on the ICH Q3A/B guidance according to the following calculation.24,25
Where human body weight is estimated at 60 kg, and
F1 = (5) Factor to account for extrapolation between species (rats)
F2 = (10) Factor to account for variability between individuals
F3 = (10) Factor to account for duration of selected study, (14 day study)
F4 = (1) Factor to apply in cases of severe toxicity. (No toxicity seen in vivo. No known serious toxicity from water treatment uses)
F5 = (1) Factor to apply if no-effect level is not established. (No-effect level established)
Purification Process Clearance of PDADMAC
Colorimetric assays have been developed for the detection of PDADMAC down to the single digit ppm level, but these assays are designed for drinking water, not complex biological fluids like cell culture broth.26 PDADMAC is known to bind to DNA, producing a complex that is resistant to degradation by both mechanical shear and DNase treatments.19,27,28 PDADMAC will also inhibit DNA amplification down to 5 ± 1.5 ppb using the QPCR assay to measure the recovery of spiked DNA (Fig. 12). The sensitivity of the inhibition of DNA amplification is 200-fold more sensitive than other published methods that measure PDADMAC in non-biological fluid feed streams. A limitation of the inhibition of DNA amplification is that this method cannot differentiate PDADMAC inhibition from other inhibitors found in the process intermediate matrix. As such, PDADMAC levels determined by this method would represent a worst case level of PDADMAC clearance by a purification process.
Figure 12.
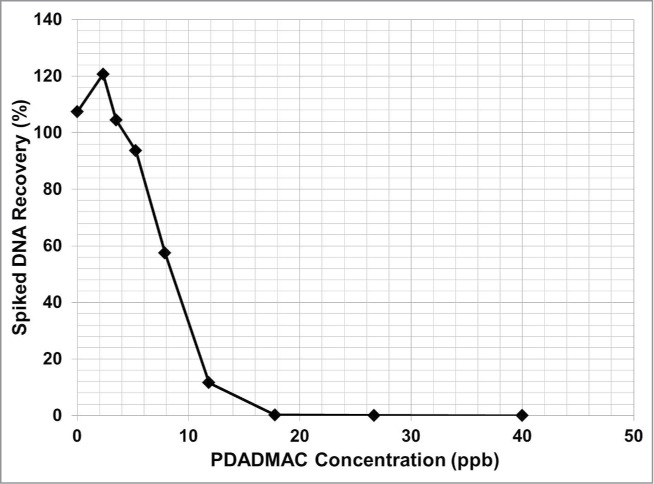
Titration curve of PDADMAC inhibition of DNA amplification by QPCR. No spiked DNA was recovered at a PDADMAC concentration ≥ 18 ppb. The DNA spiked was fully recovered to within the assay variability, at 5 ppb of PDADMAC.
Using this method, we determined that a mAb purification process completely clears PDADMAC to the assay's limit of detection from the process stream after depth filtration of the neutralized acidified Protein A pool (n-aPA) for a PDADMAC-only harvest. For a PEG/PDADMAC harvest, PDADMAC levels in the Protein A pool are below the assay's limit of detection of 50 ± 15 ppb (0.050 ± 0.015 μg/mL) (Table 4). Protein A chromatography clears PDADMAC by either the non-interaction of PDADMAC or floccules to the ligand or mAb during the load phase or washing it off the column with a high ionic strength buffer. The diatomaceous earth found in depth filters used in the harvest and n-aPA is negatively charged and the removal of PDADMAC is assumed to be mediated by ionic interaction or entrapment of the floccules.29,30 Subsequent purification operations, including cation exchange chromatography, are expected to provide additional clearance of PDADMAC.
Table 4.
PDADMAC level's measured in process intermediates from a typical mAb purification process. Flocculation harvest PDADMAC concentration was 45 pg/TC and PEG 3,000 concentration was 3% (w/v). PDADMAC level are in ppb. ND is not determined
| PDADMAC-only |
PEG / PDADMAC |
||
|---|---|---|---|
| Unit Operation | Depth Filtered | Non-Depth Filtered | Non-Depth Filtered |
| Harvest Pool | 5,000 ± 30% | ND | ND |
| Protein A Pool | 500 ± 30% | 5,000 − 10,000 ± 30% | ≤50 ± 30% |
| n-aPA | 100 ± 30% | ND | ND |
| Depth Filtered n-aPA | ≤50 ± 30% | ND | ND |
| DS | ≤120 ± 30% | ND | ND |
Based on the level of PDADMAC detected in the depth filter n-aPA shown in Table 3, the maximum level of PDADMAC in the drug product is at least 5 logs lower than the human erythrocyte PDADMAC hemolytic threshold, and 3 logs lower than the acceptable exposure limit for a daily administration of a 1 mL IV or subcutaneous dose.
Protein A Lifetime Challenged with PDADMAC Harvested Material
PDADMAC is present in the flocculated harvest and is completely removed from the process stream by Protein A chromatography and depth filtration. Depth filters are used once and disposed, whereas Protein A is reused through many cycles in a clinical and commercial manufacturing process due to the high cost of the media. To determine the effect of PDADMAC present in the harvest on Protein A purification of a mAb, a 100-cycle lifetime study was performed with PDADMAC-only supernatant that was not processed through a depth filter to represent the most conservative assessment of residual PDADMAC challenge for the Protein A chromatography step. To determine the effect of a PDADMAC harvest on the Protein A resin's lifetime, step yield, Protein A pool high MW (HMW) species, host cell protein (HCP) content, and extent of protein carryover into the subsequent elution cycle were assessed. Product quality attributes that are not affected by the Protein A step or PDADMAC flocculation such as mAb charged variants, clipped species, and non-whole mAb were not evaluated (Table 5). Host DNA was not monitored during the life-time study since it was cleared by the PDADMAC flocculation process (Table 5).
Table 5.
mAb Protein A pool product quality comparison of Protein A load prepared by centrifugation followed by a two-staged filtration train or PDADMAC flocculation followed by membrane filtration. Flocculation harvest PDADMAC-only concentration was 45 pg/TC
| SEC |
CEX-HPLC |
SDS-CE |
||||||
|---|---|---|---|---|---|---|---|---|
| Harvest Method | HMW | LMW | HCP (ppm) | Host DNA (ppm) | Acidic | Basic | Non-Reduced | Reduced |
| Centrifugation | 11.5% | 1.6% | 5,703 | 75,000 | 9.8% | 10.8% | 5.8% | 5.8% |
| Flocculation | 11.6% | 1.4% | 6,164 | 140 | 9.4% | 10.1% | 5.9% | 5.7% |
Protein A product recovery was determined for every cycle, and the average recovery was 91 ± 2% throughout the 100-cycle study (Fig. 13, Recovery). HCP levels were within the variability of the assay for the normal Protein A operation parameters (Fig. 13, HMW). There was no significant trend during the 100 Protein A resin cycles for yield and HCP clearance.
Figure 13.

Protein A 100 cycle lifetime study. Protein A process performance attribute shown is the product recovery. Protein A pool product quality attributes shown are the HMW variants and HCP levels. Shown for the Protein A pool HCP level is the purification step performed at the operating center points [▴] and at the upper at the upper or lower operating bounds [•] for buffer preparation and chromatography operating parameters.
The average level of HMW during the lifetime study was 8.5 ± 1.0%. The slight trend of decreasing HMW content in the Protein A pool with increasing number of cycles was not considered significant since these size variants are cleared by the subsequent chromatography steps (Fig. 13, HCP).
In a typical Protein A purification, the resin is cleaned with acid between cycles when processing a single harvest lot. After processing the harvest lot for a bioreactor, the Protein A is cleaned with an acid followed by sodium hydroxide prior to storing the resin in a long-term storage solution. To determine if a cleaning protocol is sufficient, a blank purification run using a mock load was performed to determine if any protein carries over into the subsequent elution pool. Mock load elution pool protein concentration was measured by micro BCA assay.
The cycle-to-cycle protein carryover assessed in the blank elution after only acid cleaning was 0.005% and the batch-to-batch protein carryover assessment in the blank elution after acid and caustic cleaning was 0.002%. The level of protein carryover observed for the PDADMAC harvest challenge was comparable to the historical Protein A life-time studies challenged with non-PDADMAC treated harvest. This demonstrates that, in the presence of a PDADMAC-containing load, the Protein A cleaning procedure and reagents are sufficient to remove any buildup of protein on the resin that potentially could elute with product in the following cycle(s).
Discussion
The addition of the polycationic polymer PDADMAC flocculates CHO cells and the cellular debris that are generated during the cell culture process production. PDADMAC flocculation produces a supernatant clarity that is comparable to a typical centrifuge-processed cell culture followed by filtration through the typical harvest filtration train, depth filtration followed by membrane filtration. Also, harvest flocculation with a polycationic polymer significantly lowers the level of sub-micron size particles, which improves the fluid clarity and minimizes fouling of the harvest filtration train (Figs. 2 and 4).7,9,21
The optimal PDADMAC flocculation performance is dependent on the polymers MW and a robust flocculation harvest process over a very wide dose range was achieved using a polymer with an average MW of 400–500 kDa. PDADMAC dosing based on the total number of cells is insensitive to the varying levels of cell culture process solids (Table 1). This simple flocculant dosing method does not require pre-harvest testing for flocculant dose determination as described by other flocculation methods.7,9,10,12,13 The flocculant dose was affected by the sub-micron particle level generated during the cell culture and harvest process for optimum flocculation performance. Increasing the flocculant dose resulted in an optimum flocculation performance for cell broth containing both typical and elevated levels of sub-micron cellular debris (Fig. 6).
Since the flocculated cell mass settles to the bottom of the harvest vessel, harvesting of the clarified supernatant is performed by decanting from the top of a harvest vessel. At larger scale, fluid decanting is performed by siphoning or pumping the clarified supernatant (Fig. 1). Unlike centrifugation, which produces a firm pellet in which the supernatant is easily decanted, PDADMAC flocculation produces a settled flocculent volume with a higher liquid content compared to centrifugation, requiring a gentle decanting method to minimized flocculent disturbance to maximize the supernatant recovery.31 Introduction of the settled flocculent into clarified supernatant must be avoided as this material will rapidly foul the downstream filtration and chromatography operations.
For maximum product recovery in a flocculation harvest, either a re-suspension wash step or dilution of the cell broth prior to flocculation is required. MAb retained in the settled flocculent supernatant or the result of perturbing the settled flocculent during fluid decantation, is recovered with a re-suspension wash step. The major limitation with this secondary recovery method is the generation of shear forces that are required for re-suspension of the settled flocculent. Additionally, longer settling times are required after flocculent re-suspension.
Dilution of the cell broth prior to the primary harvest flocculation eliminates the re-suspension wash required to maximize product yield. Based on modeling, reducing the solids concentration to approximately 15 ± 5% by diluting the cell broth increases the harvest product yield to the high 80% to low 90% range, with a corresponding increase in the harvestable volume. The cell broth dilution flocculation method significantly reduces the total harvesting processing time by eliminating the processing time required for the re-suspension and settling of the settled flocculent.
Higher cell culture process solid levels affect the harvest volume for all harvesting methods. To enable processing using a typical continuous centrifuge, the feed must contain solids at or below 10–12%.2 Feed solid levels above this require a dilution. For MF harvesting, product recovery is a function of the mAb sieving and the number of diafiltration (DF) volumes of the CCF (VCCF). A minimum of 3- to 4-DF volumes is required for a mAb recovery ≥90%.32 Modeling the effect of cell broth dilution or the DF volumes required to achieve a harvest recovery ≥90% on the harvest volume, shows that the harvest volumes of a PDADMAC flocculation harvest process are comparable to harvest volumes from centrifugation or MF (Table 6). To accommodate the larger harvest volume in the manufacturing facility, a larger harvest pool vessel is required or a volume reduction step, e. g., ultrafiltration or Protein A capture column, is needed. PDADMAC flocculation conditions that reduce the flocculent entrapped supernatant (% VE) will result in a smaller harvest volume while still maintaining ≥90% product recovery (Table 6).
Table 6.
Modeling the effect of cell broth solid levels on the harvest volume for a centrifugation, MF and flocculation harvest process. All harvest volumes are relative to the bioreactor volume. Minimum harvest recovery used in this modeling is ≥90%. For centrifugation harvesting, a cell broth dilution is required to enable processing of the feed at 10–12% solids. Modeling the MF harvest volumes was based on 100% mAb sieving. PDADMAC flocculation harvest volumes based on the entrapped supernatant (VE) using the equations described in the Methods section. PDADMAC flocculation required a minimum dilution of 10% for the addition of PDADMAC
| Centrifugation |
MF |
PDADMAC Flocculation |
||||
|---|---|---|---|---|---|---|
| Bioreactor Solids | 10% Solids | 12% Solids | 3 DF | 4 DF | 38% VE | 19% VE |
| 40% | 3.60 | 2.93 | 1.80 | 2.40 | 1.45 | 0.86 |
| 20% | 1.80 | 1.47 | 2.40 | 3.20 | 0.84 | 0.87 |
| 10% | 0.90 | 0.90 | 2.70 | 3.60 | 0.97 | 0.99 |
Product loss due to flocculation with PDADMAC is expected with low pI proteins or proteins that bind to an anion exchange resin under the same conditions present in the cell culture fluid. The addition of PEG to accelerate flocculent settling can also result in product precipitation, flocculent interaction, or product phase separation into the flocculent.23,33 This mechanism of product loss can be circumvented by dispensing the flocculant and additive aid, or the conditioning of the cell broth prior to flocculation. Adjusting the cell broth pH or conductivity resulted in a significant decline in PDADMAC flocculation performance for all conditions tested (Fig. 7).21 Flocculent settling was more tolerant to salt (Fig. 7) and sub-micron particles that can be generated during the cell culture processes or the processing of the flocculated harvest in the non-ionic polymer/PDADMAC method compared to PDADMAC only.1–3 Clearly, the simpler PDADMAC-only flocculation method is easier to develop and trouble-shoot, but it is less robust with respect to the variability in cell culture performance that results in high lactate production or solids level than the more complex non-ionic polymer/PDADMAC flocculation method.
Clearance of the PDADMAC with an average MW of 400–500 kDa was demonstrated for a flocculated harvest (Table 4). The polycation was removed by the depth filtration of the n-aPA and the Protein A purification step to a level that is 5 logs below the human red blood cell hemolytic level and 3 logs lower than the acceptable exposure limit for IV or subcutaneous dosing for a 1 mL administration on a daily basis. Other cation exchange chromatography or negatively-charged filtration steps would be expected to further remove PDADMAC from the process stream, providing an additional safety margin of clearance.
A Protein A lifetime study was performed that demonstrated harvest material containing ppm levels of PDADMAC did not affect column performance or mAb product quality up to 100-cycles. We also showed that the Protein A cleaning protocol was sufficient to clean the column exposed to PDADMAC-treated harvest to acceptable levels of protein carryover into the next elution cycle.
The work presented here demonstrates that PDADMAC flocculation is an effective and viable harvest method performed in the batch mode for CHO cell culture processes. PDADMAC flocculation allows harvesting cell culture process containing very high solid levels from the bench top to the commercial scale. Compared to the gold standard harvesting methods, centrifugation and MF, PDADMAC flocculation is comparable to the other 2 harvest methods. All are able to process high solids containing cell broth and all affects the manufacturing capabilities and capacities by the same degree. Clearance of the cytotoxic flocculant, PDADMAC, from the drug product was demonstrated to acceptable levels to allow human administration.
Materials and Methods
Materials
Cell broth was produced by an Amgen proprietary batch or perfusion cell culture process using CHO cells that expressed either IgG1 or IgG2 monoclonal antibodies. MAbSelect SuRe Protein A media was obtained from GE Healthcare (17-5438-01) and packed in a Vantage column (i.d. 1.15 cm) obtained from EMD/Millipore Corporation (96100250). Filtration throughput was determined using a 24 cm2 Cuno Biocap depth filter from 3M (BC0025L120ZA08A) and a 3.5 cm2 OptiScale 25 Capsule with Millipore Express SHC (0.5/0.2μm) membrane filter from Millipore Corporation (SHGEA25NB6).
Saponin (S4521), sodium lactate (71718), dextran 70 (31380), PEG with an average MW of 1,000 (81188), 1,500 (86101), 3,000 (81227), 6,000 (81253), and 8,000 (89510), DADMAC (348279), and PDADMAC with an average MW of <100,000 (522376), 100,000 to 200,000 (409014), 200,000 to 350,000 (409022), and 400,000 to 500,000 Da (409030) were obtained from Sigma-Aldrich. Sucrose was obtained from EMD Chemicals (1.00892). 1X Dulbecco's phosphate buffered saline (PBS) was obtained from Invitrogen (14190). Sodium heparin for Injection (10,000 UPS Units/mL) was obtained from APP Pharmaceuticals (504207).
Methods
Cell broth solids level determination
The cell broth solids level was determined by measuring the PCV. The PCV determination was performed at an average relative centrifugal force (rcf) of 1,462 for 17 minutes using an Allegra 6R centrifuge equipped with a GH-3.8 rotor obtained from Beckman-Coulter. PCV determination was performed in duplicate and averaged. All centrifugation operations were performed at a temperature of 10°C.
Cell density and size
Viable and non-viable cell density was determined by the Trypan Blue exclusion method34 using an automatic cell counter (Cedex, Roche Diagnostic Corporation). Cell diameter was measured using the Cedex instrument.
Particle sizing and distribution
Particle sizing and distribution were determined by focused beam reflectance measurement (FBRM) using a model 400 from Mettler Toledo. Particle sizes reported are the mean chord length, square weighted, as calculated by the FBRM software.
Determination of the flocculent size with the FBRM required constant low speed mixing to keep the cells and flocculated particles in suspension. Shear forces are known to disrupt flocculated particles, resulting in creation of smaller particles. To determine the effectiveness of the flocculation conditions or reagents in producing large particles in the FBRM system, a steady-state in particle size must be achieved. This required a measurement period duration that achieved a steady-state in particle size, typically 5 to 30 minutes, at a constant mixing rate for a given flocculation vessel.
Cell broth flocculation
Flocculation was performed by the addition of a PDADMAC solution to 0.5 or 1 L of cell broth with constant mixing in a 1 L spinner flask (BellCo; 1965–61010). The PDADMAC cell broth mixture was stirred on a 5-position magnetic stirrer (BellCo; 7795–46065) for 10–15 minutes at 80–90 rpm prior to transferring to a 0.5 or 1 L glass graduated cylinder (Fisher Scientific; 08–559F and 08–559G, respectively). The settling rate of the flocculent (the ratio of flocculated solids to total cell broth volume multiplied by 100) was based on the visual clarity difference between the solid phase and the clarified phase.7,10,12,31 At the start of flocculation, time = 0, the solids phase clarity equals that of the pre-flocculated cell broth.
After settling, the clarified fluid was decanted from the settled flocculent. The fluid clarity was measured with a Hach 2100P turbidimeter (Hach) prior to membrane filtration. Product titer was determined by Protein A HPLC.35 The harvest product recovery was calculated using the following equation:4,13
Where:
VCCF = CCF volume in the bioreactor
TH = Product titer in the Harvested supernatant
VH = Harvested volume
TCCF = Product titer in the CCF
The harvestable cell culture fluid volume (VCCF) is dependent on the bioreactor solids level. VCCF is determined as follow:
Where:
VBR = Bioreactor working volume
VS = Volume of solids measured by the PCV method
The effectiveness of a flocculation harvest process at dewatering the biomass solids, minimizing the flocculent's entrapped liquid, was calculated using the following equation:31
Where:
VE = Liquid volume entrapped in the settled flocculent (VF)
VFE = Settled flocculent volume, experimentally measured
This calculation assumes that the maximum volume of supernatant that can be recovered with a corresponding minimum amount of entrapped supernatant in the solids phase is measured by the PCV method. At 0% VE, the potential flocculated harvest volume equals the harvest volume obtained by centrifugation.
The standard error of the mean (sM) and the relative estimated error of the mean (% sM) from the mean, determined at a 95% confidence level using the t-distribution with a degree of freedom of n-1, are described as follows:
where:
s = standard deviation
t = t-distribution at 95% confidence = 3.182
μ = mean
N = sample size.
All flocculation and settling was performed at ambient temperature (18–25°C) unless otherwise noted. Typical solids level were between 10 and 30% and lactate levels less than 1 g/L were tested unless otherwise noted.
Sheared cell broth was generated by mechanically shear in a 1 L Waring blender (Waring Laboratory; model LB 10S) that resulted in centrifuged cell broth clarity > 1,000 NTU's. Blender speed was controlled by voltage at 50% of the maximum blender voltage. Blending time was performed at ambient temperature for a 30 second duration. Clarification of sheared and non-sheared cell both used the centrifugation conditions described in the Cell Broth Solids Level Determination section.
Modeling the flocculent steady-state settled volume (VFC)
The flocculation harvest volume is dependent on the settled flocculent volume. At steady-state settling, the flocculent volume can be predicted from the cell broth solids level (VS) and the entrapped settled flocculent supernatant volume (VE). The predicted settled flocculent volume is calculated using the following equation:
where:
VE = Volume entrapped in flocculent
VFC = Steady-state settled flocculent volume, calculated.
Harvested filtration throughput
Depth filter or 0.5/0.2 μm membrane filter throughput studies were performed by monitoring the filter's inlet pressure signal, which was acquired with Millipore Pmax DAQ software. Filters were pre-wetted with purified water prior to applying cell culture fluid prepared by centrifugation or PDADMAC flocculation. All operations were performed at ambient temperature. The flux rate was kept constant at 300 Ls per meter per hour for all depth filter and membrane filter conditions tested.
Protein A purification
Clarified harvested cell culture fluid was purified using the Protein A chromatography method described by Yigzaw et al.36 with the following modifications: 1) the Protein A column loading was between 25 and 35 mg per mL of resin, and 2) the Protein A eluate was not neutralized prior to product quality determination, since the mAb product quality attributes were stable in the Protein A eluate.
Protein A eluate was analyzed for size variants as measured by SEC-HPLC,37 HCP as determined by ELISA,36 and charged-based variants as measured by CEX-HPLC.38 Host cell DNA was determined by quantitative polymerase chain reaction as described below. mAb fragments or clipped species were determined by reduced SDS-CE analysis and partially-reduced fragments and clipped species were determined by non-reduced SDS-CE analysis, and reported as non-main mAb peak.39
Protein carry-over was determined using the Pierce micro BCA assay kit following the manufacturer instructions (Thermo Scientific; 23235).
Quantitative polymerase chain reaction (QPCR)
DNA was measured by a QPCR assay. Sample DNA purification was performed using a QIA amp DNA mini kit, obtained from Qiagen (51306). Standard DNA was purified from production cells using the Qiagen DNeasy Blood and Tissue DNA kit from Qiagen (69506). Sample DNA was prepared by digestion with Proteinase K followed by DNA extraction and isopropyl alcohol precipitation.
Primers were designed to amplify a host-cell specific repetitive DNA sequence, and a specific probe was designed to anneal between them. The probe is labeled with the fluorescent reporter dye FAM (6-carboxyfluorescein) at its 5′ end and the quencher dye TAMRA (6-carboxytetramethylrhodamine) at its 3′ end. The primer and its labeling with the reporter and quencher dyes were obtained from Integrated DNA Technologies. The PCR reaction and DNA quantitation were performed with an ABI Prism® 7900HT Sequence Detection System instrument (Applied Biosystems).
Spiked DNA recovery experiments were performed in the presence of PDADMAC (average MW 400–500 kDa) at 0 to 50 ppb and 100 pg of CHO DNA. The sample was purified as described above and the spiked recovery was determined by QPCR. PDADMAC concentration of 5 ppb ± 1.5 ppb (relative range is ± 30%) resulted in complete recovery of the spiked DNA within the assay acceptance range of 100% ± 20% (Fig. 12).
QPCR quantitation of PDADMAC in process intermediates
PDADMAC treated harvest process intermediates were serially diluted until complete recovery of 100 pg CHO DNA spike was achieved. The process sample PDADMAC level was calculated as follows:
A minimal dilution was required to overcome buffer matrix interference for non-PDADMAC treated harvest prior to the CHO DNA spike. Process intermediates, e.g., harvest to depth filtered n-aPA samples, required a 10 fold dilution into QPCR assay buffer and drug substance required a 24–fold dilution. The limit of detection for PDADMAC in 10-fold diluted process intermediate is ≤50 ppb ± 30% and ≤120 ppb ± 30% drug substance diluted 24 fold.
In vitro hemolysis
An in vitro hemolysis test was performed to address the potential hemolytic property of PDADMAC (average MW 400–500 kDa) using rat or human blood. Heparinized blood was diluted in Dulbecco's PBS to obtain optical density (545 nm) of 1.0 ± 0.2. Diluted blood (100 μL) was mixed with 1.9 mL of each serially diluted PDADMAC concentration. Dulbecco's PBS and 50 μg/mL saponin served as the negative and positive controls, respectively. All test mixtures were incubated for 30 minutes at 37°C under static conditions and samples were centrifuged for 10 minutes average rcf of 1,462. An aliquot of each supernatant was transferred to a 96-well plate and the optical density at 545 nm (OD545) was measured. The hemolytic index (HI) was determined using the equation:
where:
OD neg cont = OD545 of negative control
OD pos cont = OD545 of positive control.
A mean hemolytic index was calculated from the triplicate test samples. An HI of greater than 2 is considered hemolytic.
In vivo rodent study
A rodent study was conducted in male and female Spraque-Dawley rats (n = 5/sex/group) to evaluate the potential toxicity of PDADMAC (ave. MW 400–500 kDa) at doses of 0 (vehicle control; sterile water for injection), 0.75 or 1.25 mg/kg IV administered weekly for 14 d (2 doses). In addition, 5 animals/sex at the 1.25 mg/kg dose were allowed to recover for 14 d following the end of the treatment period (Day 15). The low dose approximates the current assay sensitivity while the higher dose provides a further safety margin. Animals were maintained and housed according to standard husbandry practices at Amgen and the International Animal Care and Use Committee guidelines.40 Prior to dosing, samples from the dose formulation (1.25 mg/ml) were analyzed for concentration verification. Parameters evaluated included clinical observations, body weights, clinical pathology (hematology, clinical chemistry, coagulation, and urinalysis), organ weights and histopathology of all tissues.
Disclosure of Potential Conflicts of Interest
No potential conflicts of interest were disclosed.
Acknowledgments
The authors thank Scott Kuhns, John Moscariello, Ganesh Vedantham, Linda Narhi, and Alison Moore for the technical review of this paper, and Joe Naemura for supporting the Protein A lifetime study.
References
- 1. Iammarino M, Gyabaah JN, Chandler M, Roush D, Göklen K. Impact of cell density and viability on primary clarification of mammalian cell broth. BioProcess Int 2007; 5:38-50. [Google Scholar]
- 2. Kempken R, Preissman A, Berthold W. Assessment of a disc stack centrifuge for use in mammalian cell separation. Biotechnol Bioeng 1995; 46:132-8; PMID:18623272; http://dx.doi.org/ 10.1002/bit.260460206 [DOI] [PubMed] [Google Scholar]
- 3. Roush DJ, Yuefeng L. Advances in primary recovery: Centrifugation and membrane technology. Biotechnol Prog 2008; 24:488-95; PMID:18410157; http://dx.doi.org/ 10.1021/bp070414x [DOI] [PubMed] [Google Scholar]
- 4. Schirmer EB, Kuczewski M, Golden K, Lain B, Bragg C, Chon J, Caccluttolo M, Papastoitsis GZ. Primary clarification of very high-density cell culture harvests by enhanced cell settling. BioProcess Int 2010; 8:32-9. [Google Scholar]
- 5. Douwenga R. Moving to the next level of manufacturing. BioProcess Int , 2009 Online Educational Series. Raleigh, NC, Oct 14, 2009. Available from: http://www.bpiseminars.com/Webcast/downloads/BPI_DSM_Webcast.pdf [Google Scholar]
- 6. Van der Bruggen B, Kim JH, DiGiano FA, Geens J, Vandecasteele C. Influence of MF pretreatment on NF performance for aqueous solutions containing particles and an organic foulant. Sep Purif Technol 2004; 36:203-13; http://dx.doi.org/ 10.1016/S1383-5866(03)00216-8 [DOI] [Google Scholar]
- 7. Riske F, Schroeder J, Belliveau J, Kang X, Kutzko J, Menon MK. The use of chitosan as a flocculant in mammailian cell culture dramatically improves clarification throughput without adversely impacting monoclonal antibody recovery. J Biotechnol 2007; 128:813-23; PMID:17291617; http://dx.doi.org/ 10.1016/j.jbiotec.2006.12.023 [DOI] [PubMed] [Google Scholar]
- 8. Aunins J, Wang DIC. Induced flocculation of animal cells in suspension culture. Biotechnol Bioeng 1989; 34:629-38; PMID:18588147; http://dx.doi.org/ 10.1002/bit.260340507 [DOI] [PubMed] [Google Scholar]
- 9. Kim JS, Akeprathumchai S, Wickramasinghe SR. Flocculation to enhance microfiltration. J Memb Sci 2001; 182:161-72; http://dx.doi.org/ 10.1016/S0376-7388(00)00564-0 [DOI] [Google Scholar]
- 10. Hughes J, Ramsden DK, Symes KC. The flocculation of bacteria using cationic synthetic flocculants and chitosan. Biotechnol Tech 1990; 4:55-60; http://dx.doi.org/ 10.1007/BF00156611 [DOI] [Google Scholar]
- 11. Gregory J, Barany S. Adsorption and Flocculation by polymers and polymer mixtures. Adv Colloid Interface Sci 2011; 169:1-12; PMID:21762869; http://dx.doi.org/ 10.1016/j.cis.2011.06.004 [DOI] [PubMed] [Google Scholar]
- 12. Ramsden DK, Hughes J, Weir S. Flocculation of cellular material in complex fermentation medium with the flocculant poly (diallyldimethylammonium chloride). Biotechnol Tech 1998; 12:599-603 [Google Scholar]
- 13. Kang Y, Hamzik J, Felo M, Qi B, Lee J, Ng S, Liebisch G, Shanehsaz B, Singh N, Persaud K, Ludwig DL, Balderes P. Development of a novel and efficient cell culture flocculation process using a stimulus responsive polymer to streamline antibody purification processes. Biotechnol Bioeng 2013; 110:2928-37; PMID:23740533; http://dx.doi.org/ 10.1002/bit.24969 [DOI] [PMC free article] [PubMed] [Google Scholar]
- 14. Brostow W, Lobland HEH, Pal S, Singh RP. Settling rates for flocculation of iron and manganese ore-containing suspensions by cationic glycogen. Polym Eng Sci 2008; 48:1892-6; http://dx.doi.org/ 10.1002/pen.21064 [DOI] [Google Scholar]
- 15. US Food and Drug Administration Guidance for industry and FDA staff: class II special controls guidance document: wound dressing with Poly(diallyl dimethyl ammonium chloride) (pDADMAC) addition. FDA Center for Devices and Radiological Health, 2009. Available from: http://www.fda.gov/MedicalDevices/DeviceRegulationandGuidance/GuidanceDocuments/ucm186571.htm [Google Scholar]
- 16. John W, Buckley CA, Jacobs EP, Sanderson RD. Synthesis and use of PolyDADMAC for water purification. Biennial Conference of the Water Institute of Southern Africa, Durban, South Africa, May 19-23, 2002. Available from: http://www.waterinformation.co.za/literature/files/127%20Paper.pdf
- 17. Bolto BA. Soluble polymers in water purification. Prog Pol Sci 1995; 20:987-1041; http://dx.doi.org/ 10.1016/0079-6700(95)00010-D [DOI] [Google Scholar]
- 18. Fischer D, Li Y, Ahlemeyer B, Krieglstein J, Kissel T. In vitro cytotoxicity testing of polycations: influence of polymer structure on cell viability and hemolysis. Biomaterials 2003; 24:1121-31; PMID:12527253; http://dx.doi.org/ 10.1016/S0142-9612(02)00445-3 [DOI] [PubMed] [Google Scholar]
- 19. Fischer D, Dautzenberg H, Kunath K, Kissel T. Poly(diallyldimethylammonium chorides) and their N-methyl-N-vinylacetamide copolymer-based DNA-polyplexes: role of molecular weight and charge density in complex formation, stability, and in vitro activity. Int J Pharm 2004; 280:253-69; PMID:15265564; http://dx.doi.org/ 10.1016/j.ijpharm.2004.05.018 [DOI] [PubMed] [Google Scholar]
- 20. Ravina L. Everything you want to know about coagulation & flocculation. Zeta-Meter, Inc., 1993. Available from: http://www.zeta-meter.com/coag.pdf [Google Scholar]
- 21. Senczuk A, Yigzaw Y, Thomas A, Piper R, McNerney T. Particle distribution and cholesterol level as predictors of cell culture flocculation and filterability performance. American Institute of Chemical Engineers, Puget Sound Local Section. Bothell, WA, Nov 16, 2010. Available from: http://www.aiche.org/community/sites/local-sections/puget-sound/events/november-16-2010-meeting-anna-senczuk-amgen [Google Scholar]
- 22. Lekkerkerker HNW, Tuinier R. Colloids and the depletion interaction. Lecture Notes in Physics. Dordrecht: Springer; 2011. [Google Scholar]
- 23. Gibson T, McCarty K, McFadyen IJ, Cash E, Dalmonte P, Hinds KD, Dinerman AA, Alvarex JC, Volkin DB. Application of a high-throughput screening procedure with PEG-induced precipitation to compare relative protein solubility during formulation development with IgG1 monoclonal antibodies. J Pharm Sci 2011; 100:1009-21; PMID:21280052; http://dx.doi.org/ 10.1002/jps.22350 [DOI] [PubMed] [Google Scholar]
- 24. ICH (International Conference on Harmonization of Technical Requirements for Registration Pharmaceuticals for Human Use). Impurities in new drug substances Q3A (R2) Geneva, Switzerland; 2006. Available from: http://www.ich.org/products/guidelines/quality/quality-single/article/impurities-in-new-drug-substances.html [Google Scholar]
- 25. ICH (International Conference on Hamonization of Technical Requirements for Registration Pharmaceuticals for Human Use). Impurities in new drug products Q3B (R2) Geneva, Switzerland; 2006. Available from: http://www.ich.org/products/guidelines/quality/quality-single/article/impurities-in-new-drug-products.html [Google Scholar]
- 26. Majam S, Jonnalagadda SB, Thompson P. Development of analytical methods for organic polymer determination used in water treatment. Proceedings of the 2004 Water Institute of Southern Africa (WISA) Biennial Conference, Cape Town, South Africa, May 2–6, 2004. Available from: http://www.ewisa.co.za/literature/files/236.pdf
- 27. Slita AV, Kasyanenko NA, Nazarova OV, Garvrilova II, Eropkina EM, Sirotkin AK, Smirnova TD, Kiselev OI, Panarin EF. DNA-polycation complexes; Effect of polycation structure on physic-chemical and biological properties. J Biotechnol 2007; 127:679-93; PMID:16934901; http://dx.doi.org/ 10.1016/j.jbiotec.2006.07.016 [DOI] [PubMed] [Google Scholar]
- 28. Schindler T, Nordmeier E. Denaturation experiments of calf-thymus DNA/polycation complexes in aqueous/organic solvent mixtures. Polymer 1999; 40:7019-27; http://dx.doi.org/ 10.1016/S0032-3861(99)00057-9 [DOI] [Google Scholar]
- 29. Farrah S, Preston DR, Toranzos GA, Girard M, Erdos GA, Vasuhdivan V. Use of modified diatomaceous earth for removal and recovery of viruses in water. Appl Environ Microbiol 1991; 57:2502-6; PMID:1768124 [DOI] [PMC free article] [PubMed] [Google Scholar]
- 30. Bauer D, Killmann E, Jaeger W. Flocculation and stabilization of colloidal silica by adsorption of poly-diallyl-dimethyl-ammoniumchloride (PDADMAC and of copolymers of DADMAC with N-methyl-N-vinyl-acetamide (NMVA). Colloid Polym Sci 1998; 276:698-708; http://dx.doi.org/ 10.1007/s003960050299 [DOI] [Google Scholar]
- 31. von Homeyer A, Krenta DO, Kulicke WM, Lerche D. Optimization of the polyelectrolyte dosage for dewatering sewage sludge suspensions by means of a new centrifugation analyser with an optoelectronic sensor. Colloid Polym Sci 1999; 277:637-45; http://dx.doi.org/ 10.1007/s003960050435 [DOI] [Google Scholar]
- 32. Schwartz L. Diafiltration for desalting or buffer exchange. BioProcess Int 2003; 1:43-9. [Google Scholar]
- 33. Asenjo J, Andrews BA. Aqueous two-phase systems for protein separation: phase separation and applications. J Chromatogr A 2012; 1238:1-10; PMID:22494642; http://dx.doi.org/ 10.1016/j.chroma.2012.03.049 [DOI] [PubMed] [Google Scholar]
- 34. Altman S, Randers L, Rao G. Compariosn of trypan blue dye exclusion and fluorometic assays for mammalian cell viability determinations. Biotechnol Prog 1993; 9:671-4; PMID:7764357; http://dx.doi.org/ 10.1021/bp00024a017 [DOI] [PubMed] [Google Scholar]
- 35. Compton B, Lewis MA, Whigham F, Gerald JS, Countryman GE. Analytical potential of protein A for affinity chromatography of polyclonal and monoclonal antibodies. Anal Chem 1989; 61:1314-7; PMID:2774191; http://dx.doi.org/ 10.1021/ac00188a003 [DOI] [PubMed] [Google Scholar]
- 36. Yigzaw Y, Piper R, Tran M, Shukla AA. Exploitation of the adsorptive properities of depth filters for host cell protein removal during monoclonal antibody purification. Biotechnol Prog 2006; 22:288-96; PMID:16454522; http://dx.doi.org/ 10.1021/bp050274w [DOI] [PubMed] [Google Scholar]
- 37. Dillion T, Ricci MS, Vezina C, Flynn GC, Liu YD, Rehder DS, Plant M, Henkle B, Li Y, Deechongkit S, Varnum B, Wypych J, Balland A, Bondarenko PV. Structural and functional characterization of disulfide isoforms of human IgG2 subclass. J Biol Chem 2008; 283:16206-15; PMID:18339626; http://dx.doi.org/ 10.1074/jbc.M709988200 [DOI] [PMC free article] [PubMed] [Google Scholar]
- 38. Wypch J, Li M, Guo A, Zhang Z, Martinez T, Allen MJ, Fodor S, Kelner DN, Flynn GC, Liu YD, Bondarenko PV, Ricci MS, Dillion TM, Balland A. Human IgG2 antibodies display disulfide-mediated structural isoforms. J Biol Chem 2008; 283:16194-205; PMID:18339624; http://dx.doi.org/ 10.1074/jbc.M709987200 [DOI] [PMC free article] [PubMed] [Google Scholar]
- 39. Martinez T, Guo A, Allen MJ, Han M, Pace D, Jones J, Gillespie R, Ketchem RR, Zhang Y, Balland A. Disulfide connectivity of human immunoglobulin G2 structural isoforms. Biochemistry 2008; 47:7496-508; PMID:18549248; http://dx.doi.org/ 10.1021/bi800576c [DOI] [PubMed] [Google Scholar]
- 40. Office of Laboratory Animal Welfare, NIH (National Institutes of Health) Institutional animal care and use committee guidebook. 2nd ed. Bethesda, MD: Author; 2002. http://www.grants.nih.gov/grants/olaw/guidebook.pdf [Google Scholar]


