

Abstract
Methylated DNA immunoprecipitation sequencing (MeDIP-Seq) is a widely used approach to study DNA methylation genome-wide. Here, we developed a MeDIP-Seq protocol compatible with the Ion Torrent semiconductor-based sequencing platform that is low cost, rapid, and scalable. We applied this protocol to demonstrate MeDIP-Seq on the Ion Torrent platform provides adequate coverage of CpG cytosines, the methylation states of which we validated at single-base resolution on the Infinium HumanMethylation450 BeadChip array, and accurately identifies sites of differential DNA methylation. Furthermore, we applied an integrative approach to further investigate and confirm the role of DNA methylation in alternative splicing and to profile 5mC and 5hmC variants of DNA methylation in normal human brain tissue that is localized over distinct genomic regions. These applications of MeDIP-Seq on the Ion Torrent platform have broad utility and add to the current methodologies for profiling genome-wide DNA methylation states in normal and disease conditions.
Keywords: DNA methylation, hydroxymethylation, Ion Torrent sequencing, splicing, HCT116, brain
Introduction
Epigenetic mechanisms involve DNA methylation and posttranslational modifications of histones that operate at the level of chromatin. Collectively, these modifications comprise an epigenome and regulate multiple cellular processes that, if perturbed, associate with various diseases (reviewed in1,2). Advances in DNA sequencing technologies have enhanced our understanding of the functional roles of epigenetic modifications in fundamental cellular processes, including DNA repair and replication, nucleosome assembly, gene transcription, and pre-mRNA splicing.3-8 For studying DNA modifications, a variety of strategies have been developed that provide extensive characterization of the genome-wide distribution of DNA methylation states at nucleosomal to single-nucleotide resolution, enabling more detailed analyses of its local activity at specific regions throughout the genome.9-14
Among the strategies developed for assessing DNA methylation states,15-20 methylated DNA immunoprecipitation followed by sequencing (MeDIP-Seq) offers a method of distinguishing between distinct DNA modifications [i.e., 5-methylcytosine (5mC) vs. 5-hydroxymethylcytosine (5hmC)] and provides sufficient coverage of CpG methylation states in the genome.21,22 To date, MeDIP-Seq has exclusively been run using optical-based sequencers.23 Optical-based sequencers offer the advantage of the highest data throughput per run; however, possible disadvantages include high start up cost to purchase the instrument and long run times to acquire sequencing data. An alternative high-throughput sequencing approach, semiconductor-based sequencing using the Ion Torrent platform24 (Life Technologies, Carlsbad, CA) offers comparable sequencing data at quicker run speeds and lower cost relative to optical-based sequencers.25-27 The Ion Torrent platform exploits the sequencing-by-synthesis approach via measuring hydrogen ions released upon incorporation of nucleotides.24 This platform has produced high quality sequencing data for a variety of applications genome-wide24,28-32; however, has yet to be applied to studies evaluating genome-wide DNA methylation states.
Here, we developed and optimized a MeDIP-Seq protocol compatible with the Ion Torrent semiconductor sequencing technology. To validate our protocol, we profiled and compared DNA methylation between DNMT-proficient “wild-type” (WT) HCT116 and genetic (DKO) cells with disruption of DNMT1 and DNMT3b and compared the performance of our MeDIP-Seq data to Illumina bead array technology. Next, to demonstrate the application of genome-wide DNA methylation datasets generated using the Ion Torrent platform, we integrated MeDIP-Seq data with RNA-Seq data to evaluate the association of DNA methylation and alternative splicing. Finally, we showed the utility of this protocol in distinguishing between specific types of DNA methylation (e.g., 5-methylcytosine vs. 5-hydroxymethylcytosine variants) in postmortem brain tissue specimens.
Results
Developing a MeDIP-Seq protocol for the Ion Torrent sequencing platform
Based on a MeDIP protocol we previously applied on an Illumina optical-based sequencer,8 we developed a MeDIP-Seq protocol compatible with the Ion Torrent platform. Figure 1 illustrates the 3-day workflow of this Ion Torrent-compatible MeDIP-Seq protocol. First, 1 μg of DNA was sonicated using a focused-ultrasonicator instrument (Covaris) under conditions yielding a mean fragment size of 300 bp, ideal for sequencing 200 bp length fragments with the Ion Torrent platform (Fig. 1a). Second, we determined our Ion Torrent MeDIP-Seq protocol required that adapters be ligated to sonicated DNA prior to the immunoprecipitation reaction (Fig. 1b). Similar to a protocol developed for low input DNA concentrations,33 this particular order was critical in this MeDIP-Seq protocol to allow for adapter ligation on double-stranded DNA as the conditions used in the immunoprecipitation step cause the DNA to become single-stranded. After the adapter ligation reaction, we immunoprecipitated methylated DNA using a previously validated magnetic capture-based MeDIP kit (Diagenode; cat. no. mc-magme-A10) that included an antibody with high affinity and specificity for 5-methylcytosine. We confirmed the efficiency of the immunoprecipitation reaction using quantitative PCR (qPCR) targeted to methylated or unmethylated control DNA fragments, which had been spiked in with the adapter-ligated DNA sample prior to immunoprecipitation. The enrichment of methylated DNA using this approach was highly efficient, as indicated by our qPCR results measuring ∼80% recovery of methylated but not unmethylated DNA (Fig. 1c). Following immunoprecipitation of Ion Torrent adapter-ligated DNA, we size-selected unamplified libraries from 200 – 400 bp (Fig. 1d), restored strandedness upon amplifying libraries by PCR performed under standard conditions (Fig. 1e), size-selected PCR-amplified libraries (Fig. 1f), and assessed the quality and quantity of each library on a Bioanalyzer instrument (Agilent) prior to sequencing. This analysis revealed that each library consisted of DNA fragments with an average length of 280 bp (Fig. 1g). We then templated these fragments on Ion Sphere Particles (ISPs) using the Ion OneTouch2 emulsion PCR instrument (Life Technologies) at a recommended molar concentration of 26 pM for Ion Torrent 200 bp Sequencing (Fig. 1h). We assessed the quality of the MeDIP-Seq library-bound ISPs using an optional Qubit assay (Life Technologies; cat. no. 4468656), which typically exhibited 20–32.5% templated ISPs (not shown). This fell within the acceptable manufacturer recommended range for sequencing. MeDIP-Seq library-bound ISPs were then loaded onto Ion Torrent semiconductor sequencing chips and sequenced on an Ion Torrent instrument (Fig. 1i). Acquired sequencing data was then processed, assessed for quality, and aligned to a reference genome on an Ion Torrent server using Torrent Server Suite v4.0 (Fig. 1j).
Figure 1.
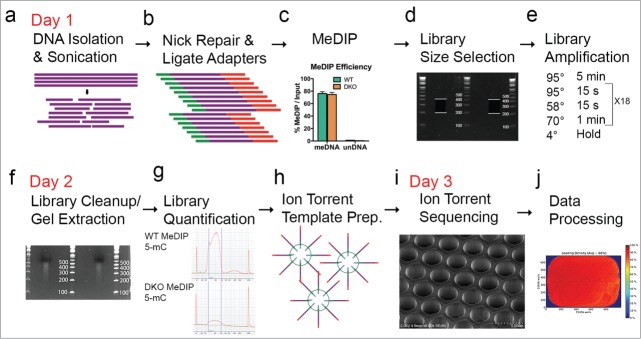
Workflow of Ion Torrent-compatible MeDIP-Seq protocol. Schematic representation of the MeDIP-Seq protocol developed for the Ion Torrent platform to profile DNA methylation genome wide. (a) Genomic DNA (1 μg) is isolated from a sample of interest and sonicated for 300 s on a Covaris Focused-ultrasonicator (Peak intensity power: 50, Duty: 20%, Cycles: 200, Temp: 20°C) to a mean fragment size of 300 bp. (b) Fragmented DNA is nick repaired and ligated with Ion Torrent sequencing adapters. (c) Ligated DNA is enriched for either 5mC (data shown) or 5hmC variants of methylation. Efficiency of MeDIP reaction is determined by using spiked in methylated and unmethylated DNA and compared to a 10% input DNA control. (d) Fragments of immunoprecipitated DNA are separated on a 2% agarose gel and size selected from 200–400 bp. (e) Size-selected fragmented DNA library is amplified for 18 cycles. (f) Amplified MeDIP library is cleaned up and size selected again on a 2% E-gel. (g) MeDIP library (1 μl) is used on a bioanalyzer instrument to assess quality and determine concentration. Figure displays bioanalyzer traces for WT (top) and DKO (bottom) 5mC MeDIP libraries. (h) High quality MeDIP library is templated on ISP beads appropriate to the capacity of sequencing (Life Technologies). (i) Templated MeDIP library is loaded onto an Ion Torrent semi-conductor sequencing chip and sequenced for 500 flows (Life Technologies). An example of the Ion Torrent 318 chip is shown in the figure using scanning electron microscopy to visualize the wells of a semi-conductor sequencing chip. (j) Sequencing data is processed on the Ion Torrent software (Life Technologies). An example of a loaded P1 chip after an Ion Proton sequencing run is shown. WT, HCT116-WT; DKO, HCT116-DKO.
Semiconductor-based MeDIP-Seq yields reliable and scalable coverage of CpG methylation
Genome-wide DNA methylation patterns are established and maintained by DNA methyltransferases (DNMTs).34 Genetic disruption of DNMT1 and DNMT3b in the HCT116 colon cancer cell line (DKO) attenuates methyltransferase activity, causing significant reduction of DNA methylation throughout the genome relative to that of the DNMT-proficient “wild-type” (WT) HCT116 cells from which DKO was derived.35 We observed a significant ∼2.8-fold reduction of total 5mC content, as measured as percent methylation, in genomic DNA from DKO compared to WT cells (WT mean = 3.2%, DKO mean = 1.16%; P = 0.03) using an enzyme-linked immunosorbent assay, ELISA (Fig. 2a). This estimate of bulk DNA methylation as a percentage of the genome in HCT116-WT cells is consistent with estimates previously reported.36,37 To evaluate the sensitivity of our MeDIP-Seq protocol in detecting local differences in DNA methylation throughout the genome, we generated and compared the genome-wide DNA methylation profiles of HCT116-WT and HCT116-DKO cells. We obtained a total of 58.85 and 55.46 million reads mapped to the human genome (hg19 assembly) from MeDIP-Seq libraries of WT and DKO cells, respectively (Supplementary Table 1). Analysis of this MeDIP-Seq data by the Model-based Analysis for ChIP-Seq (MACS) peak finding software,38 revealed a total of 166,351 MeDIP-Seq peaks (interpreted as loci enriched for DNA methylation) in WT cells, while 84,404 peaks were identified in DKO cells (Fig. 2b). This approximately 2-fold lower number of peaks observed in the DKO MeDIP-Seq library compared to WT is consistent with the global loss of 5mC content we confirmed by ELISA (Fig. 2a). Since the primary target of DNA methylation occurs at CpGs, we next assessed the coverage of CpGs from the MeDIP-Seq methylation profiles using the sequence pattern coverage analysis tool in the MEDIPS R package.39 This analysis revealed that ∼84.4% of the 28,217,448 total estimated CpGs in the human genome are represented with a coverage of at least 1X in the MeDIP-Seq data from WT cells, while ∼77.1% are represented in the MeDIP-Seq data from DKO cells (Fig. 2c). The lower total number of CpGs represented in the MeDIP-Seq data from DKO cells compared to that of WT cells reflects the reduced methylation in DKO. Additionally, the MeDIP-Seq data generated from WT and DKO cells exhibited sufficient coverage of CpGs (more than 5X) in relation to the genome (37.23% WT, 27.45% DKO; Fig. 2c). Importantly, the GC content and normalized CpG density of sequenced, non-redundant mapped reads in the WT and DKO MeDIP-Seq libraries were equivalent (Supplementary Fig. 1). This analysis suggest that the differences observed between the MeDIP-Seq libraries are likely a result of the biological differences in the methylation levels between HCT116-WT and –DKO cells, and not due to sequencing and/or enrichment bias.
Figure 2.

Scalability of Ion Torrent-compatible MeDIP-Seq protocol. (a) Global 5-methylcytosine (5mC) content measured as a percentage of the genome in DNA from WT and DKO cells determined by an ELISA assay. (b) Number of peaks identified by MACS v2.1.0 software64 from MeDIP-Seq data in WT and DKO cells. (c) Sequence coverage of genome-wide CpGs for WT and DKO cells on the Ion Torrent Proton sequencer calculated using MEDIPS v1.14.0 software.39 Pie charts illustrate the fraction of CpGs covered by the indicated reads according to their fold-coverage in relation to the total genomic CpG content from MeDIP-Seq libraries of the indicated sample sequenced on the Proton with the total number of non-redundant mapped reads in parentheses. (d) Sequence coverage of genome-wide CpGs for WT and DKO cells in MeDIP-Seq on the Ion Torrent PGM sequencer. Data displayed as in c. (e) Scaled chromosomal view of the 5mC MeDIP-Seq enrichment of methylation over the MX1 gene in WT and DKO cells sequenced on the 2 different Ion Torrent sequencers as indicated. MeDIP-Seq data are displayed as RPM (Reads Per Million mapped reads) below the RefSeq annotation of the gene (blue lines). Methylation enrichment is displayed in gray, with red vertical lines corresponding to areas containing CpGs. Chromosome position and gene orientation are displayed.
The MeDIP-Seq data for HCT116-WT and –DKO cells were generated using the Ion Proton instrument, which uses higher sequencing capacity semiconductor chips (up to 10 Gb DNA) compared to Ion Personal Genome Machine (PGM) chips (up to 1 Gb DNA). To test the scalability of our MeDIP-Seq protocol on the Ion Torrent platform, we compared the results of identical MeDIP libraries for WT and DKO samples sequenced on the PGM instrument with 318 chips to that sequenced on the Ion Proton instrument with P1 chips. We obtained ∼4.5 million non-redundant mapped reads (of ∼170 bp average length) on the PGM using 318 chips and ∼57.0 million non-redundant mapped reads (of ∼115 bp average length) on the Ion Proton instrument using P1 chips, resulting in expected differences of genome coverage (Fig. 2c and d; Supplementary Table 1). This is consistent with the advertised ∼10-fold difference in sequencing capacity between the 318 and P1 chips (Life Technologies). Interestingly, while the coverage obtained on the PGM was less than that produced by the Proton (Fig. 2c and d), the MeDIP-Seq library sequenced on the PGM was able to detect regions of the genome enriched for methylation as observed from the MeDIP-Seq library sequenced on the Proton. As an example, we found similar MeDIP-Seq profiles over the MX1 locus produced by the Proton and PGM (Fig. 2e). These results indicate that the PGM sequencer produces adequate coverage to detect highly enriched regions of methylation and suggest that the Ion Torrent-compatible MeDIP-Seq protocol is scalable simply by using semiconductor chips of varying sequencing capacity suitable to individual experimental needs. These needs may range from testing the quality of MeDIP-Seq libraries or examining methylation in small genomes on low capacity chips to multiplexing samples or examining methylation in large genomes on high capacity chips.
Semiconductor-based MeDIP-Seq reveals expected genome-wide DNA methylation differences between DNMT-proficient and -deficient cells
To visualize normalized enrichment patterns at defined genomic regions of interest, we used the ngs.plot tool40 and compared the MeDIP-Seq inferred genome-wide distribution of DNA methylation from HCT116-WT and –DKO libraries. Consistent with prior observations of the distribution of DNA methylation over genes,8,41,42 we observed depletion of methylation at transcription start sites (TSS) and CpG islands along with enrichment over gene bodies and exons from the MeDIP-Seq profiles of WT and DKO cells (Fig. 3). Although the methylation patterns were similar, we observed significantly lower levels of methylation at TSS and gene bodies in DKO compared to WT cells (highlighted in Fig. 3a and b). In contrast, we observed similar levels of DNA methylation at CpG islands and over all annotated exons in WT and DKO cells (Fig. 3c and d). Interestingly, compared to that of WT cells, we observed reduced levels of DNA methylation in DKO cells at CpG island “shores”43 (highlighted in Fig. 3c) and at exon-intron boundaries (highlighted in Fig. 3d).
Figure 3.
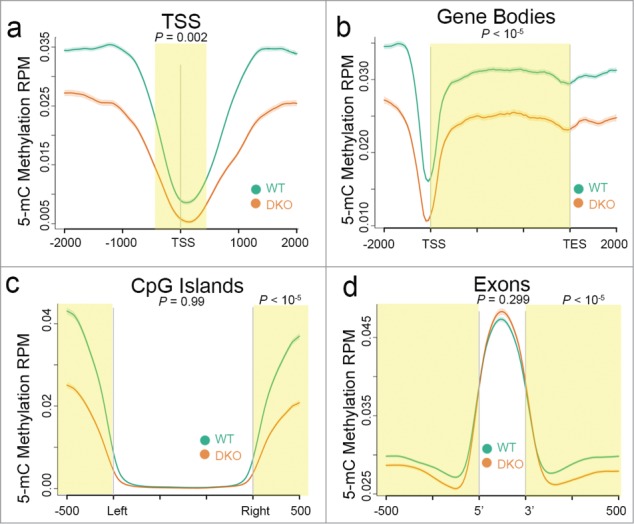
Ion Torrent-compatible MeDIP-Seq detects expected differences in DNA methylation between DNMT-proficient and -deficient cells. Distribution of 5mC methylation over the indicated bp window of all RefSeq annotated TSS (a), gene bodies (b), CpG islands (c), and exons (d). Methylation of WT (green line) and DKO (orange line) HCT116 cells are displayed as mean RPM values with s.e.m. indicated as a semi-transparent shade around the mean curve. Yellow shaded areas highlight regions of significant difference between WT and DKO methylation calculated using a one-sided KS test (P-values shown). In c and d, a KS test was performed using data over the non-shaded areas as well (P-values shown).
To evaluate the sensitivity of our MeDIP-Seq protocol in detecting differentially methylated loci, we compared the MeDIP-Seq enrichment at promoter regions of 4 cancer-relevant genes (RASGRF2, SCNN1B, HOXD1, BHLB9) previously shown to exhibit significant differential DNA methylation between WT and DKO cells as measured by the gold standard bisulfite-PCR sequencing approach.44 We observed differential methylation measured by MeDIP-Seq over the promoter regions of all 4 cancer-relevant genes and confirmed the loss of local DNA methylation in DKO compared to WT cells (Supplementary Fig. 2). In addition to confirming these known differentially methylated genes, we sought to identify other similarly differentially methylated loci using our MeDIP-Seq data set. We found several additional loci that exhibited extensive loss of DNA methylation in DKO compared to WT cells. Examples include the promoter regions of the PAX6 and MEIS1 genes (Supplementary Fig. 3a and b). Using the Infinium HumanMethylation450 Beadchip array (Illumina), we confirmed the differential methylation states between WT and DKO cells at the promoter regions of these genes (Supplementary Fig. 3a and b). To gain insight into the consequence of the local loss of methylation at these gene promoters, we analyzed the expression of PAX6 and MEIS1 by qPCR. Consistent with the role of DNA methylation at gene promoters in mediating transcriptional silencing,45,46 we observed a significant increase in the expression of PAX6 and MEIS1 in DKO relative to that of WT cells (Supplementary Fig. 3c and d). Taken together, these analyses indicate that our Ion Torrent-compatible MeDIP-Seq protocol produced biologically meaningful data, where differential methylation interpreted using this approach is consistent with previous studies and revealed additional DNA methylation-regulated loci.
Array-based analysis independently validates differential methylation inferred by semiconductor-based MeDIP-Seq data
While MeDIP-Seq offers several advantages over other techniques, a major limitation is that this approach does not provide quantifiable methylation data at single-nucleotide resolution.12 Therefore, we sought to confirm the methylation differences detected by MeDIP-Seq between WT and DKO cells by integrating this data with that derived from the Infinium HumanMethylation450 Beadchip array (Illumina). This technology, referred to here as the 450K array, quantitatively measures DNA methylation at over 450,000 single CpG cytosines in the human genome,47 which we applied to HCT116-WT and –DKO cells. Briefly, genomic DNA from these cells was treated with sodium bisulfite (Bis-DNA), hybridized on a Beadchip containing methylated and unmethylated oligos complementary to target Bis-DNA, and imaged to obtain raw intensity values for probes each containing a CpG. Upon processing the data using a standard approach provided by the RnBeads R pipeline package48 and normalizing the resulting β-values obtained for each probe (equivalent to percent CpG methylation), we then stratified the methylation states of all 477,124 quality filtered probes, each representing that of a CpG cytosine, into categories of low (0–29%), intermediate (30–59%), and high (60–100%) levels of methylation (Fig. 4a). In HCT116-WT cells, we observed a bimodal distribution of CpG methylation; of the total CpG cytosines represented on the 450K array, most stratified into the low or high levels of methylation category (28.9% and 63.8%, respectively), whereas only 7.2% exhibited intermediate levels of methylation. In contrast, HCT116-DKO cells displayed a skewed distribution of CpG methylation, where the majority of CpGs on the array (77.7%) exhibited low or intermediate levels of methylation and only 22.3% of CpGs exhibited high levels of methylation (Fig. 4a). We used the Genomic Regions Enrichment of Annotations Tool (GREAT)49 to analyze the over 100,000 CpGs that were more than 50% different between HCT116-WT and –DKO cells and interestingly found that the top GO molecular function terms were related to methyltransferase activity (data not shown). Together, these results provide additional confirmation of the decreased levels of DNA methylation in DKO compared to WT cells, and are consistent with prior data.47,50
Figure 4.

Validation of Ion Torrent-compatible MeDIP-Seq data by integration with the single-nucleotide resolution 450K array. (a) Histogram of the frequency and distribution of CpG cytosine methylation levels of probes on the 450K array in HCT116-WT (green) and -DKO (orange) cells stratified into categories based on their percentage of methylation. (b) Percentage of CpGs on the 450K array (black) overlapping with those underlying MeDIP-Seq peaks (white) of WT cells. (c) Distribution of methylation levels measured in WT cells of all probes on the 450K array that integrate with MeDIP-Seq peaks. (d) Distribution of methylation levels measured in DKO cells of all probes on the 450K array that integrate with MeDIP-Seq peaks in WT cells. (e) Scaled chromosomal view of the MeDIP-Seq enrichment of methylation over the ICR of the SNRPN gene. MeDIP-Seq from WT and DKO cells are displayed as indicated below the RefSeq annotation of SNRPN/SNURF (blue lines) and a CpG island (green). CpG methylation data of each 450K array probe over this region from WT and DKO cells are shown to scale as colored bars representing the degree of methylation (blue, low-; violet, intermediate-; and orange, high-levels of methylation). Percent methylation (calculated from β-values) of these CpGs is shown under each bar. The expanded region below these values shows a scaled depiction of CpG methylation of alleles sequenced after bisulfite-PCR in WT and DKO cells as indicated. Each circle represents a CpG cytosine in the amplicon sequenced, the color of which depicts its methylation state (white, unmethylated; black, methylated). *, the CpG on the 450K array also covered by the bisulfite-PCR amplicon. (f) The average expression of SNURF is significantly elevated in DKO compared to WT cells. Average expression values and s.e.m. from triplicate qPCR are shown. (g) DNA methylation over the SNURF promoter region is significantly higher in WT compared to DKO cells. Using bisulfite-PCR sequencing data described in e, percent methylation was calculated from the sum of methylated CpGs over the total CpGs evaluated. Average methylation values and s.e.m from individual clones are shown. P-values shown in f and g were calculated using 2-sided Student's t-test.
To confirm differential DNA methylation identified by the MeDIP-Seq protocol, we next integrated the qualitative methylation enrichment data derived from the MeDIP-Seq with the quantitative CpG methylation data obtained from the 450K array using the BEDTools v2.18 analysis toolset.51 We identified regions of significant methylation enrichment (peaks) from the WT and DKO MeDIP-Seq datasets and evaluated the CpG composition of sequences underlying these peaks. Of the sequences comprising 166,351 peaks identified in WT cells, we calculated 928,879 CpGs, which was 2.2-fold more than the number of CpGs underlying the 84,404 MeDIP-Seq peaks we identified in HCT116-DKO cells (416,157 CpGs). To determine the percentage of CpGs covered in the MeDIP-Seq data set that were also covered by the 450K array, we generated a BED file containing the genomic positions of CpG sites covered on the Infinium 450K array from an annotation file (Illumina). This analysis revealed that 2.05% of the 928,879 CpGs represented within the MeDIP-Seq peaks identified in HCT116-WT were also represented on the 450K array (Fig. 4b). Next, we evaluated the distribution of methylation for each of the 19,042 CpGs overlapping both MeDIP-Seq and 450K array platforms. From this analysis, we observed that the majority of the overlapping CpGs were highly methylated (mean = 85.18% methylation), indicating that the MeDIP-Seq protocol had captured primarily methylated DNA fragments as anticipated (Fig. 4c). To determine the extent to which the methylation levels of these overlapping CpGs may have been altered in cells with compromised DNMT activity, we examined the level and distribution of methylation for each of these overlapping CpGs in the HCT116-DKO 450K array dataset. Relative to WT, we found that the majority of these 19,042 CpGs were demethylated in DKO (mean = 48.05% methylation), where there were fewer CpGs that exhibited high levels of methylation but a larger number of CpGs that exhibited intermediate to low levels of methylation (Fig. 4d). Results of this analysis indicate that the qualitative differences in DNA methylation levels between WT and DKO cells observed by the Ion Torrent-compatible MeDIP-Seq data are congruent with independent quantitative measurements of methylation at single CpG cytosines.
To further validate that our MeDIP-Seq protocol could detect differences in DNA methylation, we examined MeDIP-Seq profiles over the imprinted control region (ICR) of the SNRPN gene that we previously reported to exhibit differential methylation between HCT116-WT and –DKO cells.7 Our MeDIP-Seq results showed a substantial reduction of methylation in DKO cells compared to that in WT cells at the SNRPN ICR, also a promoter region of SNURF (Fig. 4e). Using the 450K array, we confirmed that the ICR of SNRPN was differentially methylated between WT and DKO cells, where all 6 individual CpGs captured on the array within the ICR were substantially demethylated in DKO cells compared to WT cells (Fig. 4e). To further validate this differential methylation, we performed bisulfite-PCR sequencing that surveyed the methylation state of 7 additional CpGs underlying the SNRPN ICR in addition to overlapping with one CpG represented on the 450K array. Similar to results from the 450K array, we observed that each CpG cytosine (with the exception of one that was unmethylated) over this region exhibited a frequency of ∼40–50% methylation, whereas none of the CpGs were methylated in DKO cells (Fig. 4e). Consistent with our previous observations,7 we hypothesized that the reduced levels of DNA methylation at the promoter region of SNURF in DKO cells would be associated with increased expression of the gene. Indeed, we observed significantly higher levels of SNURF expression in DKO compared to WT cells (Fig. 4f). This increased expression correlated with the substantial reduction of methylation over the promoter of SNURF in DKO relative to WT cells (Fig. 4g) and is consistent with results of PAX6 and MEIS1 (Supplementary Fig. 3).
Semiconductor-based MeDIP-Seq data infers a role for DNA methylation in alternative splicing
We previously described a role for DNA methylation in alternative pre-mRNA splicing and exon definition by integrating whole genome bisulfite sequencing results with RNA-Seq data we generated for IMR90 cells.7 Here, we sought to determine whether MeDIP-Seq data of HCT116-WT and –DKO cells could be used to study the association of DNA methylation in alternative splicing. To do this, we first utilized the Mixture-of-Isoforms (MISO) software52 to analyze our previously published RNA-Seq results sequenced on the HiSeq platform (Illumina) for HCT116-WT and -DKO cells.7 From this approach, we identified 738 known alternatively spliced exons (ASEs) that were aberrantly spliced in DKO relative to WT cells. Of these 738 ASEs, 461 were aberrant exon inclusion events, whereas the remaining 277 were aberrant exon exclusion events (Fig. 5a). Using our MeDIP-Seq data of WT and DKO cells, we examined the distribution of 5mC methylation over these aberrantly spliced exons as well as their flanking 5′ and 3′ constitutively spliced exon neighbors. Consistent with our previously reported results for IMR90 cells7 we observed higher levels of DNA methylation precisely over the ASE and flanking constitutively spliced exons than over intronic sequence in HCT116-WT cells (Fig. 5a). Importantly, we observed a significant difference in the level of DNA methylation specifically over the aberrantly spliced ASEs between WT and DKO cells, a difference more robust than that observed over their surrounding constitutively spliced exon neighbors (Fig. 5a). These results confirm that loss of local DNA methylation in DKO cells at the ASE associates with the aberrant splicing events observed in these DNA methylation-deficient cells. As an example of this relationship, we evaluated the methylation state at the ASE of the FAM204A gene that we previously identified to be aberrantly excluded in DKO cells relative to WT.7 We had also described that the reduced binding of the methyl-CpG binding protein 2 (MeCP2) at the exon was associated with increased local histone acetylation states and exon exclusion of the FAM204A ASE.7 This led us to hypothesize that local loss of DNA methylation at the ASE in DKO cells was responsible for the reduction of MeCP2 binding and thereby aberrant exon exclusion. To test this hypothesis, we compared the MeDIP-Seq profiles of HCT116-WT and –DKO cells over the ASE of FAM204A, which we confirmed was significantly excluded in DKO cells compared to WT cells (Fig. 5b). We observed a total of 230 total reads that overlapped exon-exon junctions over the ASE in HCT116-WT cells, while we detected only 66 total junction reads in DKO cells (Fig. 5b). In agreement, the average percent exon inclusion value (Psi), which accounts for gene expression levels, calculated using the MISO software52 based on RNA-Seq data for FAM204A was significantly higher in WT than in DKO cells (0.82 and 0.49, respectively; Fig. 5b). Consistent with our previous analysis,7 these results reproducibly confirmed the aberrant levels of exon exclusion of the FAM204A ASE in DKO vs. WT cells. To determine whether alterations of the local DNA methylation states may be related to this aberrant exon exclusion event, we then examined the MeDIP-Seq methylation profile over the ASE in HCT116-WT and –DKO cells. Our results showed that methylation was enriched over the ASE in WT cells but was severely depleted over the ASE in DKO cells (highlighted in Fig. 5c). Relative to WT cells, the depletion of methylation in DKO cells occurred precisely at the ASE where a comparatively lower level expression of the exon measured by RNA-Seq was qualitatively apparent (Fig. 5c). These results are consistent with our prior observations7 that the loss of methylation over the ASE in DKO cells is associated with the aberrant exclusion events of FAM204A. The local loss of DNA methylation over the FAM204 ASE linked to aberrant exon exclusion supports a suggested role for DNA methylation in exon inclusion/exclusion.53
Figure 5.
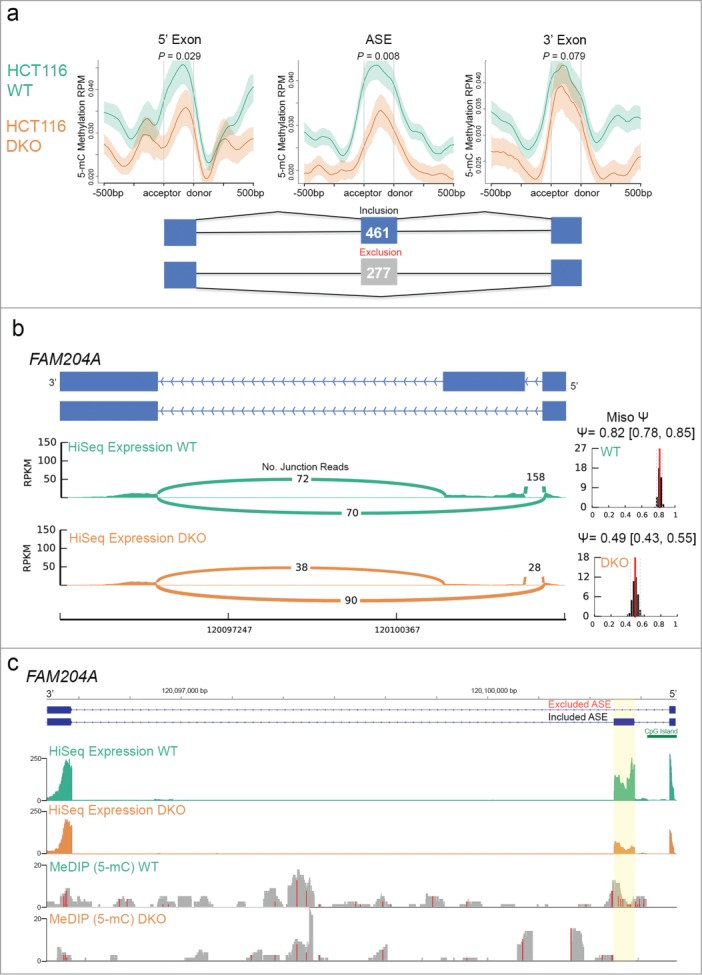
Ion Torrent-compatible MeDIP-Seq confirms a role for DNA methylation in alternative splicing. (a) Distribution of 5mC methylation over alternatively spliced exons (ASE) flanked by constitutively spliced exons (5’ or 3’ exons) in WT and DKO cells. Mean RPM values are displayed over ± 500 bp windows relative to the splice acceptor and donor sites at each of the exons as indicated, with s.e.m. depicted by shaded areas for WT (green) and DKO (orange) profiles. A schematic representation of cassette exons is shown, with the number of exons aberrantly included (blue) and excluded (gray) in WT vs. DKO cells indicated. P-values shown were calculated using one-sided KS test. (b) The ASE of the FAM204A gene (exon 2) is aberrantly excluded in DKO compared to WT cells. Schematic shows the 2 known isoforms for the FAM204A gene (blue bars depict the first 3 exons of the gene in the orientation indicated), under which a Sashimi plot generated by MISO analysis of RNA-Seq data measured as RPKM in WT and DKO cells illustrates the number of exon-exon junction reads as indicated to infer isoform expression. The left graphs show the MISO calculated distribution of a percent exon inclusion score (Psi-value; 95% confidence intervals in brackets) for the FAM204A ASE from WT (top) and DKO (bottom) RNA-Seq data. (c) Demethylation of the FAM204A ASE correlates with its aberrant exclusion. Scaled chromosomal view at the FAM204A gene region (ASE highlighted in yellow) of the indicated WT and DKO distribution of RNA-Seq (top pair) and DNA methylation (bottom pair) data displayed as RPKM. The first 3 exons of the gene are represented (blue bars) with a CpG island in the promoter region indicated (green bar). In the MeDIP-Seq data, red vertical lines correspond to areas containing CpGs.
To independently corroborate the association between local methylation changes and altered pre-mRNA splicing events, we compared the methylation levels of all CpGs on the 450K array that overlapped with 738 aberrantly spliced ASEs determined by MISO analysis of RNA-Seq data from HCT116-WT and –DKO cells. This analysis identified 138 CpGs on the 450K array that fell precisely within aberrantly spliced ASEs. We found that these CpGs in WT cells were generally methylated (mean = 51.9% methylation) but become significantly demethylated (mean = 25.2% methylation) in DKO cells (Supplementary Fig. 4). The results showing differences in the level of DNA methylation observed in a subset of aberrantly spliced ASEs for which 450K array data was available is surprising given the limited number of 450K array probes overlapping ASEs. Together, these results show the utility of MeDIP-Seq on the Ion Torrent platform in robustly detecting DNA methylation patterns at intragenic regions of the genome with implications to its functional role similar to that inferred by DNA methylation data at single-nucleotide resolution.
Semiconductor-based MeDIP-Seq reveals distinct genome-scale distribution of DNA methylation variants in normal human brain
A major advantage of MeDIP-Seq is the ability to distinguish between different variants of DNA methylation by targeting a specific modification [e.g., 5-methylcytosine vs. 5-hydroxymethylcytosine variants] during immunoprecipitation. Although 5mC is the most abundant variant of DNA methylation, emerging studies have reported on the biological significance of the 5hmC variant of methylation.54-57 Therefore, we sought to apply our Ion Torrent-compatible MeDIP-Seq protocol to determine whether this approach can distinguish between 5mC and 5hmC modifications. We chose to study these variant DNA modifications in a postmortem human brain tissue sample as recent studies indicate that brain DNA harbors substantial global levels of 5hmC, albeit lower than that of 5mC.58,59 We used a slightly modified protocol as was applied for 5mC MeDIP-Seq on HCT116 cells that included substituting the 5mC antibody in the immunoprecipitation step with an antibody specific to 5hmC (Diagenode). We first tested the 5hmC antibody specificity by qPCR after immunoprecipitation and found that the recovery of known 5hmC DNA relative to that of known 5mC DNA was ∼19-fold higher (P < 10−5, 2-sided Student's t-test; Supplementary Fig. 5a). We then generated and compared MeDIP-Seq libraries using either antibody with DNA of the same brain tissue sample. Sequenced on Ion Proton P1 chips, the total number of mapped reads from 5mC and 5hmC MeDIP-Seq data was similar (Supplementary Table 1) and the sequencing depth measured in relation to total genome CpG coverage between the 2 libraries were equivalent (Supplementary Fig. 5b). Using an ELISA assay, we observed that the average 5mC level was significantly higher (5.5% methylation) than that of 5hmC (0.63% methylation) in the brain DNA sample, supporting previous reports of 5mC as the predominant variant of methylation59 (Fig. 6a). Moreover, in agreement with a greater proportion of 5mC methylation compared to 5hmC, we identified ∼1.6-fold more 5mC peaks (142,341) than that of 5hmC (87,519) in the MeDIP-Seq libraries of brain using MACS after normalizing to IgG control libraries (Fig. 6b). To determine the extent of overlap between 5mC and 5hmC peaks, we used the BEDTools software51 and observed that 86.3% of the 87,519 total peaks identified in the 5hmC MeDIP-Seq library rarely overlapped with regions covered by 5mC (data not shown). Similarly, we found that the number of CpGs covered by 5mC was higher (∼5X) than that covered by 5hmC and were likewise mostly non-overlapping: peaks identified in 5mC and 5hmC MeDIP-Seq libraries covered a combined total of 2,341,052 CpGs with 79.74% unique to the 5mC library, 16.09% unique to the 5hmC library, and 4.16% in both libraries (Fig. 6c).
Figure 6.
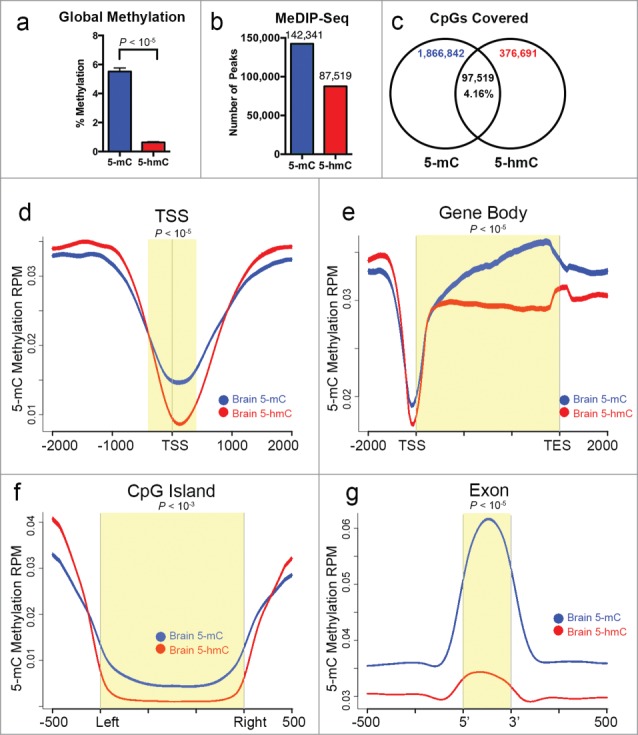
Ion Torrent-compatible MeDIP-Seq accurately distinguishes between variant DNA modifications. (a) Global 5mC (blue bar) content in bulk DNA from a human brain tissue is significantly higher than that of 5hmC (red bar). Percent methylation of the indicated variant modification was measured using an ELISA assay. Mean values of triplicate experiments are shown, with the P-value calculated by 2-sided Student's t-test. (b) Number of peaks identified by MACS v2.1.0 software64 for 5mC and 5hmC variants of DNA methylation in brain. (c) Venn diagram illustrating the indicated total number of CpGs contained in the peaks identified for 5mC and 5hmC, showing the degree of overlap of CpGs (as a percentage of the total in 5mC and 5hmC) between the 2 libraries. Distribution of 5mC and 5hmC methylation in brain over indicated bp window of all RefSeq annotated TSS (d), gene bodies (e), CpG islands (f), and exons (g). For d-g, all mean values from brain 5mC (blue line) and 5hmC (red line) are shown as RPM with s.e.m. displayed as a semi-transparent shade around the mean curve. Yellow shaded areas highlight regions of significant difference between 5mC and 5hmC calculated using a one-sided KS test (P-values shown).
Consistent with the notion that 5mC and 5hmC mark non-overlapping regions of the brain genome, we analyzed the distribution of 5mC and 5hmC over genomic loci and observed that the 2 variant modifications exhibit distinct patterns (Fig. 6d–g). For instance, although 5mC and 5hmC levels both appeared to be depleted precisely over annotated TSS relative to proximal surrounding regions, 5mC levels at TSS remained significantly higher than that of 5hmC (Fig. 6d). Likewise, we observed that while both 5mC and 5hmC levels were higher over gene bodies compared to TSS, 5mC levels progressively increased from the 5′-3′ direction along gene bodies and was significantly higher than that of 5hmC (Fig. 6e). Surprisingly, while 5hmC levels remained relatively stable in gene bodies, we observed a slight increase precisely over transcription end sites (TES) concomitant with a decline in 5mC levels over that region (Fig. 6e). This unusual pattern may suggest a novel role for 5hmC in TES recognition. Similar to TSS, 5mC levels were significantly higher than that of 5hmC over annotated CpG islands- a pattern likely due to the fact that >70% of gene promoters harbor CpG islands.46 Lastly, we observed enrichment of 5mC precisely over annotated exons compared to surrounding introns, which was significantly higher than that of 5hmC (Fig. 6g). Although we and others have previously observed the enrichment of DNA methylation over exons relative to introns,7,60 this novel data indicates that the 5mC variant likely accounts for this enrichment while the 5hmC variant may contribute to a much more limited degree. Together, these results reveal that 5mC and 5hmC variant methylation states are predominantly mutually exclusive, which may implicate their distinct functional roles in the genome.
Cross-platform comparison of 5mC brain MeDIP-Seq data shows comparable genome-wide and gene-specific methylation states
MeDIP-Seq data has so far been exclusively generated from optical-based sequencing platforms. We therefore sought to determine how MeDIP-Seq data generated on a non-optical Ion Torrent sequencer (Ion Proton, Life Technologies) compares to that generated on an optical-based sequencing platform (GAIIx, Illumina). We re-evaluated our previously published Illumina MeDIP-Seq data of postmortem human brain tissue8 alongside Ion Torrent MeDIP-Seq results described here from a different postmortem human brain tissue sample. In general, we observed that both Ion Torrent and Illumina MeDIP-Seq libraries were sequenced to a comparable depth with similar coverage in relation to the full human genome (1.8X and 1.3X, respectively; Supplementary Fig. 6a). We also found that ∼51% of the total number of peaks identified from the Ion Torrent MeDIP-Seq data overlapped with that independently identified from the Illumina MeDIP-Seq data (Supplementary Fig. 6a). These results are possibly due to brain region differences in cell compositions, biological differences between the individual samples from which the MeDIP-Seq libraries were derived, and/or differing resolution of methylation peaks caused in part by different sequencing read lengths. Despite these differences, we observed that the general distribution of 5mC over genes was similar between the 2 MeDIP-Seq data sets (Supplementary Fig. 6b). Likewise, we observed that the methylation states inferred by both libraries at specific loci were in agreement. As examples, we show that the DNA methylation patterns over the ICRs of the imprinted genes SNURF and PEG10 derived from MeDIP-Seq using Illumina or Ion Torrent platforms were highly concordant (Supplementary Fig. 6c and d). Although inter-individual and brain-region variability likely contribute to the differences we observed between the 2 MeDIP-Seq datasets, the genome-wide 5mC MeDIP-Seq data generated on the Ion Torrent platform yielded comparable genome-scale methylation patterns observed by MeDIP-Seq on the Illumina platform.
Discussion
Several technologies enable the evaluation of DNA methylation genome-wide, all of which vary widely in scalability, cost, and time.13 Here, we described a novel application of the Ion Torrent sequencing platform that extends the use of the MeDIP-Seq approach for evaluating DNA methylation genome-wide. This application of the Ion Torrent platform offers an alternative to MeDIP-Seq on optical-based sequencing platforms, taking advantage of the multiple sequencing capacity options, lower operating and start up cost, and faster performance provided by semiconductor-based sequencing technology. Additionally, this protocol creates Ion Torrent MeDIP-Seq libraries that can be utilized with the Ion Torrent Ion Chef System, which offers automated template preparation and chip loading. We demonstrated a novel Ion Torrent MeDIP-Seq protocol that produced valid data comparable to that produced on a well-established optical-based sequencing platform. We also show that the data quality and CpG coverage sufficiently enables studies investigating the functional role of DNA methylation in the genome.
The application of this Ion Torrent-compatible MeDIP-Seq protocol in comparing DNA methylation states between HCT116-WT and -DKO cells lead to several insights. First, we showed that the MeDIP-Seq protocol accurately detected expected differences in DNA methylation between WT and DKO cells. These data support previous reports of significant loss of DNA methylation in DKO relative to WT cells.35,44 Second, we demonstrated that MeDIP-Seq provided sufficient resolution to identify differential methylation at specific loci. Relative to WT, we confirmed a loss of methylation in DKO cells over the imprinted SNRPN gene and identified novel regions of differential methylation associated with expression, including at the promoter regions of PAX6 and MEIS1. Further, we independently validated differential methylation of CpGs at these loci using the 450K array and targeted bisulfite-PCR sequencing. These data indicate that the differential methylation we observed underlie functional regions of the genome, the activities of which are likely regulated by DNA methylation. Finally, the integration of MeDIP-Seq, 450K array, and RNA-Seq data revealed that methylation was depleted over exons that we identified as aberrantly spliced between WT and DKO cells, supporting our previous results indicating that local DNA methylation states, in part, regulate exon recognition and splicing.7 Our integrative approach suggests that MeDIP-Seq can be used as a complementary method to comprehensively and accurately profile DNA modifications genome-wide.
In addition to validating the first application of a MeDIP-Seq protocol on the Ion Torrent platform, we demonstrate its utility to distinguish between and profile the levels of 5mC and 5hmC DNA methylation variants in a normal human brain genome. Relative to 5mC, the 5hmC variant of DNA methylation is poorly understood, having recently been described in embryonic stem cells and brain tissue.54,57 Our MeDIP-Seq data from human brain reveal the mutual exclusivity of these DNA modifications and provides additional support for a role of 5hmC distinct from that of 5mC, including a previously unappreciated potential role at the TES of genes. Future studies that utilize 5hmC MeDIP-Seq as a cost-effective and rapid technique to assess differences between the brain from normal and disease conditions, such as Autism Spectrum Disorder,61 Alzheimer disease,62 or Schizophrenia,63 may lead to further insight into the functional importance of 5hmC. Given the appropriate antibodies, this Ion Torrent MeDIP-Seq approach potentially offers a means to study the functional importance of other poorly understood DNA modification variants such as 5-formylcytosine and 5-carboxycytosine.13
Methods
Cultured cells and postmortem brain tissue specimens
HCT116-WT and HCT116-DKO (DKO1 line) cells were generous gifts from Dr. Bert Vogelstein (Johns Hopkins University). Cells were cultured in McCoy's 5A medium with 10% FBS. Fresh frozen postmortem brain tissue DNA was gifted from Dr. Robert Blanchard (University of Hawaii) that had been obtained from an 8-year-old typically developing male donor (UMB1674) without a defined disorder from the NICHD Brain and Tissue Bank for Developmental Disorders (University of Maryland). The brain tissue specimen was dissected from the subventricular zone region of the lateral ventricles and contained portions of the head of the caudate and corpus callosum.
Genomic DNA isolation
Genomic DNA (1 μg) was isolated from cultured cells and postmortem brain tissue using the AllPrep DNA/RNA kit (Qiagen) according to the manufacturer's recommendations for cells and tissues. DNA concentration was determined using the Qubit DNA Broad Range fluorescence assay (Life Technologies) and Qubit Instrument (Life Technologies).
Ion torrent MeDIP-Seq library construction
MeDIP-Seq libraries for Ion Torrent semiconductor sequencing on the Ion Torrent PGM or Ion Torrent Proton instruments were generated using a modified protocol consisting of Life Technologies’ Ion Plus Fragment Library kit (Catalog # 4471252) in combination with a commercially available 5-methylcytosine (MagMeDIP Kit, Catalog # mc-magme-048) or 5-hydroxymethylcytosine (5hmC Kit, Catalog # AF-110–0016) immunoprecipitation kit (Diagenode). A nonspecific mouse IgG was used for an immunoprecipitation reaction as a negative control. For both 5mC and 5hmC MeDIP-Seq, 1 μg of DNA was sheared to a mean fragment size of 300 bp by sonication with the Covaris M220 Focused-ultrasonicator instrument (Covaris) in a 50 μl microTUBE AFA Fiber Screw-CAP (Covaris). Sonicated DNA was end-repaired, purified with Agencourt AMPure XP reagent beads (Beckman Coulter), and ligated with Ion Torrent compatible sequencing adapters following the standard Ion Plus Fragment Library Kit protocol. Adapter-ligated DNA was purified using Agencourt AMPure XP reagent beads and immunoprecipitated using either a 5-methylcytosine kit (MagMeDIP) or 5-hydroxymethylcytosine (hMeDIP) MeDIP kit according to the manufacturer's protocol. Following either 5mC or 5hmC MeDIP, libraries were size-selected from 200–400 bp on a 2% agarose E-gel (Invitrogen) and extracted using a MinElute Gel DNA extraction kit (Qiagen) according to the manufacturer's instructions. Libraries were then amplified at 18 cycles of PCR (95°C, 15 s; 58°C, 15 s; 70°C, 1 min), purified using MinElute columns (Qiagen), and eluted in 16 μl EB (Qiagen). Libraries were assessed for quality and concentration on an Agilent Bioanalyzer instrument. An aliquot of each library was used to assess enrichment efficiency for control methylated DNA and hydroxymethylated DNA compared to 10% input DNA.
Ion Torrent sequencing
MeDIP libraries were templated using the Ion OneTouch 2 System instrument with either the Ion PGM Template OT2 200 kit for the PGM instrument or the Ion PI Template OT2 Kit v2 for the Proton instrument according to manufacturer's protocols (Life Technologies). Following template reactions, templated libraries were assessed for quality using the Ion Sphere Quality Control Kit (Catalog # 4468656) and Qubit fluorometer (Life Technologies). Templated libraries that passed manufacturer recommended criteria were enriched using the Ion OneTouch ES instrument. Immediately after enrichment, MeDIP libraries were sequenced on either the PGM with 318 chips or Ion Proton with the P1 chips using the Ion PGM 200 Sequencing kit or Ion PtdIns Sequencing 200 Kit v2, respectively, according to instructions provided by the manufacturer (Life Technologies).
MeDIP-Seq analysis and visualization
Ion Torrent sequencing reads were quality-filtered and aligned to the human genome assembly hg19 using Torrent Suite Software's (v4.0) TMAP alignment software. Alignment files were processed into the BAM format and used for further analyses. The MEDIPS R package39 was used to assess the proportion of genome-wide CpGs covered in each sample. MACS v.2.1.0 peak calling software64 was used to identify peaks that contained significant enrichment of methylation. BedTools51 (v2.18) was used to assess the proportion of CpGs contained in peaks identified by MACS and also to integrate 450K array and MeDIP-Seq data. The ngs.plot software program40 was used to plot and compare the enrichment of methylation over annotated genomic regions (e.g., transcription start sites, gene bodies, CpG islands, and exons). Integrative Genomics Viewer (IGV)65 was used to visualize MeDIP-Seq areas of enrichment at defined genomic positions.
Assessment of global DNA methylation levels
Global 5mC or 5hmC levels in DNA from cells or tissue samples were assessed using a commercial ELISA based kit (Zymo Research). DNA (100 ng) for input samples and standard controls of known methylation were denatured at 98°C for 10 min and coated in triplicate reactions in a 96 well plate. Sample wells were incubated according to manufacturer's instructions with a primary anti-5-methylcytosine monoclonal antibody specific to 5mC or 5-hydroxymethylation followed by incubating with an HRP-conjugated secondary antibody (1:1000 dilution). Next, wells were rinsed, developed with a HRP Developer for 30 min, and the absorbance at 405 nm of each well was read on a VersaMax Microplate Reader (Molecular Devices). Percent 5mC or 5hmC methylation for each sample was calculated using a logarithmic second-order regression of the standard curve empirically determined from DNA standards of varying DNA methylation, the degree of which was known (Zymo Research).
Illumina 450K array-based DNA methylation analysis
DNA (WT and DKO; 500 ng per sample) was bisulfite converted using the EZ DNA Methylation kit (Zymo Research) according to the manufacturer's instructions. Bisulfite-converted DNA (4 μl per sample) were randomly assigned to a chip well of the Infinium HumanMethylation450 BeadChip, amplified, hybridized onto the array, and imaged with the Illumina iScan SQ instrument to obtain raw image intensities. Array IDAT intensity data was preprocessed in R using the RnBeads 0.99.10 pipeline analysis package.48 Methylation β-values ranging from 0–1 (corresponding to unmethylated to methylated signal intensity) for each sample were normalized using the methylumi package and subset-quantile within-array normalization (SWAN) method options. Data was filtered for missing probes, SNP-enriched probes, and low detection P-value probes (detection P-value > 0.05). A total of 19,851 probes were removed after filtering.
Bisulfite sequencing
Genomic DNA was bisulfite converted using the EZ DNA methylation kit (Zymo Research) according to the manufacturer's instructions. Bisulfite converted DNA was amplified using PyroMark CpG assay primers (Hs_Cg18506672_01_PM PyroMark CpG assay) specific to the SNURF region. PCR products were cloned into the TOPO-TA cloning vector and used to transform competent E. coli (Invitrogen). Plasmid DNA was isolated from individually selected colonies and at least 10 clones per sample were sequenced using Sanger Sequencing on an ABI 3130XL Genetic analyzer. DNA methylation levels were determined from highly converted sequences (>95 %) using the BiQ Analyzer Software tool.66
RNA extraction and gene expression analysis
Total mRNA was isolated from HCT116-WT and -DKO cells using the AllPrep DNA/RNA kit (Qiagen), quantified on a Nanodrop-2000 instrument (Thermo Scientific), and evaluated for quality using RNA 6000 Nanochips read on a Bioanalyzer 2100 instrument (Agilent). High quality RNA (800 ng) was reverse transcribed into cDNA using random primers, oligo dT, RNAseOUT ribonuclease, and reverse transcriptase M-MLV (Invitrogen). Real-time qPCR reactions for MEIS1 (ABI, Catalog # Hs01017441_m1) and PAX6 (ABI, Catalog # Hs002-40871_m1) were performed in triplicates using 20X TaqMan gene expression assays (Life Technologies) and TaqMan Universal PCR Master Mix (Life Technologies) on a StepOnePlus instrument (Life Technologies) according to the manufacturer's recommendations. SNURF levels were measured using the SYBR Green PCR master mix (Applied Biosystems) with custom primers (5′-GGGATCGCTTACACCTGAGA-3′, forward; 5′-TGGCTTTAACCACCTTTGG-3′, reverse) and analyzed on a StepOnePlus instrument after 28 cycles of PCR with a Tm of 60°C according to manufacturer's instructions (Life Technologies). Gene expression was calculated as a percentage relative to ACTB (ABI, Catalog # HS99999903_m1) using the ΔCt method.
RNA-Seq and alternative splicing analysis
Previously published RNA-Seq data7 for WT and DKO cells was mapped to the Hg19 assembly of the human genome using Tophat2.67 Mapped BAM files for WT and DKO cells were used with Mixture of Isoforms (MISO) software v.0.5.252 to determine the number of alternative splicing events and significant splicing differences between WT and DKO cells. MISO software was also used to generate a Sashimi plot of RNA-Seq data, highlighting exon-exon junctions.
Statistical analysis
The Kolmogorov-Smirnov (KS) non-parametric test was used to statistically evaluate whether methylation distribution of reads for WT cells differed from DKO cells at genomic regions. A two-tailed unpaired Student's t-test was used to evaluate the significance of differences observed in global methylation, gene expression, and methylation data between WT and DKO cells.
Disclosure of Potential Conflicts of Interest
No potential conflicts of interest were disclosed.
Acknowledgements
We thank Dr. Maarit Tiirikainen of the Genome Shared Resources core facility (University of Hawaii, Cancer Center) for support on 450K array experiments and Tina Carvalho of the Biological Electron Microscope Facility (Pacific Biosciences Researcher Center) for support with scanning electron microscopy of semiconductor chips.
Funding
This work was supported in part by National Institutes of Health grants 1P30GM103341, U54MD007584, P20GM103457, and G12MD007601 in JABSOM (AKM) as well as by the Queen's Health Systems Native Hawaiian Health Initiative, Queen's Medical Center (MJC, AKM).
Supplemental Material
Supplemental data for this article can be accessed on the publisher's website.
Authors’ Contributions
MJC and AKM conceived of the protocol, designed the study, and wrote the manuscript. MJC performed MeDIP-Seq and validation experiments. ALJ performed 450K array experiments. XZ analyzed MeDIP-Seq data. WZ performed bisulfite-PCR experiments.
References
- 1. Maunakea AK, Chepelev I, Zhao K. Epigenome mapping in normal and disease States. Circ Res 2010; 107:327-39; PMID:20689072; http://dx.doi.org/ 10.1161/CIRCRESAHA.110.222463 [DOI] [PMC free article] [PubMed] [Google Scholar]
- 2. Robertson KD. DNA methylation and human disease. Nat Rev Genet 2005; 6:597-610; PMID:16136652 [DOI] [PubMed] [Google Scholar]
- 3. Moore SP, Toomire KJ, Strauss PR. DNA modifications repaired by base excision repair are epigenetic. DNA Repair 2013; 12:1152-8; PMID:24216087; http://dx.doi.org/ 10.1016/j.dnarep.2013.10.002 [DOI] [PubMed] [Google Scholar]
- 4. Rossetto D, Truman AW, Kron SJ, Cote J. Epigenetic modifications in double-strand break DNA damage signaling and repair. Clin Cancer Res 2010; 16:4543-52; PMID:20823147; http://dx.doi.org/ 10.1158/1078-0432.CCR-10-0513 [DOI] [PMC free article] [PubMed] [Google Scholar]
- 5. Fu H, Maunakea AK, Martin MM, Huang L, Zhang Y, Ryan M, Kim R, Lin CM, Zhao K, Aladjem MI. Methylation of histone H3 on lysine 79 associates with a group of replication origins and helps limit DNA replication once per cell cycle. PLoS genetics 2013; 9:e1003542; PMID:23754963; http://dx.doi.org/ 10.1371/journal.pgen.1003542 [DOI] [PMC free article] [PubMed] [Google Scholar]
- 6. Kraushaar DC, Jin W, Maunakea A, Abraham B, Ha M, Zhao K. Genome-wide incorporation dynamics reveal distinct categories of turnover for the histone variant H3. 3. Genome Biol 2013; 14:R121; PMID:24176123 [DOI] [PMC free article] [PubMed] [Google Scholar]
- 7. Maunakea AK, Chepelev I, Cui K, Zhao K. Intragenic DNA methylation modulates alternative splicing by recruiting MeCP2 to promote exon recognition. Cell research 2013; 23:1256-69; PMID:23938295; http://dx.doi.org/ 10.1038/cr.2013.110 [DOI] [PMC free article] [PubMed] [Google Scholar]
- 8. Maunakea AK, Nagarajan RP, Bilenky M, Ballinger TJ, D'Souza C, Fouse SD, Johnson BE, Hong C, Nielsen C, Zhao Y, et al. . Conserved role of intragenic DNA methylation in regulating alternative promoters. Nature 2010; 466:253-7; PMID:20613842; http://dx.doi.org/ 10.1038/nature09165 [DOI] [PMC free article] [PubMed] [Google Scholar]
- 9. Bock C. Analysing and interpreting DNA methylation data. Nat Rev Genet 2012; 13:705-19; PMID:22986265 [DOI] [PubMed] [Google Scholar]
- 10. Lister R, Ecker JR. Finding the fifth base: genome-wide sequencing of cytosine methylation. Genome Res 2009; 19:959-66; PMID:19273618; http://dx.doi.org/ 10.1101/gr.083451.108 [DOI] [PMC free article] [PubMed] [Google Scholar]
- 11. Laird PW. Principles and challenges of genomewide DNA methylation analysis. Nat Rev Gen 2010; 11:191-203; PMID:20125086; http://dx.doi.org/ 10.1038/nrg2732 [DOI] [PubMed] [Google Scholar]
- 12. Bock C, Tomazou EM, Brinkman AB, Muller F, Simmer F, Gu H, Jager N, Gnirke A, Stunnenberg HG, Meissner A. Quantitative comparison of genome-wide DNA methylation mapping technologies. Nat Biotechnol 2010; 28:1106-14; PMID:20852634; http://dx.doi.org/ 10.1038/nbt.1681 [DOI] [PMC free article] [PubMed] [Google Scholar]
- 13. Plongthongkum N, Diep DH, Zhang K. Advances in the profiling of DNA modifications: cytosine methylation and beyond. Nat Rev Genet 2014; PMID:25159599 [DOI] [PubMed] [Google Scholar]
- 14. Stevens M, Cheng JB, Li D, Xie M, Hong C, Maire CL, Ligon KL, Hirst M, Marra MA, Costello JF, et al. . Estimating absolute methylation levels at single-CpG resolution from methylation enrichment and restriction enzyme sequencing methods. Genome Res 2013; 23:1541-53; PMID:23804401; http://dx.doi.org/ 10.1101/gr.152231.112 [DOI] [PMC free article] [PubMed] [Google Scholar]
- 15. Bird AP, Southern EM. Use of restriction enzymes to study eukaryotic DNA methylation: I. The methylation pattern in ribosomal DNA from Xenopus laevis. J Mol Biol 1978; 118:27-47; PMID:625056; http://dx.doi.org/ 10.1016/0022-2836(78)90242-5 [DOI] [PubMed] [Google Scholar]
- 16. Frommer M, McDonald LE, Millar DS, Collis CM, Watt F, Grigg GW, Molloy PL, Paul CL. A genomic sequencing protocol that yields a positive display of 5-methylcytosine residues in individual DNA strands. Proc Natl Acad Sci 1992; 89:1827-31; PMID:1542678 [DOI] [PMC free article] [PubMed] [Google Scholar]
- 17. Weber M, Davies JJ, Wittig D, Oakeley EJ, Haase M, Lam WL, Schubeler D. Chromosome-wide and promoter-specific analyses identify sites of differential DNA methylation in normal and transformed human cells. Nat Genet 2005; 37:853-62; PMID:16007088; http://dx.doi.org/ 10.1038/ng1598 [DOI] [PubMed] [Google Scholar]
- 18. Rauch T, Li H, Wu X, Pfeifer GP. MIRA-assisted microarray analysis, a new technology for the determination of DNA methylation patterns, identifies frequent methylation of homeodomain-containing genes in lung cancer cells. Cancer Res 2006; 66:7939-47; PMID:16912168; http://dx.doi.org/ 10.1158/0008-5472.CAN-06-1888 [DOI] [PubMed] [Google Scholar]
- 19. Serre D, Lee BH, Ting AH. MBD-isolated Genome Sequencing provides a high-throughput and comprehensive survey of DNA methylation in the human genome. Nucl Acids Res 2010; 38:391-9; PMID:19906696; http://dx.doi.org/ 10.1093/nar/gkp992 [DOI] [PMC free article] [PubMed] [Google Scholar]
- 20. Cokus SJ, Feng S, Zhang X, Chen Z, Merriman B, Haudenschild CD, Pradhan S, Nelson SF, Pellegrini M, Jacobsen SE. Shotgun bisulphite sequencing of the Arabidopsis genome reveals DNA methylation patterning. Nature 2008; 452:215-9; PMID:18278030; http://dx.doi.org/ 10.1038/nature06745 [DOI] [PMC free article] [PubMed] [Google Scholar]
- 21. Nair SS, Coolen MW, Stirzaker C, Song JZ, Statham AL, Strbenac D, Robinson MD, Clark SJ. Comparison of methyl-DNA immunoprecipitation (MeDIP) and methyl-CpG binding domain (MBD) protein capture for genome-wide DNA methylation analysis reveal CpG sequence coverage bias. Epigenetics 2011; 6:34-44; PMID:20818161; http://dx.doi.org/ 10.4161/epi.6.1.13313 [DOI] [PubMed] [Google Scholar]
- 22. Clark C, Palta P, Joyce CJ, Scott C, Grundberg E, Deloukas P, Palotie A, Coffey AJ. A comparison of the whole genome approach of MeDIP-seq to the targeted approach of the Infinium HumanMethylation450 BeadChip((R)) for methylome profiling. PloS One 2012; 7:e50233; PMID:23209683; http://dx.doi.org/ 10.1371/journal.pone.0050233 [DOI] [PMC free article] [PubMed] [Google Scholar]
- 23. Harris RA, Wang T, Coarfa C, Nagarajan RP, Hong C, Downey SL, Johnson BE, Fouse SD, Delaney A, Zhao Y, et al. . Comparison of sequencing-based methods to profile DNA methylation and identification of monoallelic epigenetic modifications. Nat Biotechnol 2010; 28:1097-105; PMID:20852635; http://dx.doi.org/ 10.1038/nbt.1682 [DOI] [PMC free article] [PubMed] [Google Scholar]
- 24. Rothberg JM, Hinz W, Rearick TM, Schultz J, Mileski W, Davey M, Leamon JH, Johnson K, Milgrew MJ, Edwards M, et al. . An integrated semiconductor device enabling non-optical genome sequencing. Nature 2011; 475:348-52; PMID:21776081; http://dx.doi.org/ 10.1038/nature10242 [DOI] [PubMed] [Google Scholar]
- 25. Glenn TC. Field guide to next-generation DNA sequencers. Mol Ecol Resources 2011; 11:759-69; PMID:21592312 [DOI] [PubMed] [Google Scholar]
- 26. Merriman B, Torrent I, Rothberg JM, Team D. Progress in Ion Torrent semiconductor chip based sequencing. Electrophoresis 2012; 33:3397-417; PMID:23208921; http://dx.doi.org/ 10.1002/elps.201200424 [DOI] [PubMed] [Google Scholar]
- 27. Chen S, Li S, Xie W, Li X, Zhang C, Jiang H, Zheng J, Pan X, Zheng H, Liu JS, et al. . Performance comparison between rapid sequencing platforms for ultra-low coverage sequencing strategy. PloS One 2014; 9:e92192; PMID:24651575; http://dx.doi.org/ 10.1371/journal.pone.0092192 [DOI] [PMC free article] [PubMed] [Google Scholar]
- 28. Vogel U, Szczepanowski R, Claus H, Junemann S, Prior K, Harmsen D. Ion torrent personal genome machine sequencing for genomic typing of Neisseria meningitidis for rapid determination of multiple layers of typing information. J Clin Microbiol 2012; 50:1889-94; PMID:22461678; http://dx.doi.org/ 10.1128/JCM.00038-12 [DOI] [PMC free article] [PubMed] [Google Scholar]
- 29. Elliott AM, Radecki J, Moghis B, Li X, Kammesheidt A. Rapid detection of the ACMG/ACOG-recommended 23 CFTR disease-causing mutations using ion torrent semiconductor sequencing. J Biomol Tech 2012; 23:24-30; PMID:22468138; http://dx.doi.org/ 10.7171/jbt.12-2301-003 [DOI] [PMC free article] [PubMed] [Google Scholar]
- 30. Milani C, Hevia A, Foroni E, Duranti S, Turroni F, Lugli GA, Sanchez B, Martin R, Gueimonde M, van Sinderen D, et al. . Assessing the fecal microbiota: an optimized ion torrent 16S rRNA gene-based analysis protocol. PloS one 2013; 8:e68739; PMID:23869230; http://dx.doi.org/ 10.1371/journal.pone.0068739 [DOI] [PMC free article] [PubMed] [Google Scholar]
- 31. Jagya N, Varma SP, Thakral D, Joshi P, Durgapal H, Panda SK. RNA-seq based transcriptome analysis of hepatitis E virus (HEV) and hepatitis B virus (HBV) replicon transfected Huh-7 cells. PloS One 2014; 9:e87835; PMID:24505321 [DOI] [PMC free article] [PubMed] [Google Scholar]
- 32. Cheng CS, Rai K, Garber M, Hollinger A, Robbins D, Anderson S, Macbeth A, Tzou A, Carneiro MO, Raychowdhury R, et al. . Semiconductor-based DNA sequencing of histone modification states. Nat Commun 2013; 4:2672; PMID:24157732 [DOI] [PMC free article] [PubMed] [Google Scholar]
- 33. Taiwo O, Wilson GA, Morris T, Seisenberger S, Reik W, Pearce D, Beck S, Butcher LM. Methylome analysis using MeDIP-seq with low DNA concentrations. Nat Protoc 2012; 7:617-36; PMID:22402632; http://dx.doi.org/ 10.1038/nprot.2012.012 [DOI] [PubMed] [Google Scholar]
- 34. Bestor TH. The DNA methyltransferases of mammals. Hum Mol Genet 2000; 9:2395-402; PMID:11005794 [DOI] [PubMed] [Google Scholar]
- 35. Rhee I, Bachman KE, Park BH, Jair KW, Yen RW, Schuebel KE, Cui H, Feinberg AP, Lengauer C, Kinzler KW, et al. . DNMT1 and DNMT3b cooperate to silence genes in human cancer cells. Nature 2002; 416:552-6; PMID:11932749; http://dx.doi.org/ 10.1038/416552a [DOI] [PubMed] [Google Scholar]
- 36. Song L, James SR, Kazim L, Karpf AR. Specific method for the determination of genomic DNA methylation by liquid chromatography-electrospray ionization tandem mass spectrometry. Anal Chem 2005; 77:504-10; PMID:15649046; http://dx.doi.org/ 10.1021/ac0489420 [DOI] [PubMed] [Google Scholar]
- 37. Rhee I, Jair KW, Yen RW, Lengauer C, Herman JG, Kinzler KW, Vogelstein B, Baylin SB, Schuebel KE. CpG methylation is maintained in human cancer cells lacking DNMT1. Nature 2000; 404:1003-7; PMID:10801130; http://dx.doi.org/ 10.1038/35010000 [DOI] [PubMed] [Google Scholar]
- 38. Feng J, Liu T, Zhang Y. Using MACS to identify peaks from ChIP-Seq data. Curr Protoc Bioinformatics / editoral board, Andreas D Baxevanis [et al] 2011; Chapter 2:Unit 2 14. [DOI] [PMC free article] [PubMed] [Google Scholar]
- 39. Lienhard M, Grimm C, Morkel M, Herwig R, Chavez L. MEDIPS: genome-wide differential coverage analysis of sequencing data derived from DNA enrichment experiments. Bioinformatics 2014; 30:284-6; PMID:24227674; http://dx.doi.org/ 10.1093/bioinformatics/btt650 [DOI] [PMC free article] [PubMed] [Google Scholar]
- 40. Shen L, Shao N, Liu X, Nestler E. ngs.plot: Quick mining and visualization of next-generation sequencing data by integrating genomic databases. BMC Genomics 2014; 15:284; PMID:24735413; 10.1186/1471-2164-15-284 [DOI] [PMC free article] [PubMed] [Google Scholar]
- 41. Eckhardt F, Lewin J, Cortese R, Rakyan VK, Attwood J, Burger M, Burton J, Cox TV, Davies R, Down TA, et al. . DNA methylation profiling of human chromosomes 6, 20 and 22. Nature genetics 2006; 38:1378-85; PMID:17072317; http://dx.doi.org/ 10.1038/ng1909 [DOI] [PMC free article] [PubMed] [Google Scholar]
- 42. Rollins RA, Haghighi F, Edwards JR, Das R, Zhang MQ, Ju J, Bestor TH. Large-scale structure of genomic methylation patterns. Genome Res 2006; 16:157-63; PMID:16365381; http://dx.doi.org/ 10.1101/gr.4362006 [DOI] [PMC free article] [PubMed] [Google Scholar]
- 43. Irizarry RA, Ladd-Acosta C, Wen B, Wu Z, Montano C, Onyango P, Cui H, Gabo K, Rongione M, Webster M, et al. . The human colon cancer methylome shows similar hypo- and hypermethylation at conserved tissue-specific CpG island shores. Nat Genet 2009; 41:178-86; PMID:19151715; http://dx.doi.org/ 10.1038/ng.298 [DOI] [PMC free article] [PubMed] [Google Scholar]
- 44. Jacinto FV, Ballestar E, Ropero S, Esteller M. Discovery of epigenetically silenced genes by methylated DNA immunoprecipitation in colon cancer cells. Cancer research 2007; 67:11481-6; PMID:18089774; http://dx.doi.org/ 10.1158/0008-5472.CAN-07-2687 [DOI] [PubMed] [Google Scholar]
- 45. Salem CE, Markl ID, Bender CM, Gonzales FA, Jones PA, Liang G. PAX6 methylation and ectopic expression in human tumor cells. Int J Cancer 2000; 87:179-85; PMID:10861471; http://dx.doi.org/ 10.1002/1097-0215(20000715)87:2%3c179::AID-IJC4%3e3.0.CO;2-X [DOI] [PubMed] [Google Scholar]
- 46. Deaton AM, Bird A. CpG islands and the regulation of transcription. Genes Dev 2011; 25:1010-22; PMID:21576262; http://dx.doi.org/ 10.1101/gad.2037511 [DOI] [PMC free article] [PubMed] [Google Scholar]
- 47. Dedeurwaerder S, Defrance M, Calonne E, Denis H, Sotiriou C, Fuks F. Evaluation of the Infinium Methylation 450K technology. Epigenomics 2011; 3:771-84; PMID:22126295; http://dx.doi.org/ 10.2217/epi.11.105 [DOI] [PubMed] [Google Scholar]
- 48. Assenov Y, Muller F, Lutsik P, Walter J, Lengauer T, Bock C. Comprehensive analysis of DNA methylation data with RnBeads. 2013; 11:1138-40; http://dx.doi.org/ 10.1038/nmeth.3115 [DOI] [PMC free article] [PubMed] [Google Scholar]
- 49. McLean CY, Bristor D, Hiller M, Clarke SL, Schaar BT, Lowe CB, Wenger AM, Bejerano G. GREAT improves functional interpretation of cis-regulatory regions. Nature biotechnology 2010; 28:495-501; PMID:20436461; http://dx.doi.org/ 10.1038/nbt.1630 [DOI] [PMC free article] [PubMed] [Google Scholar]
- 50. Sandoval J, Heyn HA, Moran S, Serra-Musach J, Pujana MA, Bibikova M, Esteller M. Validation of a DNA methylation microarray for 450,000 CpG sites in the human genome. Epigenetics 2011; 6:692-702; PMID:21593595; http://dx.doi.org/ 10.4161/epi.6.6.16196 [DOI] [PubMed] [Google Scholar]
- 51. Quinlan AR, Hall IM. BEDTools: a flexible suite of utilities for comparing genomic features. Bioinformatics 2010; 26:841-2; PMID:20110278; http://dx.doi.org/ 10.1093/bioinformatics/btq033 [DOI] [PMC free article] [PubMed] [Google Scholar]
- 52. Katz Y, Wang ET, Airoldi EM, Burge CB. Analysis and design of RNA sequencing experiments for identifying isoform regulation. Nat ethods 2010; 7:1009-15; PMID:21057496; http://dx.doi.org/ 10.1038/nmeth.1528 [DOI] [PMC free article] [PubMed] [Google Scholar]
- 53. Shukla S, Kavak E, Gregory M, Imashimizu M, Shutinoski B, Kashlev M, Oberdoerffer P, Sandberg R, Oberdoerffer S. CTCF-promoted RNA polymerase II pausing links DNA methylation to splicing. Nature 2011; 479:74-9; PMID:21964334; http://dx.doi.org/ 10.1038/nature10442 [DOI] [PMC free article] [PubMed] [Google Scholar]
- 54. Ficz G, Branco MR, Seisenberger S, Santos F, Krueger F, Hore TA, Marques CJ, Andrews S, Reik W. Dynamic regulation of 5-hydroxymethylcytosine in mouse ES cells and during differentiation. Nature 2011; 473:398-402; PMID:21460836; http://dx.doi.org/ 10.1038/nature10008 [DOI] [PubMed] [Google Scholar]
- 55. Lister R, Mukamel EA, Nery JR, Urich M, Puddifoot CA, Johnson ND, Lucero J, Huang Y, Dwork AJ, Schultz MD, et al. . Global epigenomic reconfiguration during mammalian brain development. Science 2013; 341:1237905; PMID:23828890; http://dx.doi.org/ 10.1126/science.1237905 [DOI] [PMC free article] [PubMed] [Google Scholar]
- 56. Tahiliani M, Koh KP, Shen Y, Pastor WA, Bandukwala H, Brudno Y, Agarwal S, Iyer LM, Liu DR, Aravind L, et al. . Conversion of 5-methylcytosine to 5-hydroxymethylcytosine in mammalian DNA by MLL partner TET1. Science 2009; 324:930-5; PMID:19372391; http://dx.doi.org/ 10.1126/science.1170116 [DOI] [PMC free article] [PubMed] [Google Scholar]
- 57. Kriaucionis S, Heintz N. The nuclear DNA base 5-hydroxymethylcytosine is present in Purkinje neurons and the brain. Science 2009; 324:929-30; PMID:19372393; http://dx.doi.org/ 10.1126/science.1169786 [DOI] [PMC free article] [PubMed] [Google Scholar]
- 58. Jin SG, Wu X, Li AX, Pfeifer GP. Genomic mapping of 5-hydroxymethylcytosine in the human brain. Nucleic Acids Res 2011; 39:5015-24; PMID:21378125; http://dx.doi.org/ 10.1093/nar/gkr120 [DOI] [PMC free article] [PubMed] [Google Scholar]
- 59. Szulwach KE, Li X, Li Y, Song CX, Wu H, Dai Q, Irier H, Upadhyay AK, Gearing M, Levey AI, et al. . 5-hmC-mediated epigenetic dynamics during postnatal neurodevelopment and aging. Nature neuroscience 2011; 14:1607-16; PMID:22037496; http://dx.doi.org/ 10.1038/nn.2959 [DOI] [PMC free article] [PubMed] [Google Scholar]
- 60. Choi JK. Contrasting chromatin organization of CpG islands and exons in the human genome. Genome Biol 2010; 11:R70; PMID:20602769; http://dx.doi.org/ 10.1186/gb-2010-11-7-r70 [DOI] [PMC free article] [PubMed] [Google Scholar]
- 61. Zhubi A, Chen Y, Dong E, Cook EH, Guidotti A, Grayson DR. Increased binding of MeCP2 to the GAD1 and RELN promoters may be mediated by an enrichment of 5-hmC in autism spectrum disorder (ASD) cerebellum. Transl Psychiatry 2014; 4:e349; PMID:24448211 [DOI] [PMC free article] [PubMed] [Google Scholar]
- 62. Coppieters N, Dieriks BV, Lill C, Faull RL, Curtis MA, Dragunow M. Global changes in DNA methylation and hydroxymethylation in Alzheimer's disease human brain. Neurobiol Aging 2013; PMID:24387984 [DOI] [PubMed] [Google Scholar]
- 63. Grayson DR, Guidotti A. The dynamics of DNA methylation in schizophrenia and related psychiatric disorders. Neuropsychopharmacology 2013; 38:138-66; PMID:22948975; http://dx.doi.org/ 10.1038/npp.2012.125 [DOI] [PMC free article] [PubMed] [Google Scholar]
- 64. Zhang Y, Liu T, Meyer CA, Eeckhoute J, Johnson DS, Bernstein BE, Nusbaum C, Myers RM, Brown M, Li W, et al. . Model-based analysis of ChIP-Seq (MACS). Genome biol 2008; 9:R137; PMID:18798982; http://dx.doi.org/ 10.1186/gb-2008-9-9-r137 [DOI] [PMC free article] [PubMed] [Google Scholar]
- 65. Thorvaldsdottir H, Robinson JT, Mesirov JP. Integrative Genomics Viewer (IGV): high-performance genomics data visualization and exploration. Briefings bioinfor 2013; 14:178-92; PMID:22517427; http://dx.doi.org/ 10.1093/bib/bbs017 [DOI] [PMC free article] [PubMed] [Google Scholar]
- 66. Bock C, Reither S, Mikeska T, Paulsen M, Walter J, Lengauer T. BiQ Analyzer: visualization and quality control for DNA methylation data from bisulfite sequencing. Bioinformatics 2005; 21:4067-8; PMID:16141249; http://dx.doi.org/ 10.1093/bioinformatics/bti652 [DOI] [PubMed] [Google Scholar]
- 67. Trapnell C, Roberts A, Goff L, Pertea G, Kim D, Kelley DR, Pimentel H, Salzberg SL, Rinn JL, Pachter L. Differential gene and transcript expression analysis of RNA-seq experiments with TopHat and Cufflinks. Nature Protoc 2012; 7:562-78; PMID:22383036; http://dx.doi.org/ 10.1038/nprot.2012.016 [DOI] [PMC free article] [PubMed] [Google Scholar]
Associated Data
This section collects any data citations, data availability statements, or supplementary materials included in this article.