

Abstract
Epithelial ovarian cancer (EOC) is a highly lethal malignancy due to a lack of early detection approaches coupled with poor outcomes for patients with clinically advanced disease. Cancer-testis (CT) or cancer-germline genes encode antigens known to generate spontaneous anti-tumor immunity in cancer patients. CT45 genes are a recently discovered 6-member family of X-linked CT genes with oncogenic function. Here, we determined CT45 expression in EOC and fully defined its epigenetic regulation by DNA methylation. CT45 was silent and hypermethylated in normal control tissues, but a large subset of EOC samples showed increased CT45 expression in conjunction with promoter DNA hypomethylation. In contrast, copy number status did not correlate with CT45 expression in the TCGA database for EOC. CT45 promoter methylation inversely correlated with both CT45 mRNA and protein expression, the latter determined using IHC staining of an EOC TMA. CT45 expression was increased and CT45 promoter methylation was decreased in late-stage and high-grade EOC, and both measures were associated with poor survival. CT45 hypomethylation was directly associated with LINE-1 hypomethylation, and CT45 was frequently co-expressed with other CT antigen genes in EOC. Decitabine treatment induced CT45 mRNA and protein expression in EOC cells, and promoter transgene analyses indicated that DNA methylation directly represses CT45 promoter activity. These data verify CT45 expression and promoter hypomethylation as possible prognostic biomarkers, and suggest CT45 as an immunological or therapeutic target in EOC. Treatment with decitabine or other epigenetic modulators could provide a means for more effective immunological targeting of CT45.
Keywords: cancer germline genes, cancer testis antigen genes, CT45, decitabine, DNA methylation, epithelial ovarian cancer, tumor antigens
Abbreviations
- CNA
copy number alteration
- CT antigen genes
cancer-testis or cancer-germline antigen genes
- DAC
decitabine, 5-Aza-2′-deoxycytidine
- DFS
disease-free survival
- DNMT
DNA methyltransferase
- EOC
epithelial ovarian cancer
- FTE
normal fallopian tube epithelia
- HGSOC
high-grade serous ovarian cancer
- IHC
immunohistochemistry
- NO
bulk normal ovary
- OS
overall survival
- OSE
normal ovary surface epithelia
- RLM-RACE
5′ RNA ligase-mediated rapid amplification of cDNA ends
- RNA-seq
RNA sequencing
- TCGA
The Cancer Genome Atlas
- TMA
tissue microarray
- TSS
transcription start site
Introduction
Ovarian cancer is the seventh most common cancer among women worldwide, and the fifth leading cause of cancer death in US women, with an estimated 14,180 deaths in 2015.1,2 Ninety percent of ovarian cancer is epithelial in origin (EOC).3 The 5 year survival rate for women diagnosed with localized EOC exceeds 90%; however, more than 60% of cases are diagnosed with advanced disease, and the 5 year survival rate for these patients is less than 30%.2 Current standard of care therapy for EOC is cytoreductive surgery followed by combination platinum-taxane chemotherapy.4,5 Disease recurrence occurs in greater than 70% of patients initially responsive to this therapy, and there is no durable cure for recurrent ovarian cancer.5 Achieving an improved understanding of the molecular pathogenesis of EOC is required to develop new biomarkers for early detection as well as novel therapeutic approaches.
Cancer testis (CT) antigen genes, also known as cancer germline genes, are normally expressed only in germ cells, but are aberrantly expressed in a wide range of human cancers.6,7 CT genes frequently encode antigens that can elicit spontaneous immune responses in cancer patients, and this, coupled with their highly restricted expression in normal somatic tissues, makes them ideal immunotherapy targets.6 CT antigen genes are often regulated at the transcriptional level by promoter DNA methylation and other epigenetic mechanisms, including global DNA methylation status, histone acetylation, and nucleosome occupancy.7-13
CT45 is a recently discovered sub-family of CT genes composed of 6 highly related paralogs: CT45A1 (GenBank ID: 541466), CT45A2 (GenBank ID: 728911), CT45A3 (GenBank ID: 441519), CT45A4 (GenBank ID: 441520), CT45A5 (GenBank ID: 441521), and CT45A6 (GenBank ID: 541465).14 CT45 genes are located in a tandem arrangement at chromosome Xq26.3 and encode highly similar mRNAs and proteins, with 98% conservation at the amino acid level, suggesting evolutionary emergence via gene duplications. CT45 is localized in the nucleus, and 2 nuclear localization signals have been defined.15–18 In normal tissues, CT45 mRNA expression was detected with a strong signal in testis and weak signal in lung, heart, spinal cord, and brain,14,17 while the CT45 protein was detected only in primary spermatocytes and gonocytes.15,17 Unlike its highly restricted expression in normal tissues, CT45 is expressed widely in human cancer. In some tumor types, CT45 is expressed in a low proportion of cases, e.g., myeloma (16%),19 lung (13%),17 colon (11%), 16 and breast (5–10%),17,18 while, in other tumor types, CT45 exhibits widespread expression, e.g., seminoma (>90%),16 Hodgkin's lymphoma (>50%) 16,20-22, EOC (37%),17 and diffuse large B-cell lymphoma (22%).22 In addition to its mere expression in cancer, CT45 expression has also been correlated with more aggressive disease. In Hodgkin's lymphoma, CT45 expression correlated with more aggressive histological subtypes, disease symptoms, and advanced stages.21 In multiple myeloma, CT45 expression correlated with poor survival.19 In breast cancer, CT45 expression correlated with high grade, and ER negative, HER2 negative status, suggesting it could be used as a potential immunotherapeutic target in triple negative breast cancer.18
Widespread expression in specific human cancers coupled with increased expression in more aggressive disease states have led to speculation that CT45 may play direct roles in oncogenesis. In support of this hypothesis, 2 recent studies of CT45 provide initial evidence for an oncogenic role for CT45 proteins.23,24 Koop et al. demonstrated that CT45 knockdown in Hodgkin's lymphoma and multiple myeloma cell lines reduced cell adhesion, migration, and invasion.23 Shang et al. similarly found that CT45A1 overexpression increased migration and invasion, promoted epithelial to mesenchymal transition (EMT), and increased xenograft growth and metastasis, using the MCF7 breast cancer cell line as a model.24 In both studies, CT45 was not observed to play a role in cell growth or cell cycle progression, but only in phenotypic characteristics related to metastatic tumor growth.
The mechanism leading to CT45 expression in cancer has not been well defined. One study reported that treatment with decitabine, a DNA hypomethylating agent, induced CT45 expression in HeLa cells and stimulated peripheral blood lymphocytes.16 However, decitabine has both on-target and off-target effects,25 and the promoter methylation status of CT45 genes has not been directly determined, either in samples expressing these genes or in those in which it is silent. Furthermore, demonstration that DNA methylation directly impacts CT45 promoter activity has not been provided. In the current study, we conducted a thorough investigation of the expression of CT45 genes in EOC and normal control tissues, and the role of DNA methylation (both promoter-specific and global methylation) in its regulation. In addition, we analyzed the relationship between CT45 expression, DNA methylation, and EOC disease progression and patient survival.
Results
CT45 mRNA expression in EOC
Due to the high sequence conservation of the 6 CT45 paralogs, we were unable to accurately measure individual CT45 gene expression by RT-PCR (data not shown). Therefore, we used pan-CT45 amplification primers to measure CT45 expression by reverse transcriptase quantitative PCR (RT-qPCR) (Table S1). We first determined CT45 expression in a large set (>100) of EOC samples as well as bulk normal ovary (NO) samples as controls (EOC clinical information shown in Table S2). As shown in Fig. 1A, CT45 was not expressed in NO but was activated in a significant proportion of EOC (25%). The majority of EOC, including those in our sample collection, have serous histology (Table S2). We observed that serous, but not non-serous EOC, expressed significantly higher CT45 as compared to NO (Fig. 1B; Fig. S1). We examined the influence of disease stage and grade on CT45 expression and found that CT45 is activated only in late stage and high-grade disease (Figs. 1C-D). In agreement, CT45 protein levels, as determined by immunohistochemistry (IHC) staining of EOC tissue microarrays (TMA),17 indicated that CT45 protein expression was increased in late stage, high-grade disease (Table S3). Increased CT45 expression correlated with reduced overall survival (OS) in EOC (Fig. 1E). A similar trend was observed for disease-free survival (DFS) but the difference was not statistically significant, likely due to the small set number of patients available for this analysis (Fig. 1F).
Figure 1.

CT45 mRNA expression in EOC and its relation to clinicopathology. (A-D). CT45 mRNA expression relative to 18s rRNA expression is shown for: (A) Bulk normal ovary (NO) and EOC, (B) EOC separated into non-serous and serous histotypes, (C) EOC separated by disease stage, and (D) EOC separated by pathological grade. Gene expression was determined by RT-qPCR. The two-tailed Mann-Whitney test p-value is indicated (*: P<0.05). For A-B, the proportion of EOC and serous samples with elevated CT45 mRNA expression, respectively, is indicated. (E) Overall survival (OS) and (F) disease-free survival (DFS) of EOC patients as a function of CT45 expression. Patients were dichotomized at the median CT45 mRNA expression value. Logrank P-values are indicated.
CT45 copy number alterations do not correlate with CT45 mRNA expression in EOC
Copy number alterations are very common in EOC, and have the capacity to deregulate gene expression.26 As mentioned earlier, CT45 genes are located in a tight arrangement on Xq26.3,14 and coordinated chromosomal gains or amplifications at this region could potentially account for CT45 activation in EOC. To investigate this possibility, we retrieved The Cancer Genome Atlas (TCGA) data, including RNA sequencing (RNA-seq) and copy number alteration (CNA) data for high-grade serous ovarian cancer (HGSOC), the most common EOC subtype.26 Of 265 tumors with RNA-seq data (microarray data was sparse for CT45), 37 (14%) showed activation of at least one CT45 gene (Fig. 2A). This was a lower frequency than we observed by RT-qPCR in our data set, potentially due to the increased sensitivity of RT-qPCR or to our measurement of Pan-CT45 expression (Figs. 1A-B). As expected, CT45 family members showed overlapping expression (Fig. 2A). Among 579 tumors with CNA data, 70% of cases showed a CT45 alteration, and there was complete overlap among the 6 CT45 genes (Fig. S2). The CNAs included roughly equivalent amounts of gains and deletions (Fig. 2B). Notably, CT45 expression did not correlate with copy number status (Fig. 2C; representative data shown for CT45A1). Thus, alternative mechanisms are likely to account for the expression pattern of CT45 observed in EOC.
Figure 2.
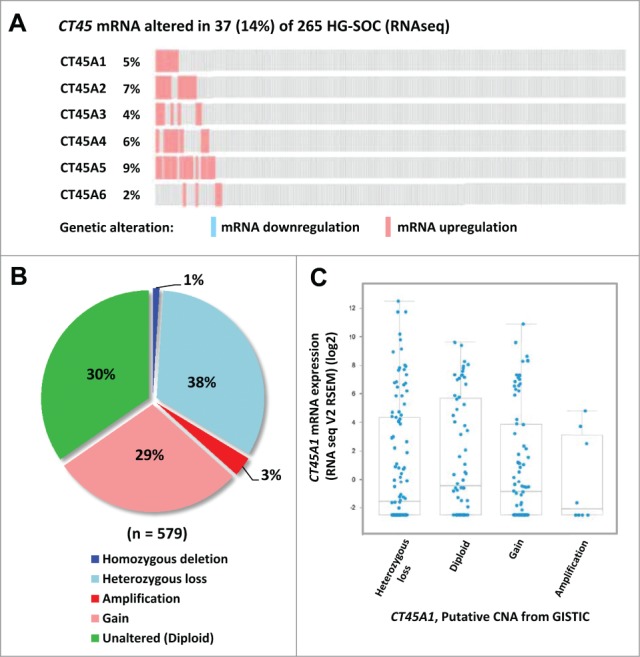
CT45 mRNA expression and copy number alterations (CNA) in EOC. Data were obtained from the TCGA and analyzed using cBioPortal as described in Materials and Methods. (A) CT45 family mRNA expression in 265 HGSOC EOC tumors, as determined by RNA-seq. Upregulation, downregulation, and the percentage of cases altered are indicated. (B) Synopsis of CT45 CNA in 579 HGSOC samples. (C) CT45A1 expression plotted as a function of CT45A1 copy number status. Mann-Whitney t-tests indicated no significant differences in any pairwise group analysis; similar results were obtained for other CT45 family members (data not shown).
5′ end CT45 transcript mapping in normal testis and EOC
The 5′ end and promoter regions of CT45 genes do not contain classical CpG islands27; however, the predicted CT45 transcriptional start sites (TSS) are flanked by several CpG dinucleotides, suggesting that DNA methylation could play a transcriptional regulatory role for these genes (Fig. S3). As a prelude to understanding the potential role of DNA methylation in CT45 regulation, we first mapped the TSS of CT45 genes. Specifically, we used 5′ RNA ligase-mediated rapid amplification of cDNA ends (RLM-RACE) 28,29 to determine the TSS in both normal human testis and an admixture of 2 EOC samples with high CT45 expression. RLM-RACE primer sequences are shown in Table S1. We observed several alternative TSSs for CT45, all but one of which was downstream of the NCBI-predicted TSS (Fig. S3). The variable nature of the CT45 TSS is consistent with the absence of a TATA box in its promoter.30 The TSS detected in normal testis and EOC overlapped, suggesting relative conservation in normal tissues and cancer. Unexpectedly, RLM-RACE additionally detected fusion sequences in EOC, in which the CT45 sequence contained an insert derived from a nearby locus on chromosome X (data not shown). A previous study reported MLL-CT45A2 fusion transcripts in pediatric biphenotypic acute leukemia.31 These observations suggest that the CT45 locus could be a hotspot for cancer-related translocations.
CT45 promoter hypomethylation in EOC
Based on the NCBI-predicted TSS for CT45, as well as that determined by RLM-RACE, we designed bisulfite clonal sequencing primers covering 2 relevant regions of the CT45 promoter region (Table S1; Fig. 3A). We analyzed 5 samples by bisulfite sequencing, including one NO, 2 EOC with high CT45 expression, and 2 EOC with low CT45 expression. We observed highest CT45 methylation of both regions in NO, some hypomethylation in the CT45 negative EOC samples, and the highest degree of hypomethylation in the CT45 positive EOC samples (Figs. 3A-B), suggesting an indirect association between CT45 expression and promoter methylation. To confirm the relationship between promoter hypomethylation and CT45 expression in EOC, we designed high-throughput bisulfite pyrosequencing assays to interrogate 4 CpG sites showing correlation between hypomethylation and expression in bisulfite sequencing (Table S1; Fig. 3A). In these experiments, in addition to using bulk normal ovary (NO) as a control, we also measured CT45 methylation in primary ovarian surface epithelia (OSE) and fallopian tube epithelia (FTE), 2 presumed tissues of origin of EOC. As shown in Figs. 4A-B, OSE and FTE had high CT45 promoter methylation, NO also had high levels of CT45 methylation (however a small degree of hypomethylation was apparent in Region 2), and EOC samples showed heterogeneous methylation, with roughly half (Region 1) or 2-thirds (Region 2) of the samples showing hypomethylation as compared to control tissues. Reduced methylation at Region 2 in bulk NO, as compared to OSE and FTE, may be due to the presence of other cell types, including germ cells, in this tissue (Fig. 4B). Methylation at the 2 different CT45 promoter regions was highly correlated in EOC (Fig. 4C).
Figure 3.
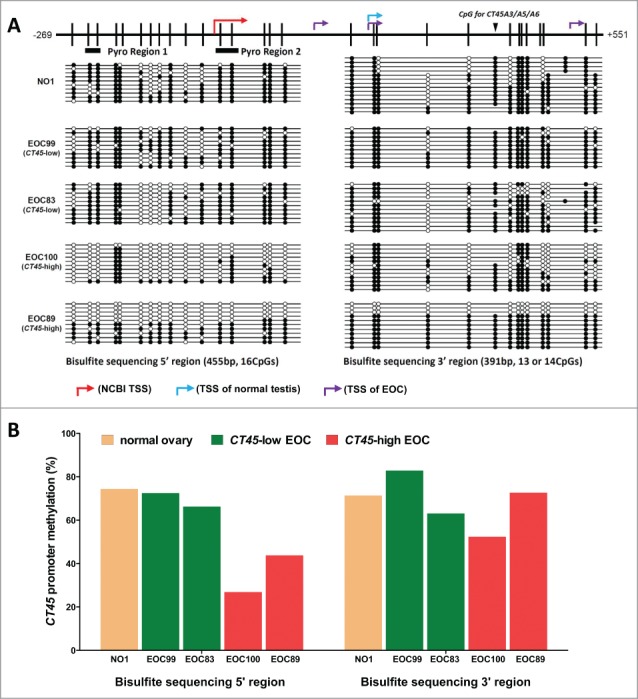
Sodium bisulfite clonal sequencing of the CT45 promoter. (A) Upper: diagram of the CT45 promoter region, indicating CpG sites (black hash marks), predicted or mapped TSS (right broken arrows, see Fig. S3), regions analyzed by pyrosequencing (rectangles; see subsequent figures), and a CpG site differentially present in CT45 family members (inverted triangle). Lower: bisulfite clonal sequencing results for 2 regions of the CT45 promoter. Filled and open circles indicate methylated and unmethylated CpG sites, and each row represents one sequenced allele. Data are shown for a NO sample (NO1), 2 EOC samples with low CT45 expression (EOC99 and EOC83), and 2 EOC samples with high CT45 expression (EOC100 and EOC89). (B) Graphical summary of the data presented in A.
Figure 4.
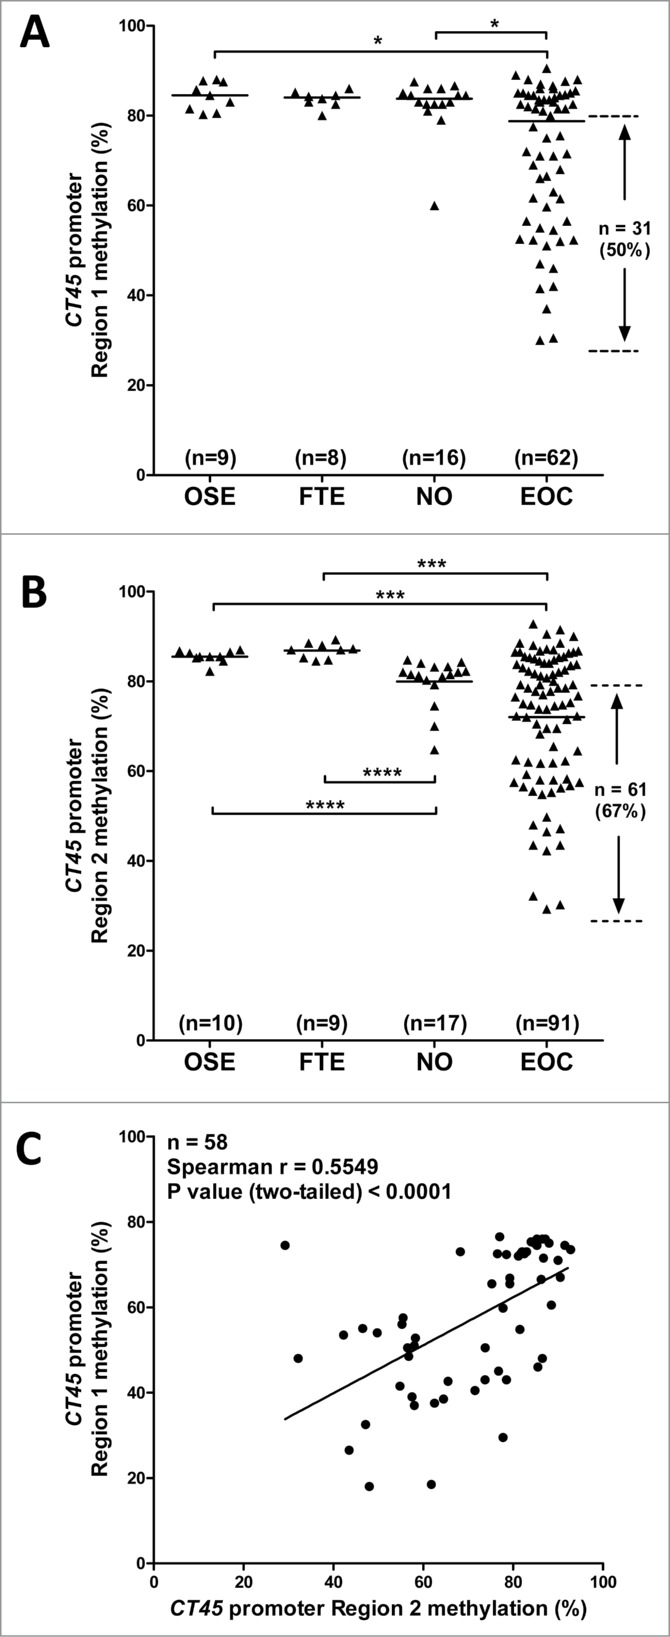
Sodium bisulfite pyrosequencing of the CT45 promoter. The methylation status of 2 different regions of the CT45 promoter (indicated by rectangles in Fig. 3A), were analyzed by sodium bisulfite pyrosequencing in an expanded set of clinical samples including: OSE: normal ovary surface epithelia, FTE: normal fallopian tube epithelia, NO: normal bulk ovary tissue, and EOC: epithelial ovarian cancer. (A) Pyrosequencing data for Region 1. (B) Pyrosequencing data for Region 2. The proportion of EOC samples with CT45 promoter hypomethylation as compared to OSE and FTE are indicated. The two-tailed Mann-Whitney test P-value is indicated (*: P <0.05; ***: P<0.001; ****: P<0.0001). (C) Correlation between CT45 Region 1 and Region 2 methylation in EOC samples. Spearman test results are shown.
CT45 promoter hypomethylation correlates with CT45 mRNA and protein expression in EOC
To determine if CT45 hypomethylation correlates with CT45 expression, we first compared CT45 methylation as determined by pyrosequencing to CT45 mRNA expression as determined by RT-qPCR. For both pyrosequencing regions, we observed a significant inverse correlation with CT45 mRNA expression in EOC (Figs. 5A-B). Second, by comparison to a previously published TMA IHC data set,17 we found that CT45 promoter methylation was significantly lower in EOC samples positive for CT45 protein expression as compared to those negative for CT45 (Figs. 5C-D). Representative examples of negative, weak, and strong CT45 IHC-staining HGSOC tumors are shown in Fig. 5E. The staining pattern observed was nuclear (Fig. 5E).
Figure 5.
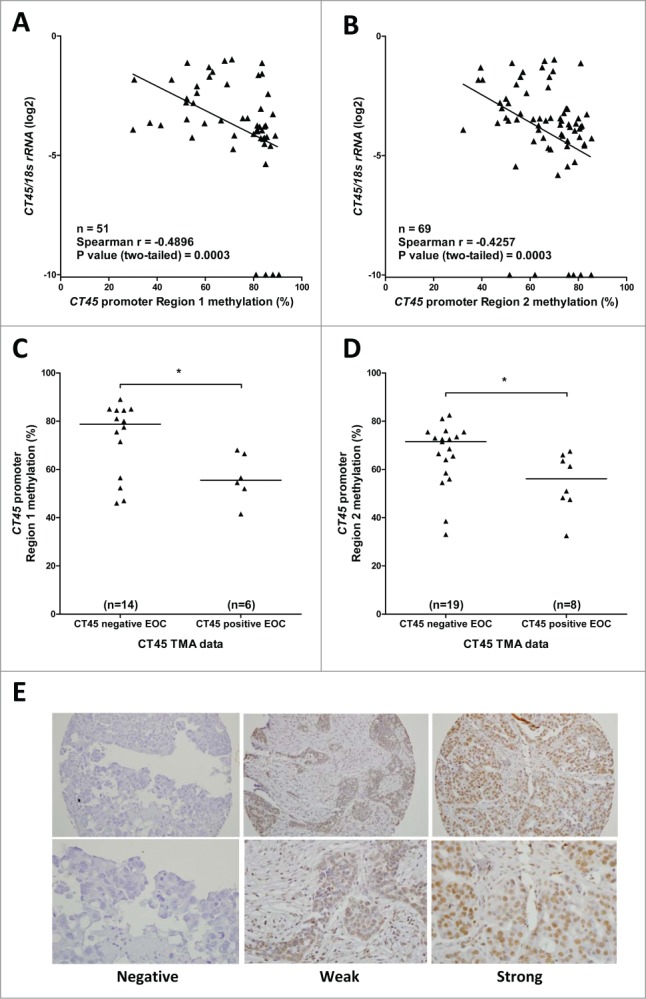
CT45 expression and promoter methylation in EOC. (A-B) CT45 mRNA expression was measured by RT-qPCR and was normalized to 18s rRNA expression. CT45 Region 1 (A) and Region 2 (B) methylation were measured by pyrosequencing. Samples with undetectable CT45 mRNA are plotted on the x-axis. Spearman test results are shown. (C-D) CT45 protein expression was measured by IHC using an EOC TMA as described in Materials and Methods. EOC samples with weak (W), moderate (M), or strong (S) CT45 IHC signal (see Table S1) were classified as CT45-positive, while samples with no CT45 IHC signal were classified as CT45-negative. CT45 Region 1 (C) and Region 2 (D) methylation were measured by pyrosequencing. The two-tailed Mann-Whitney test p-value is indicated (*: P < 0.05). (E) CT45 IHC TMA staining of HGSOC samples, showing representative images of negative, weak, and strong staining. Upper and lower rows show low and high magnification images of 0.6 mm TMA cores, respectively.
CT45 promoter methylation is decreased during disease progression and is associated with reduced survival in EOC patients
We next compared CT45 promoter methylation levels, at both pyrosequencing regions, with clinical stage and histological grade in EOC. While both pyrosequencing regions showed hypomethylation in advanced stage disease, the trend in CT45 promoter Region 1 also met statistical significance (Figs. 6A-B). Similar results were observed for tumor grade (Figs. 6C-D). Thus, similar to CT45 expression (Figs. 1B-C), CT45 promoter hypomethylation correlates with disease progression. With regards to survival, OS was reduced in patients with CT45 promoter hypomethylation, and this difference was highly significant for Region 1 (Figs. 7A-B). Although fewer patients were available for DFS analysis, we observed a trend toward reduced DFS with hypomethylation of CT45 Region 1, and a statistically significant difference for CT45 Region 2 (Figs. 7C-D).
Figure 6.

CT45 promoter methylation and EOC disease progression. (A-B) CT45 promoter Region 1 (A) and Region 2 (B) methylation was determined by pyrosequencing and is plotted as a function of EOC clinical stage. (C-D) CT45 promoter Region 1 (C) and Region 2 (D) methylation was determined by pyrosequencing and is plotted as a function of EOC histological grade. The two-tailed Mann-Whitney test p-value is indicated (*: P < 0.05).
Figure 7.

CT45 promoter methylation and EOC patient survival. (A-B) CT45 promoter Region 1 (A) and Region 2 (B) methylation was determined by pyrosequencing. Patients were dichotomized at the median methylation value and OS was compared using Kaplan Meier analysis and Logrank test. (C-D) Same as A-B except DFS was compared.
CT45 hypomethylation and expression are associated with LINE-1 hypomethylation, and CT45 is co-expressed with other CT antigen genes, in EOC
Prior data from the study of other CT antigen genes indicates connections between global loss of DNA methylation in cancer, promoter demethylation, and gene expression.10,32 To address this critical question in the context of CT45 in EOC, we measured LINE-1 methylation as a surrogate for global methylation status,32 and performed correlation analysis with CT45 promoter methylation as determined by pyrosequencing. As shown in Figs. 8A-B, there was significant direct correlation between CT45 promoter methylation and LINE-1 methylation in EOC. Consistently, there was significant indirect correlation between CT45 expression and LINE-1 methylation (Fig. 8C). These data suggest that transcriptional regulation of CT45 genes in EOC may in part reflect the global DNA methylation status of these tumors. If true, we would expect CT45 expression to correlate with the expression of other CT antigen genes in EOC. Consistent with this idea, analysis of Oncomine datasets confirmed that CT45A3 is co-expressed with other CT antigen genes in EOC, including several known to be regulated by DNA methylation, including MAGE, GAGE, and XAGE genes (Fig. 8D).
Figure 8.

CT45 methylation and expression, LINE-1 methylation, and CT gene co-expression in EOC. (A-B) CT45 promoter Region 1 (A) and Region 2 (B) methylation as compared to LINE-1 methylation in EOC. All methylation data were determined by pyrosequencing. (C) CT45 mRNA expression as compared to LINE-1 methylation in EOC. CT45 mRNA expression was measured by RT-qPCR and was normalized to 18s rRNA expression. Samples with undetectable CT45 mRNA levels were plotted on the x-axis. (D) Oncomine analysis of the genes most closely correlated with CT45A3 in the Bittner ovarian cancer dataset (see Materials and Methods for details). Correlation coefficient and gene name are shown at left. All genes besides C18orf2 are known, or likely (GTSF1), CT genes (see CTDatabase, http://www.cta.lncc.br/).
Decitabine treatment induces CT45 mRNA and protein expression in EOC cell lines
The primary tumor data presented above establishes a correlation between CT45 promoter hypomethylation and CT45 expression, but does not demonstrate causation. To establish a mechanistic connection, we first treated EOC cell lines with varying levels of baseline CT45 expression with the DNA methyltransferase (DNMT) inhibitor decitabine (DAC), a cytosine analog that specifically inhibits DNA methylation by covalently trapping DNMTs to DNA.33 Following DAC treatment, the CT45 promoter was hypomethylated in all treated cell lines (Fig. 9A). Notably, CT45 expression was robustly induced in each of the low expressing cell lines (i.e., IOSE121, OVCAR3, SNU119), with less or no induction in 2 lines with higher basal CT45 expression (A2780, OVSAHO) (Fig. 9A). Importantly, CT45 protein was also induced, albeit to varying levels, in EOC cell lines treated with DAC (Fig. 9B).
Figure 9.
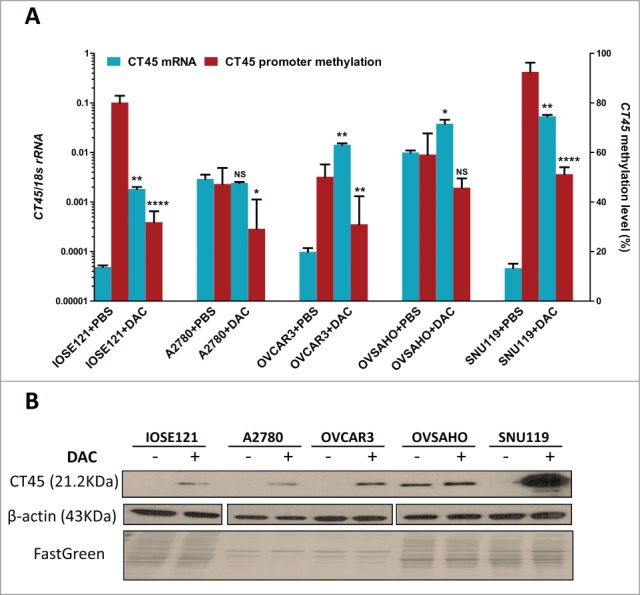
Decitabine-mediated induction of CT45 expression in EOC cells. The indicated cell lines were treated with 1µM decitabine (DAC) for 5 days as described in Materials and Methods. (A) CT45 mRNA expression and CT45 promoter methylation after vehicle (PBS) or DAC treatment. CT45 mRNA expression was determined by RT-qPCR and CT45 promoter methylation was determined by pyrosequencing (average of Region 1 + Region 2 methylation). Data represent mean +/– SD. The two-tailed paired t-test p-value is indicated (*:P < 0.05; **: P < 0.01; ****: P < 0.0001; NS: not significant). (B) Western blot analysis of CT45 protein expression after vehicle (PBS, –) or DAC (+) treatment. β-actin and FastGreen staining are shown as loading controls.
DNA methylation directly represses CT45 promoter activity
To determine whether the inhibitory action of DNA methylation on CT45 expression is direct or indirect, we used a promoter-luciferase reporter approach. We cloned 2 overlapping regions of the CT45 promoter into the CpG-free vector pCpGL-basic,34 which allowed specific methylation of CT45 promoter inserts. A schematic of the CT45A2 promoter (the gene chosen for analysis) along with the position of different methyltransferase acceptor sites is shown in Figure 10A. We tested the activity of both CT45 promoter constructs, in the absence or presence of methylation, using 2 different EOC cell lines, OVCAR3 and A2780. The constructs were either mock-methylated or methylated with one of 3 different CpG methylases that targeted a different number of CpG sites in each construct (Fig. 10A). As shown in Figs. 10B-C, highly similar results were obtained in each EOC cell line, with repression of each promoter construct by DNA methylation. Interestingly, construct 2, but not construct 1, showed maximal repression with either HhaI or HpaII methylation, despite the fact that less CpG sites are methylated by these enzymes as compared to M.SssI (Figs. 10B-C). The in vivo relevance of this observation remains to be determined. Regardless, our data establish DNA methylation as a direct repressor of CT45 promoter activity in EOC cells.
Figure 10.

Effect of DNA methylation on CT45 promoter activity. (A) Diagram of the CT45A2 promoter region and 2 constructs used for promoter activity assay. Black hash marks represent CpG sites. NCBI-predicted and RLM-RACE mapped TSS are indicated by the right broken arrows as in Fig. 3A. The two regions analyzed by pyrosequencing are indicated by black lines. The different methyltransferase acceptor sites are labeled in the legend. (B-C) Luciferase activity data for CT45 promoter constructs in (B) OVCAR3 and (C) A2780 EOC cell lines. Constructs were either mock-methylated or methylated with HhaI, HpaII, or M.SssI prior to transfection as described in Materials and Methods. CT45 firefly luciferase/renilla luciferase (control) enzymatic activity data are shown. Data represent mean ± SD.
Discussion
We examined the role of DNA methylation in the regulation of CT45 expression in EOC. CT45 was expressed in ∼25% of EOC patient samples, and its expression was significantly increased in serous tumors, advanced stage, and high-grade lesions. Promoter hypomethylation of CT45 genes was observed in >50% of EOC samples, and this was exacerbated in advanced disease. Both CT45 expression and promoter hypomethylation were associated with reduced OS and DFS, consistent with their alteration during disease progression, and suggesting potential utility as prognostic biomarkers for EOC.
We validated a link between DNA methylation alterations and CT45 expression in EOC both in clinical samples and EOC cell models. Importantly, CT45 promoter hypomethylation was predictive of both CT45 mRNA and CT45 protein expression. CT45 hypomethylation also showed strong correlation with LINE-1 hypomethylation, providing evidence that CT45 expression is linked to the global hypomethylation process that frequently impacts the cancer genome. While this link could be used to argue that CT45 (and more generally CT antigen) gene expression could be a passenger effect, the emerging oncogenic functions of CT antigen genes, including CT45, alternatively suggests that CT antigen gene expression is under positive selection in cancer.23,24,35 In the case of CT45, recent studies in Hodgkin's disease and breast cancer have established its function in promoting cell migration and invasion, as well as tumor growth and metastasis in vivo.23,24 The mechanism by which CT45 promotes these activities is not well understood, but may include regulation of the mRNA splicing machinery and/or transcriptional activation of critical pro-oncogenic genes such as TWIST.23,24 Our future studies will include investigation of the oncogenic role of CT45 proteins in EOC.
Pharmacological inhibition of DNA methylation induced both CT45 mRNA and protein expression, and site-specific methylation of the CT45 promoter significantly downregulated its activity. Further work is needed to define additional epigenetic and genetic mechanisms that regulate CT45 expression in EOC and other malignancies, and to compare these to the mechanisms regulating other CT antigen genes.7,11 The more frequent occurrence of CT45 hypomethylation than CT45 expression in EOC additionally suggests that there may be a threshold of hypomethylation necessary to elicit CT45 expression. This threshold level could be distinct in each tumor, depending upon the genomic and epigenomic context.
Treatment approaches for advanced EOC are challenged by the emergence of chemotherapy-resistant disease. The immune system may be uniquely suited to combat this problem, by virtue of its recognition of antigens specific to cancer tissues and due to its adaptive nature.36 In this context, the CT antigen gene family is a potentially fruitful immunological target in EOC and other cancers due to their highly restricted pattern of expression and inherent immunogenicity.6 Although spontaneous immune responses to CT45 in cancer patients have not been commonly observed, this does not exclude its potential utility as a cancer vaccination target.17 In support of this idea, we observed a high titer antibody response to CT45 in a recent phase I clinical trial of doxil + decitabine + NY-ESO-1 vaccine in EOC.37 In addition, a recent study of immune modulation using anti-CTLA4 antibody in melanoma patients demonstrated seroconversion to CT45.38 However, our data suggest that CT45 based vaccination approaches might be most beneficial when occurring in the context of co-treatments that induce CT45 expression in vivo. Epigenetic modulators such as decitabine, SGI-110, or similar agents, may be well suited for utilization in this context.39,40 Finally, we point out that the emerging oncogenic functions of CT45 suggest that therapeutics that directly target this protein family could also have utility in cancers that commonly express these proteins, including ER-negative breast cancer and HGSOC. A key advantage of such an approach would be a high level of specificity for tumor cells over normal cells.
Materials and Methods
Human tissues
NO, OSE, FTE, and EOC samples were obtained under IRB-approved protocols at Roswell Park Cancer Institute as described previously.32,41 Cell extracts of clinical samples were prepared as described previously.42 EOC TMAs were constructed at Roswell Park Cancer Institute as described previously.17 EOC clinical characteristics, and the molecular assay data for each sample, are shown in Table S2.
Human cell lines
Human OSE cells immortalized with SV40 large T antigen (IOSE121), and EOC cell lines (A2780, OVCAR3), and their culturing methods were described previously.42 SNU119 HGSOC cells 43 were obtained from the Korean Cell Line Bank and cultivated in RPMI1640 media supplemented with 10% FBS and 1% Pen-Strep. OVSAHO HGSOC cells 44 were obtained from the Japanese Collection of Research Bioresources, and cultivated in RPMI1640 media supplemented with 10% FBS and 1% Pen-Strep.
DNA, RNA, and protein extractions
Genomic DNA was isolated using the Puregene Tissue Kit (Qiagen), total RNA was purified using TRIzol® (Invitrogen), and total protein was extracted using RIPA buffer containing protease inhibitor cocktail (Sigma), according to standard methods.
Decitabine (DAC) treatment
DAC was obtained from Sigma. Cells at ∼20% confluence were treated with 1 μM DAC (day 0), passaged at day 2, re-treated with 1 μM DAC at day 3, and harvested for cell extracts at day 5. PBS was used as the vehicle control. We observed slight to moderate toxicity in EOC cells using this regimen.
RT-qPCR
RNA was processed using the DNA-free kit (Ambion), and cDNA synthesis was performed using the iScript cDNA Synthesis Kit (BioRad). Gene expression was determined by qPCR using a BioRad CFX Connect system and the SYBR green method. Standard curves were prepared using a mixture of cDNA from EOC cell lines. Pan-CT45 mRNA expression was normalized to 18s rRNA. Primer sequences are provided in Table S1.
Western blotting
Equal amounts of protein extracts (20 µg) were loaded per lane, separated using NuPAGE 4–12% Bis-Tris Gels (Invitrogen), and transferred to PVDF membranes (Roche) using the Trans-Blot SD Semi-Dry Transfer Cell (BioRad). Membranes were stained with FastGreen (Fisher) as a loading control. Western blotting was performed according to standard methods using human CT45-specific mouse polyclonal antibody ab169438 (1:100 dilution) (Abcam), and human β-Actin mouse monoclonal antibody sc-47778 (1:2000 dilution) (Santa Cruz).
CT45 protein expression on EOC TMAs
EOC TMAs and CT45 protein staining by IHC was described previously.17 Representative CT45 IHC staining of 0.6 mm TMA cores is shown in Fig. 5E.
RLM-RACE
The TSS of CT45 were determined using the FirstChoice RLM-RACE Kit (Ambion). RNA samples included human normal testis (BioChain Institute), and total RNA from a mixture of 2 different EOC samples (EOC 89, EOC 100). Primer sequences are provided in Table S1. PCR products were analyzed as described previously.42
DNA methylation analyses
Bisulfite clonal sequencing and bisulfite pyrosequencing were used to determine the DNA methylation status of 5′ regions of CT45 genes. Sodium bisulfite conversions utilized the EZ DNA Methylation Kit (Zymo Research). CT45 bisulfite sequencing primers were designed using MethPrimer, and targeted 4 CT45 family members: CT45A2, CT45A3, CT45A4 and CT45A5. Bisulfite pyrosequencing assays were designed based on the CT45A2 sequence, and assay 1 targets CT45A2, A3, A4 and A5; assay 2 targets CT45A2, A3, A4, A5 and A6. LINE-1 methylation was determined using bisulfite pyrosequencing as described previously.8 Primer sequences are provided in Table S1.
CT45 co-expression with other CT antigen genes in EOC
Oncomine (Compendia Bioscience, Ann Arbor, MI) was used to analyze CT45 expression in publically available human microarray data. Data are shown in Fig. 8D for the analysis of CT45A3 co-expression in the Bittner human ovarian cancer data set, which used Affymetrix HG U133 Plus 2.0 arrays to profile 19,574 genes in 241 ovarian cancer samples of diverse histological origin (GEO accession number GSE2109).
CT45 promoter activity
Two CT45 promoter fragments (see Fig. 10A) were amplified using standard methods and cloned into pCR2.1 TOPO vector (Invitrogen). Inserts were then sub-cloned into the CpG-free vector, pCpGL-basic.34 Purified plasmids were methylated in vitro with M.SssI, HpaII, HhaI, or no enzyme (mock), in the presence of S-adenosyl methionine (all enzymes and co-factor obtained from NEB). Methylation efficiency was confirmed by digesting the methylated constructs using endonucleases MspI, McrBC, HhaI, and HpaII (NEB) (data not shown). Cell lines were transiently transfected with 500 ng CT45 firefly luciferase construct + 250 ng renilla luciferase control construct (pRL-TK) (Promega), using Lipofectamine 2000 (Invitrogen). Transfections were carried out in duplicate wells of 24 well plates. Cell extracts were harvested 24–48 hrs post-transfection, and firefly and renilla luciferase activity were measured using the Dual-Luciferase Reporter Assay System (Promega).
Survival analyses
OS was defined as the time between the date of diagnosis and death. Patients who were alive at the time of analysis were censored at the date of last follow-up. DFS was defined as the time between the date of surgery and disease recurrence. Patients who were alive and disease-free were censored at the date of last follow-up. For each molecular marker, samples were dichotomized at the median marker value, and the difference between the 2 groups was compared using Kaplan Meier analysis. The null hypothesis of no difference in the survival distributions was assessed using the Logrank test.
Analysis of CT45 mRNA expression and CNA in TGCA data
TCGA genomic data for HGSOC (Ovarian Serous Cystadenocarcinoma-TCGA, Provisional) was retrieved and analyzed using cBioPortal (data upload March 9, 2015).45,46 The following genomic profiles were analyzed: mutations, putative copy-number alterations from GISTIC using Onco Query Language (OQL), and mRNA expression data (RNA seq V2 RSEM). All parameters were set at default.
Funding
We acknowledge support from NIHRO1CA116674, The Otis Glebe Medical Research Foundation, The Betty J. and Charles D. McKinsey Ovarian Cancer Research Fund, and The Fred & Pamela Buffett Cancer Center (to ARK), the Roswell Park Alliance Foundation, NCI Cancer Center Support Grant P30CA016056, NIHR01CA158318, and RPCI-UPCI Ovarian Cancer SPORE P50CA159981 (to KO), NIHT32CA009476 (CB), and NIHT32CA108456 (SA).
Disclosure of Potential Conflicts of Interest
No potential conflicts of interest were disclosed.
Supplemental Material
Supplemental data for this article can be accessed on the publisher's website.
References
- 1.Ferlay J, Shin HR, Bray F, Forman D, Mathers C, Parkin DM. Estimates of worldwide burden of cancer in 2008: GLOBOCAN 2008. Int J Cancer J Int du Cancer 2010; 127:2893-917; PMID:21351269; http://dx.doi.org/ 10.1002/ijc.25516 [DOI] [PubMed] [Google Scholar]
- 2.Siegel RL, Miller KD, Jemal A. Cancer statistics, 2015. CA Cancer J Clin 2015; 65:5-29; PMID:25559415 [DOI] [PubMed] [Google Scholar]
- 3.Prat J. Staging classification for cancer of the ovary, fallopian tube, and peritoneum. Int J Gynaecol Obstet 2014; 124:1-5; PMID:24219974; http://dx.doi.org/ 10.1016/j.ijgo.2013.10.001 [DOI] [PubMed] [Google Scholar]
- 4.Roett MA, Evans P. Ovarian cancer: an overview. Am Fam Physician 2009; 80:609-16; PMID:19817326 [PubMed] [Google Scholar]
- 5.Romero I, Bast RC Jr. Minireview: human ovarian cancer: biology, current management, and paths to personalizing therapy. Endocrinology 2012; 153:1593-602; PMID:22416079; http://dx.doi.org/ 10.1210/en.2011-2123 [DOI] [PMC free article] [PubMed] [Google Scholar]
- 6.Simpson AJ, Caballero OL, Jungbluth A, Chen YT, Old LJ. Cancer/testis antigens, gametogenesis and cancer. Nat Rev Cancer 2005; 5:615-25; PMID:16034368; http://dx.doi.org/ 10.1038/nrc1669 [DOI] [PubMed] [Google Scholar]
- 7.Akers SN, Odunsi K, Karpf AR. Regulation of cancer germline antigen gene expression: implications for cancer immunotherapy. Future Oncol (London, England) 2010; 6:717-32; PMID:20465387; http://dx.doi.org/ 10.2217/fon.10.36 [DOI] [PMC free article] [PubMed] [Google Scholar]
- 8.Woloszynska-Read A, Mhawech-Fauceglia P, Yu J, Odunsi K, Karpf AR. Intertumor and intratumor NY-ESO-1 expression heterogeneity is associated with promoter-specific and global DNA methylation status in ovarian cancer. Clin Cancer Res 2008; 14:3283-90; PMID:18519754; http://dx.doi.org/ 10.1158/1078-0432.CCR-07-5279 [DOI] [PMC free article] [PubMed] [Google Scholar]
- 9.James SR, Link PA, Karpf AR. Epigenetic regulation of X-linked cancer/germline antigen genes by DNMT1 and DNMT3b. Oncogene 2006; 25:6975-85; PMID:16715135; http://dx.doi.org/ 10.1038/sj.onc.1209678 [DOI] [PubMed] [Google Scholar]
- 10.De Smet C, De Backer O, Faraoni I, Lurquin C, Brasseur F, Boon T. The activation of human gene MAGE-1 in tumor cells is correlated with genome-wide demethylation. Proc Natl Acad Sci U S A 1996; 93:7149-53; PMID:8692960; http://dx.doi.org/ 10.1073/pnas.93.14.7149 [DOI] [PMC free article] [PubMed] [Google Scholar]
- 11.James SR, Cedeno CD, Sharma A, Zhang W, Mohler JL, Odunsi K, Wilson EM, Karpf AR. DNA methylation and nucleosome occupancy regulate the cancer germline antigen gene MAGEA11. Epigenetics 2013; 8:849-63; PMID:23839233; http://dx.doi.org/ 10.4161/epi.25500 [DOI] [PMC free article] [PubMed] [Google Scholar]
- 12.De Smet C, Lurquin C, Lethe B, Martelange V, Boon T. DNA methylation is the primary silencing mechanism for a set of germ line- and tumor-specific genes with a CpG-rich promoter. Mol Cell Biol 1999; 19:7327-35; PMID:10523621 [DOI] [PMC free article] [PubMed] [Google Scholar]
- 13.Cannuyer J, Loriot A, Parvizi GK, De Smet C. Epigenetic hierarchy within the MAGEA1 cancer-germline gene: promoter DNA methylation dictates local histone modifications. PloS one 2013; 8:e58743; PMID:23472218; http://dx.doi.org/ 10.1371/journal.pone.0058743 [DOI] [PMC free article] [PubMed] [Google Scholar]
- 14.Chen YT, Scanlan MJ, Venditti CA, Chua R, Theiler G, Stevenson BJ, Iseli C, Gure AO, Vasicek T, Strausberg RL, et al.. Identification of cancer/testis-antigen genes by massively parallel signature sequencing. Proc Natl Acad Sci U S A 2005; 102:7940-5; PMID:15905330; http://dx.doi.org/ 10.1073/pnas.0502583102 [DOI] [PMC free article] [PubMed] [Google Scholar]
- 15.Rudolph P, Kellner U, Schmidt D, Kirchner V, Talerman A, Harms D, Parwaresch R. Ki-A10, a germ cell nuclear antigen retained in a subset of germ cell-derived tumors. Am J Pathol 1999; 154:795-803; PMID:10079257; http://dx.doi.org/ 10.1016/S0002-9440(10)65326-6 [DOI] [PMC free article] [PubMed] [Google Scholar]
- 16.Heidebrecht HJ, Claviez A, Kruse ML, Pollmann M, Buck F, Harder S, Tiemann M, Dorffel W, Parwaresch R. Characterization and expression of CT45 in Hodgkin's lymphoma. Clin Cancer Res 2006; 12:4804-11; PMID:16914565; http://dx.doi.org/ 10.1158/1078-0432.CCR-06-0186 [DOI] [PubMed] [Google Scholar]
- 17.Chen YT, Hsu M, Lee P, Shin SJ, Mhawech-Fauceglia P, Odunsi K, Altorki NK, Song CJ, Jin BQ, Simpson AJ, et al.. Cancer/testis antigen CT45: analysis of mRNA and protein expression in human cancer. Int J Cancer J Int du Cancer 2009; 124:2893-8; PMID:19296537; http://dx.doi.org/ 10.1002/ijc.24296 [DOI] [PubMed] [Google Scholar]
- 18.Chen YT, Ross DS, Chiu R, Zhou XK, Chen YY, Lee P, Hoda SA, Simpson AJ, Old LJ, Caballero O, et al.. Multiple cancer/testis antigens are preferentially expressed in hormone-receptor negative and high-grade breast cancers. PloS one 2011; 6:e17876; PMID:21437249; http://dx.doi.org/ 10.1371/journal.pone.0017876 [DOI] [PMC free article] [PubMed] [Google Scholar]
- 19.Andrade VC, Vettore AL, Regis Silva MR, Felix RS, Almeida MS, de Carvalho F, Zago MA, Caballero OL, Simpson AJ, Colleoni GW. Frequency and prognostic relevance of cancer testis antigen 45 expression in multiple myeloma. Experimental hematology 2009; 37:446-9; PMID:19211183; http://dx.doi.org/ 10.1016/j.exphem.2008.12.003 [DOI] [PubMed] [Google Scholar]
- 20.Claviez A, Mauz-Körholz C, Heidebrecht H-J, Schellong G, Körholz D, Dörffel W, Parwaresch R, Tiemann M. Cancer/testis antigen CT45 is frequently expressed in Hodgkin's lymphoma and associated with nodular sclerosis subtype and advanced disease ; meeting abstract. Blood 2006; 108:4591 [Google Scholar]
- 21.Claviez A, H.J. H, W. D, R. P, M. T. CT45 expression in pediatric Hodgkin's lymphoma is associated with nodular sclerosis subtpe, presence of B symptoms and advanced disease stages. ; meeting abstract. Haematologica 2007; 92:62; http://dx.doi.org/ 10.3324/haematol.11440 [DOI] [Google Scholar]
- 22.Chen YT, Chadburn A, Lee P, Hsu M, Ritter E, Chiu A, Gnjatic S, Pfreundschuh M, Knowles DM, Old LJ. Expression of cancer testis antigen CT45 in classical Hodgkin lymphoma and other B-cell lymphomas. Proc Natl Acad Sci U S A 2010; 107:3093-8; PMID:20133697; http://dx.doi.org/ 10.1073/pnas.0915050107 [DOI] [PMC free article] [PubMed] [Google Scholar]
- 23.Koop A, Sellami N, Adam-Klages S, Lettau M, Kabelitz D, Janssen O, Heidebrecht HJ. Down-regulation of the cancer/testis antigen 45 (CT45) is associated with altered tumor cell morphology, adhesion and migration. Cell Commun Signal 2013; 11:41; PMID:23758873; http://dx.doi.org/ 10.1186/1478-811X-11-41 [DOI] [PMC free article] [PubMed] [Google Scholar]
- 24.Shang B, Gao A, Pan Y, Zhang G, Tu J, Zhou Y, Yang P, Cao Z, Wei Q, Ding Y, et al.. CT45A1 acts as a new proto-oncogene to trigger tumorigenesis and cancer metastasis. Cell death & disease 2014; 5:e1285; PMID:24901056; http://dx.doi.org/ 10.1038/cddis.2014.244 [DOI] [PMC free article] [PubMed] [Google Scholar]
- 25.Karpf AR, Jones DA. Reactivating the expression of methylation silenced genes in human cancer. Oncogene 2002; 21:5496-503; PMID:12154410; http://dx.doi.org/ 10.1038/sj.onc.1205602 [DOI] [PubMed] [Google Scholar]
- 26.Integrated genomic analyses of ovarian carcinoma. Nature 2011; 474:609-15; PMID:21720365; http://dx.doi.org/ 10.1038/nature10166 [DOI] [PMC free article] [PubMed] [Google Scholar]
- 27.Deaton AM, Bird A. CpG islands and the regulation of transcription. Genes Dev 2011; 25:1010-22; PMID:21576262; http://dx.doi.org/ 10.1101/gad.2037511 [DOI] [PMC free article] [PubMed] [Google Scholar]
- 28.Liu X, Gorovsky MA. Mapping the 5' and 3' ends of Tetrahymena thermophila mRNAs using RNA ligase mediated amplification of cDNA ends (RLM-RACE). Nucleic acids Res 1993; 21:4954-60; PMID:8177745; http://dx.doi.org/ 10.1093/nar/21.21.4954 [DOI] [PMC free article] [PubMed] [Google Scholar]
- 29.Maruyama K, Sugano S. Oligo-capping: a simple method to replace the cap structure of eukaryotic mRNAs with oligoribonucleotides. Gene 1994; 138:171-4; PMID:8125298; http://dx.doi.org/ 10.1016/0378-1119(94)90802-8 [DOI] [PubMed] [Google Scholar]
- 30.Smale ST. Transcription initiation from TATA-less promoters within eukaryotic protein-coding genes. Biochimica et biophysica acta 1997; 1351:73-88; PMID:9116046; http://dx.doi.org/ 10.1016/S0167-4781(96)00206-0 [DOI] [PubMed] [Google Scholar]
- 31.Cerveira N, Meyer C, Santos J, Torres L, Lisboa S, Pinheiro M, Bizarro S, Correia C, Norton L, Marschalek R, et al.. A novel spliced fusion of MLL with CT45A2 in a pediatric biphenotypic acute leukemia. BMC Cancer 2010; 10:518; PMID:20920256; http://dx.doi.org/ 10.1186/1471-2407-10-518 [DOI] [PMC free article] [PubMed] [Google Scholar]
- 32.Woloszynska-Read A, Zhang W, Yu J, Link PA, Mhawech-Fauceglia P, Collamat G, Akers SN, Ostler KR, Godley LA, Odunsi K, et al.. Coordinated cancer germline antigen promoter and global DNA hypomethylation in ovarian cancer: association with the BORIS/CTCF expression ratio and advanced stage. Clin Cancer Res 2011; 17:2170-80; PMID:21296871; http://dx.doi.org/ 10.1158/1078-0432.CCR-10-2315 [DOI] [PMC free article] [PubMed] [Google Scholar]
- 33.Egger G, Liang G, Aparicio A, Jones PA. Epigenetics in human disease and prospects for epigenetic therapy. Nature 2004; 429:457-63; PMID:15164071; http://dx.doi.org/ 10.1038/nature02625 [DOI] [PubMed] [Google Scholar]
- 34.Klug M, Rehli M. Functional analysis of promoter CpG methylation using a CpG-free luciferase reporter vector. Epigenetics 2006; 1:127-30; PMID:17965610; http://dx.doi.org/ 10.4161/epi.1.3.3327 [DOI] [PubMed] [Google Scholar]
- 35.Whitehurst AW. Cause and consequence of cancer/testis antigen activation in cancer. Ann Rev Pharmacol Toxicol 2014; 54:251-72; PMID:24160706; http://dx.doi.org/ 10.1146/annurev-pharmtox-011112-140326 [DOI] [PubMed] [Google Scholar]
- 36.Odunsi K, Sabbatini P. Harnessing the immune system for ovarian cancer therapy. Am J Reproduct Immunol 2008; 59:62-74; PMID:18154597; http://dx.doi.org/ 10.1111/j.1600-0897.2007.00560.x [DOI] [PubMed] [Google Scholar]
- 37.Odunsi K, Matsuzaki J, James SR, Mhawech-Fauceglia P, Tsuji T, Miller A, Zhang W, Akers SN, Griffiths EA, Miliotto A, et al.. Epigenetic potentiation of NY-ESO-1 vaccine therapy in human ovarian cancer. Cancer Immunol Res 2014; 2:37-49; PMID:24535937; http://dx.doi.org/ 10.1158/2326-6066.CIR-13-0126 [DOI] [PMC free article] [PubMed] [Google Scholar]
- 38.Postow MA, Luke JJ, Bluth MJ, Ramaiya N, Panageas KS, Lawrence DP, Ibrahim N, Flaherty KT, Sullivan RJ, Ott PA, et al.. Ipilimumab for patients with advanced mucosal melanoma. The oncologist 2013; 18:726-32; PMID:23716015; http://dx.doi.org/ 10.1634/theoncologist.2012-0464 [DOI] [PMC free article] [PubMed] [Google Scholar]
- 39.Srivastava P, Paluch BE, Matsuzaki J, James SR, Collamat-Lai G, Taverna P, Karpf AR, Griffiths EA. Immunomodulatory action of the DNA methyltransferase inhibitor SGI-110 in epithelial ovarian cancer cells and xenografts. Epigenetics 2015; 10:237-46; PMID:25793777 [DOI] [PMC free article] [PubMed] [Google Scholar]
- 40.Karpf AR. A potential role for epigenetic modulatory drugs in the enhancement of cancer/germ-line antigen vaccine efficacy. Epigenetics 2006; 1:116-20; PMID:17786175; http://dx.doi.org/ 10.4161/epi.1.3.2988 [DOI] [PMC free article] [PubMed] [Google Scholar]
- 41.Akers SN, Moysich K, Zhang W, Collamat Lai G, Miller A, Lele S, Odunsi K, Karpf AR. LINE1 and Alu repetitive element DNA methylation in tumors and white blood cells from epithelial ovarian cancer patients. Gynecol Oncol 2014; 132:462-7; PMID:24374023; http://dx.doi.org/ 10.1016/j.ygyno.2013.12.024 [DOI] [PMC free article] [PubMed] [Google Scholar]
- 42.Woloszynska-Read A, James SR, Link PA, Yu J, Odunsi K, Karpf AR. DNA methylation-dependent regulation of BORIS/CTCFL expression in ovarian cancer. Cancer Immun 2007; 7:21; PMID:18095639 [PMC free article] [PubMed] [Google Scholar]
- 43.Yuan Y, Kim WH, Han HS, Lee JH, Park HS, Chung JK, Kang SB, Park JG. Establishment and characterization of human ovarian carcinoma cell lines. Gynecol Oncol 1997; 66:378-87; PMID:9299249; http://dx.doi.org/ 10.1006/gyno.1997.4785 [DOI] [PubMed] [Google Scholar]
- 44.Yanagibashi T, Gorai I, Nakazawa T, Miyagi E, Hirahara F, Kitamura H, Minaguchi H. Complexity of expression of the intermediate filaments of six new human ovarian carcinoma cell lines: new expression of cytokeratin 20. Br J Cancer 1997; 76:829-35; PMID:9328139; http://dx.doi.org/ 10.1038/bjc.1997.471 [DOI] [PMC free article] [PubMed] [Google Scholar]
- 45.Gao J, Aksoy BA, Dogrusoz U, Dresdner G, Gross B, Sumer SO, Sun Y, Jacobsen A, Sinha R, Larsson E, et al.. Integrative analysis of complex cancer genomics and clinical profiles using the cBioPortal. Sci Signal 2013; 6:pl1; PMID:23550210; http://dx.doi.org/ 10.1126/scisignal.2004088 [DOI] [PMC free article] [PubMed] [Google Scholar]
- 46.Cerami E, Gao J, Dogrusoz U, Gross BE, Sumer SO, Aksoy BA, Jacobsen A, Byrne CJ, Heuer ML, Larsson E, et al.. The cBio cancer genomics portal: an open platform for exploring multidimensional cancer genomics data. Cancer Dis 2012; 2:401-4; PMID:22588877; http://dx.doi.org/ 10.1158/2159-8290.CD-12-0095 [DOI] [PMC free article] [PubMed] [Google Scholar]
Associated Data
This section collects any data citations, data availability statements, or supplementary materials included in this article.