

Abstract
Aggregation is a common problem affecting biopharmaceutical development that can have a significant effect on the quality of the product, as well as the safety to patients, particularly because of the increased risk of immune reactions. Here, we describe a new high-throughput screening algorithm developed to classify antibody molecules based on their propensity to aggregate. The tool, constructed and validated on experimental aggregation data for over 500 antibodies, is able to discern molecules with a high aggregation propensity as defined by experimental criteria relevant to bioprocessing and manufacturing of these molecules. Furthermore, we show how this tool can be combined with other computational approaches during early drug development to select molecules with reduced risk of aggregation and optimal developability properties.
Keywords: aggregation prediction, monoclonal antibody, aggregation, developability assessment, biotherapeutics
Abbreviations
- IgG
immunoglobulin G
- CDR
complementarity determining region
- VH
heavy chain variable region
- VL
light chain variable region
- CH1
heavy chain constant domain
- CL
light chain constant domain
- Fv
fragment variable
- Fab
fragment antigen-binding
- ELISA
enzyme-linked immunosorbent assay
- SE-HPLC
size exclusion high pressure liquid chromatography
- ODA
oligomer detection assay
Introduction
The biopharmaceutical industry is currently affected by the increasing cost of drug development combined with a reduction in the productivity of research and development. Only a small fraction of drug candidates that enter development are commercialized. Such high drug attrition is due to many factors, including efficacy, pharmacology, safety and costs of manufacturing. Most biotherapeutic candidates will fail during the pre-clinical and clinical stages of development, i.e., the so-called translational gap of pharmaceutical development. New high-throughput de-risking approaches, which could be applied early in the drug development cycle, are needed to facilitate early assessment and identification of potential issues in order to reduce failure in later stages of development.1
Protein aggregation, commonly encountered problem during biopharmaceutical development, has the potential to occur at different stages of the manufacturing and development processes, such as during fermentation, purification, formulation, fill-finish and storage. Aggregation potentially effects not only the manufacturing process, but also the target product profile, product efficacy, delivery and, critically, patient safety. Protein aggregates have been reported to contribute to cases of immune reactions in patients.2,3 These aggregates can manifest themselves as reversible oligomers, subvisible or visible particles, or as precipitates. The protein aggregation process is driven by a number of factors, including amino acid composition and sequence, environmental factors such as pH, concentration, buffers/excipients and shear-forces during processes used for protein production, as well as final formulation and storage conditions.4
A variety of in silico predictive tools have been developed in recent years in an attempt to predict the aggregation risks in biopharmaceuticals. Such tools have utilized a number of different approaches, including semi-empirical methodologies to link the experimental observation of aggregation to protein physico-chemical properties, structure-based approaches to try to understand amyloid formation from 3-dimensional structures, or models based on assumptions of parameters suspected to define aggregation of proteins. Recent developments in aggregation predictive tools have been reviewed elsewhere.5,6
Most of the currently available aggregation prediction tools have been primarily developed around specific aggregation pathways, either β-strand amyloid aggregation or aggregation through hydrophobic surface patches. While these tools are suitable to detect and re-design specific areas in a protein that could be involved in specific types of aggregation, they are less well suited to the quantitative or qualitative prediction of an aggregation risk for complex biopharmaceutical proteins. Aggregation hot-spot detection for a specific aggregation pathway may be sufficient when comparing and selecting candidates from a pool of similar proteins that are known to have an aggregation problem; however, the question remains whether these methods are applicable to rank therapeutically relevant proteins, such as antibodies. Some aggregation hot-spot methods have been applied specifically to antibodies,7 most notably the Developability Index (DI) tool based on the spatial aggregation propensity (SAP) concept,8 which has been used to screen and rank antibodies according to their aggregation propensity.9 The tool was developed and validated using long-term stability data of 12 antibodies; however, the requirement for a protein structure or a structural homology model for the application of this tool can be a limitation.
The degree of predictability of the tools is linked to the experimental systems and the number of data points utilized for their development and validation. Many of the existing predictive computational tools were developed and validated using a very limited number of experimental measurements.
Here, we present a new in silico tool for the prediction of aggregation risk for antibodies. The tool was developed and validated using experimental measurements of aggregation for over 500 antibodies. The emphasis of this tool is on intrinsic aggregation propensity, and, although aggregation depends both on the intrinsic aggregation propensity of the protein itself and on surrounding environmental factors, the fundamental reason why some antibodies aggregate and others do not is ultimately encoded by the amino acid sequence.
The challenge of the expression and characterization of such a large number of antibodies in an efficient manner, with minimal operational variability and with limited sample consumption, was addressed by using high-throughput methods for antibody expression and characterization.10 The Duetz system,11 a miniaturized platform for the rapid culture and handling of large numbers of variants, was used for the transient expression of antibodies. Transient expression was used to minimize bias linked to clonal selection or cell survival after stable transfection. This approach also made it possible to test hundreds of samples in comparable, standardized conditions.
Protein aggregation was assessed using the Oligomer Detection Assay (ODA) developed in our laboratory,12 as well as using standard SE-HPLC methods. The ODA is based on standard immunoassay technologies and can be utilized to establish a comparison between aggregation levels of multiple antibodies in a high-throughput manner. Furthermore, in our internal assays ODA has been shown to recognize different aggregate species, and therefore show reduced ‘structural bias’ compared to other analytical approaches currently used in the industry. To our knowledge, this is the first example of an aggregation prediction tool that has been developed on such a large volume of experimental data collected using the same experimental protocols.
The aggregation model was constructed using statistical modeling and machine-learning techniques linking the experimental aggregation data with physico-chemical parameters describing the amino acid sequences of antibodies. The resulting model provides qualitative prediction of aggregation risk for antibodies (High or Low risk of aggregation) using the primary sequence of antibodies as input. We demonstrate here the accuracy achieved by this model and its excellent performance when applied to prediction of aggregation risk for antibodies.
This aggregation prediction tool can be used early in the drug development process to enable ranking and selection of leads with reduced risk of aggregation. The application of the tool requires only the antibody amino acid sequence and offers a high-throughput method for an early aggregation screening assessment. We present an example of the application of this tool to the selection of antibody variants during an engineering program. In this example, the aggregation prediction is successfully used in combination with in silico immunogenicity prediction to screen and select antibody variants with reduced risk of aggregation and immunogenicity to progress to in vitro expression and characterization.
Results
Antibody set design
For a computational statistical model to be truly predictive, it should be trained on a large and diverse dataset. The antibody sequences used in this study originated from 2 distinct sources. The first group of antibodies were designed in-house using representatives of the 6 most common heavy chain families and members of the 8 most common light chain families (κ and λ), taking all possible combinations of heavy and light chains. All variable domain families were engineered with different complementarity-determining regions (CDR3s) varying in amino acid composition and length to explore the specific effect of this region. We refer to this group, which consisted of 288 κ and 288 λ antibodies, as ‘design’ antibodies. The second group contained 376 combinations of different light and heavy chains based on 108 unique antibody Fvs, mainly human and humanized, collected from the Protein Data Bank (PDB)13 and other sources;14 this group is referred to as ‘PDB’ antibodies. The ‘PDB’ set includes some commercialized therapeutic antibodies.
A diverse subset of sequences was then selected from these groups to create a wide domain of applicability for the resulting model, while reducing oversampling due to sequence redundancy. The selection was performed using a hierarchical clustering algorithm in the amino acid sequence space. The final set of selected sequences consisted of 341 antibodies with κ light chain and 131 antibodies with λ light chain. In more detail, this set included 269 ‘PDB’ and 72 ‘design’ κ antibodies and 96 ‘PDB’ and 35 ‘design’ λ antibodies, respectively. The selected 472 antibodies were then expressed and characterized under the same experimental conditions. Figure 1 shows counts of representatives of heavy and light chain germline families in the final antibody set. The diversity of the set is illustrated by Figure 2, which shows the antibody sequences in the space of 2 principal components; the principal component analysis was performed based on a sequence distance measure.
Figure 1.
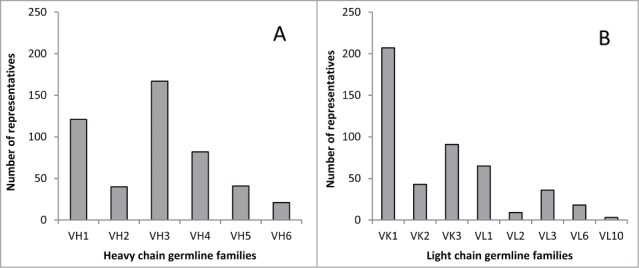
Counts of representatives of germline families in the antibody set. (A) heavy chain germline families, (B) κ and λ light chain germline families.
Figure 2.
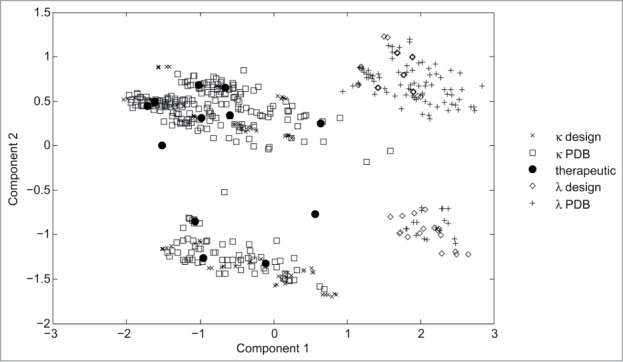
The antibody sequences are plotted in the space of 2 principal components. The principal component analysis was performed based on sequence distance measure. Each marker corresponds to an antibody sequence. Crosses denote κ ‘design’ subset, squares – κ ‘PDB’ subset, black circles – therapeutic antibodies. Diamonds and pluses denote λ ‘design’ and λ ‘PDB’ subsets, respectively.
Expression and analytical characterization
Two main challenges were encountered when designing an experiment to produce the quantity of results necessary to create an accurate predictive algorithm, namely high-throughput (HTP) antibody expression and HTP aggregation assessment. The miniaturization of culture systems for the expression of a heterogeneous collection of antibodies facilitates an increase in sample size of a study while saving a significant amount of time.11 Use of the Duetz system for antibody expression enabled the generation of the large amounts of data necessary for this study. To evaluate the aggregation of the antibodies in such small volumes of supernatant, an ELISA-based ODA that has high sensitivity and throughput, and is very simple to implement, was employed.12 It requires a monoclonal antibody recognizing a specific and unique epitope in the molecule of interest, which could be any biopharmaceutical, including a therapeutic antibody. This monoclonal antibody is used both for capturing the biopharmaceutical of interest and, as a labeled version, as a detection reagent. Because of the monovalence of the epitope in the target biopharmaceutical, aggregates made of 2 or more molecules will likely display epitopes accessible to the labeled antibody, giving rise to a detectable signal. The intensity of the colorimetric reaction is proportional to the level of aggregates. As an additional advantage, this assay allows detection of larger oligomers as well as dimers/trimers.
The 472 antibodies of the final set were expressed using Lonza's GS™ Gene Expression system. Cells were transfected by electroporation and cultured for 72 h. The supernatant was collected and antibody concentration determined by immunoglobulin G (IgG) titer ELISA; aggregation was measured by ODA. An assay readout Abs450nm (intensity of colorimetric reaction) was normalized against amount of antibody in the supernatant (μg); therefore, antibody aggregation is expressed in units Abs450nm /μg. The secondary antibody used in the assays was light chain specific.
A comparison of ODA aggregation values to measurements by SE-HPLC, a standard method for the assessment of aggregation, was made for a selection of 71 antibodies (36 κ and 35 λ) from the ‘design’ set. To provide sufficient material for the SE-HPLC measurements, the selected antibodies were transiently expressed in 100 ml HEK293 cell cultures after 293Fectin transfection. Aggregation levels for antibodies expressed using CHOK1SV cells and HEK293 cells had been previously shown to be comparable (data not shown). The percentage of soluble aggregate was measured by SE-HPLC post Protein A purification. For κ antibodies, the squared correlation coefficient between 2 aggregation measurements is r2 = 0.64 (after exclusion of outliers). Similarly, for λ antibodies the squared correlation coefficient between 2 aggregation measurements is r2 = 0.71 (after exclusion of outliers). Conversion formulae were used to set a threshold to apply to aggregation measurements in order to classify antibodies into those with High or Low aggregation risk. Antibodies with soluble aggregates below 5% are generally considered to be lower risk (with respect to successful development and manufacture). In addition to this consideration, the attempt was made to have a data set with a balanced number of antibodies in both categories, High and Low, which is important for a successful predictive model. For κ antibodies, a threshold of 5.5% of total soluble aggregate (as measured by SE-HPLC) was taken. For λ antibodies, a threshold of 6.5% of total soluble aggregate was set.
Physico-chemical sequence descriptors
A sequence alignment of the variable domains of 472 antibodies was performed according to the AHo numbering scheme.15 The structure based AHo scheme yielded 298 input parameters (149 per chain) through which the structural and positional aggregation interdependence in the set is accounted for.
Nine amino acid scales were used to describe amino acid sequences of antibodies. These amino acid scales are obtained by principal component analysis of physico-chemical properties of amino acids, such as hydrophobicity, size, polarity, electronic, steric and hydrogen bond properties. The amino acid scales have been previously used for quantitative sequence-activity model (QSAM)/ quantitative structure-activity relationship (QSAR) modeling of peptide properties.16 For each position in a sequence, a running sum of each amino acid scale was calculated across a window of 7 residues centered in the position. To reduce the influence of artificial alignment gaps, these were not taken into account when calculating sums. Prior to modeling, the descriptors were pre-filtered by excluding descriptors with low occurrence and low variance across the data set and excluding highly correlated descriptors.
Model construction and validation
Separate models were constructed on κ data and on combined κ and λ data. In each case, the dataset was divided into training (75%) and test (25%) subsets using hierarchical clustering in the space of descriptors. In the case of combined κ and λ data, the continuous ODA aggregation measures could not be used due to different ranges of normalized ODA values observed for κ and λ antibodies. The values in the 2 subsets were categorized separately as High or Low, according to the defined thresholds set against SE-HPLC data and then joined. The combined set and model trained on it are referred to as the ‘κ and λ’ set and model, respectively.
Various modeling techniques for classification and regression were evaluated on both the continuous κ data and the categorical data for the ‘κ and λ’ set including Partial Least Squares regression (PLS), Random Forests for classification and regression, Gaussian Processes regression and classification trees ensemble boosting.17-20 The models were built on the training sets and validated on the test sets. The best model for each data set was selected based on the performance on the test sets. In addition, the models were validated by cross-validation with Monte Carlo (MC) simulations of training/test set split. The regression algorithms did not produce models of appropriate quality for use. The Adaptive Boosting (AdaBoost) algorithm for building ensembles of classification trees20 was the best performer, and final models for both κ antibody set and ‘κ and λ’ set were built using this technique.
Performance of predictive models
The aggregation model for κ antibodies was built on a training set of Ntr = 256 antibodies and validated on the test set of Nte = 85 antibodies, including 49 antibodies with observed Low aggregation and 36 antibodies with High aggregation. The validation results are summarized in Table 1. On the test set, the model achieved an accuracy of 78% in class Low and 75% in class High. On the test set, the model shows 81% specificity in class Low and 71% specificity in class High. Specificity in class Low means the percentage of correctly predicted antibodies among those predicted to be Low. Specificity in class High means the percentage of correctly predicted antibodies among those predicted to be High. The area under the receiver-operating curve (AUROC) was 0.76 on the test set. In addition, validation by MC simulations of the training/test set split was performed using the whole κ antibody set. The performance evaluated by MC validation is slightly lower, but close to the test set performance.
Table 1.
Performance statistics of aggregation models on training and test sets and by Monte-Carlo simulations
| Set/method of validation | Number of antibodies | Overall accuracy | Accuracy in Low | Accuracy in High | Specificity in Low | Specificity in High |
|---|---|---|---|---|---|---|
| The κ model | ||||||
| training set | 256 | 92% | 89% | 95% | 95% | 88% |
| MC-whole set | 341 | 72% | 75% | 68% | 75% | 69% |
| test set | 85 | 76% | 78% | 75% | 81% | 71% |
| The ‘κ and λ’ model | ||||||
| training set | 355 | 91% | 88% | 95% | 96% | 84% |
| MC-whole set | 472 | 68% | 67% | 71% | 76% | 60% |
| test set | 117 | 70% | 75% | 64% | 72% | 68% |
The ‘κ and λ’ model was built on a training set of Ntr = 355 κ and λ antibodies. One additional descriptor was added to the set specifying the type of light chain. The model was validated on the test set of Nte = 117 antibodies, including 64 antibodies with observed Low aggregation and 53 antibodies with High aggregation. In addition, the MC validation of the algorithm was performed on the whole antibody set. The results are summarized in Table 1. On the test set, the model achieved an overall accuracy of 70%, with 75% in class Low and 64% in class High. The model shows 72% specificity in class Low and 68% specificity in class High. The test set was found to have an AUROC value of 0.70 on the test set.
Physico-chemical properties important for aggregation prediction
Machine learning algorithms, such as the classification tree ensemble method used here, are often described as ‘black boxes’ because they do not provide clear guidance as to which descriptor features contribute to an increase or decrease in a modeled property. Nevertheless, the importance of each descriptor in the model can be estimated. Here, the descriptor importance is calculated based on a number of trees in the classification ensemble using the descriptor and also on weights assigned to the descriptor.
The importance of physico-chemical sequence features was calculated for both of the predictive models. Figure 3 shows the normalized descriptor importance for the 50 most important descriptors of the κ model. The importance was estimated from the model and using data from the MC validation. For the latter, the importance measure is a sum of weights from all models using that descriptor. Among the 50 most important descriptors, 20 descriptors refer to sequence features of the light chain, with 12 descriptors based on central residues located in CDRs and 8 descriptors based on residues located in the framework region. For the heavy chain features, 30 descriptors are among the top 50 descriptors, with 9 features centered on CDR residues and 21 features centered on framework residues. All amino acid scales are represented among the 50 features describing electronic properties (z3, D1 and electronic charge index (ECI)), size (z2), steric properties (D2), hydrophobicity (z1 and D3), hydrogen bond properties (D4) and solvent accessibility (isotropic surface area (ISA); see Materials and Methods for details of the amino acid scales.)
Figure 3.

Descriptor importance for the most important 50 descriptors for the κ model. Solid bars indicate descriptor importance estimated from the model, hashed bars indicate descriptor importance estimated using MC validation. Both descriptor importance measures were normalized to fit the same axis range. The descriptor name indicates an AHo position of the central residue for this descriptor and an amino acid scale name (in parenthesis), the first character signifies location of the central residue, f is for frameworks and c is for CDRs. (A) Light chain variable region descriptors. (B) Heavy chain variable region descriptors.
Model validation on external data
Predictive models for κ and λ light chain antibodies were further validated on antibodies from in-house engineering case studies. Re-engineered variants were transiently expressed in GS CHOK1SV cell cultures and their binding affinity, titer and aggregation were measured. The percentage of total soluble aggregate was measured by SE-HPLC post Protein A purification. This set, referred to as ‘external’, consists of a range of engineered antibody variants, including engineered HyHel-10,21 D1.322 and antibodies that have also been deimmunized via the removal of T cell epitopes. Overall, the ‘external’ set contains 46 κ and 3 λ light chain IgG antibodies.
The antibody variants were classified into 2 classes – Low and High aggregation, by applying thresholds of 5.5% for kappa antibodies and 6.5% for lambda antibodies to the measured percentage of soluble aggregate. The κ and ‘κ and λ’ models were used to make a prediction of aggregation risk for κ light chain antibodies and λ light chain antibodies, respectively. Validation results are summarized in Table 2. The model had an overall accuracy of 84% with regard to prediction of aggregation risk; accuracy in class Low is 84% and accuracy in class High is 83%.
Table 2.
Accuracy of predictive models evaluated on 49 antibody variants from ‘external’ data set
|
Aggregation class |
Number of antibodies |
Number of correctly predicted antibodies |
Accuracy |
| Low | 43 (42 κ + 1 λ) | 36 | 84% |
| High | 6 (4 κ + 2 λ) | 5 | 83% |
| Overall | 49 (46 κ + 3 λ) | 41 | 84% |
Figure 4 shows a bar chart of measured aggregation values for wild type (WT) and engineered variants of antibody D1.3.22 The model correctly predicted aggregation risk for 8 of 9 antibodies.
Figure 4.
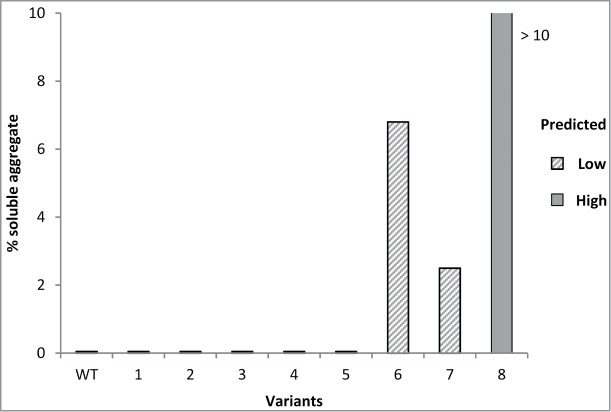
Percentage of soluble aggregate measured by SE-HPLC for re-engineered variants of antibody D1.3. WT is parental antibody. Hashed bars indicate antibodies with predicted Low aggregation risk, the solid bar indicates antibody with predicted High aggregation risk.
Application of aggregation tool for selection of antibody variants
The aggregation prediction tool was used in an engineering project to screen a number of antibody variants targeting interferon gamma (IFNγ) to further validate the tool and its application in combination with other in silico tools and in vitro assays. We will refer to the parental chimeric antibody and a variant designed by Fan and co-workers23 as the WT and the reference (REF), respectively.
Seven variants were designed. The variants, the parental and reference antibodies were profiled in silico for the aggregation risk and the immunogenicity potential using the aggregation prediction tool described here and Epibase™,24,25 an in silico platform for identification of potential T cell epitopes and immunogenicity risk screening. Table 3 shows the predicted aggregation risk for the antibody variants. The WT and REF antibodies were predicted to be at high risk of aggregation, as well as variants #6–7. Variants #1–5 were predicted to be at low risk of aggregation. Figure 5 shows the predicted immunogenicity potential expressed as the DRB1 score for the antibody variants and also for the individual heavy and light chains. The DRB1 score combines information on potential T cell epitopes present in an antibody sequence and population frequencies of affected human leukocyte antigen (HLA) types. REF, WT and variant #1 have higher DRB1 scores (i.e., higher predicted risk of immunogenicity) than variants #2–7.
Table 3.
Predicted aggregation risk for the wild type, the reference and the 7 variants of the anti-IFNγ antibody
| Variant | Predicted aggregation risk |
|---|---|
| WT | High |
| REF | High |
| #1–5 | Low |
| #6–7 | High |
Figure 5.
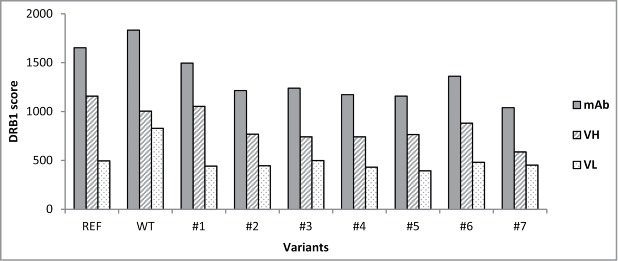
DRB1 scores for the engineered anti-IFNγ antibody variants. Solid, hashed and dotted bars indicate the DRB1 scores for the whole antibodies, heavy variable chains and light variable chains, respectively. 80% of marketed therapeutic humanized antibodies have DRB1 scores not exceeding 1400 (data not shown).
Taking into account both predicted properties of the variants, aggregation and immunogenicity, 4 variants, #2–5, have a good overall profile. These four variants were progressed to in vitro stages, expressed and characterized.
The four variants, WT and REF antibodies were transiently expressed in 150 ml GS CHOK1SV cell cultures, Protein A purified, and the titer, percentage of monomer recovery and binding affinity were measured, as shown in Figure 6. The productivity of variants #2, #4 and #5 was comparable or better to that of REF and WT antibodies. Figure 6B shows that variants #2–5 were free of detectable aggregates and 100% of monomer recovery was achieved. Figure 6C shows binding affinity of the variants to human IFNγ. Variants #2, #4 and #5 retained binding affinity.
Figure 6.
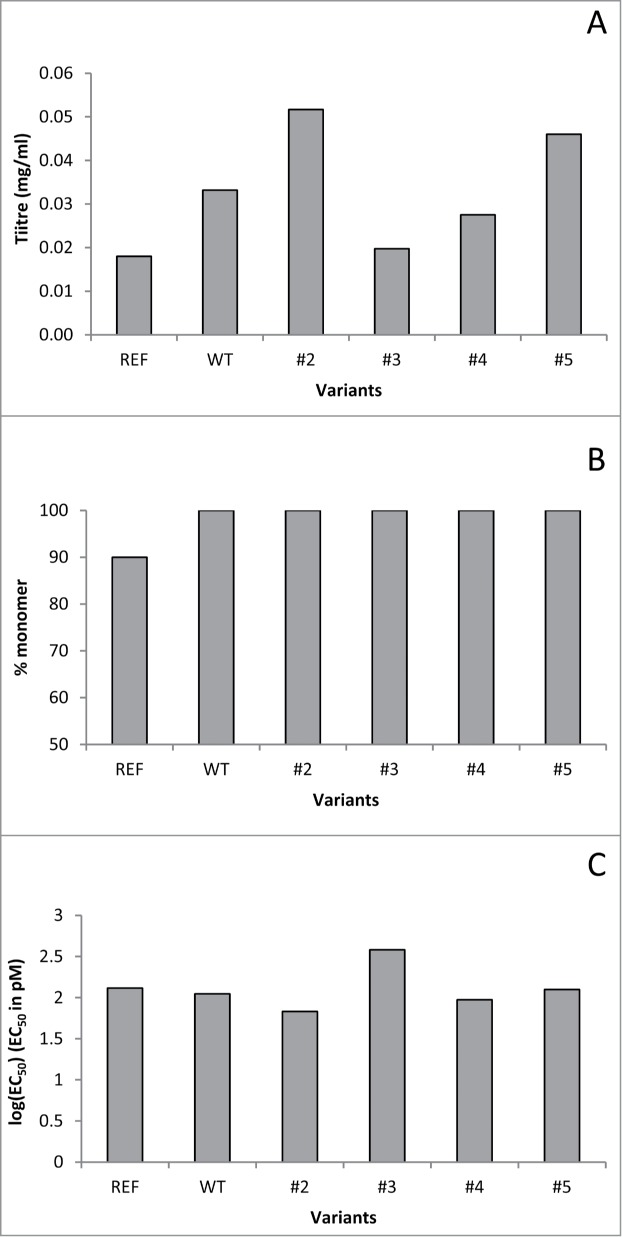
In vitro characterization of engineered anti-IFNγ antibody variants – (A) product titer measured post Protein A purification (in mg/ml), (B) percentage of monomer, (C) binding affinity log(EC50) (EC50 in pM).
Taking into account experimentally measured titer, aggregation, binding affinity and predicted immunogenicity of antibody variants, the variants with the best overall profile are #2, #4, and #5. This result shows that the aggregation prediction tool can be reliably used to enable optimal lead selection and progression of the best candidates to in vitro stages, with potential to substantially reduce the number of molecules progressing to in vitro characterization.
Discussion
Comparison to existing aggregation prediction tools
A number of different aggregation predictive tools have been reported in recent years.5,6,26,27 Some of these tools have been either exemplified or validated in therapeutically relevant proteins or biopharmaceuticals, showing the interest in finding better ways of designing and selecting optimal biopharmaceutical candidates for development.7 Most tools to date are based on aggregation hot-spot detection. The DI9 is a well-known tool for assessing aggregation propensity of therapeutic proteins, with a focus on antibody molecules, and to the best of our knowledge, is the only approach, apart from the method described here, that allows assessment of overall aggregation propensity of an antibody and that can be used to rank antibodies.
The DI is based on principles which assume that protein aggregation is mainly driven by hydrophobic interactions and that net change acts as a modulator of protein-protein interactions. The tool combines SAP,8 which computes the relative hydrophobic character of different regions on the surface of a molecule, and the net charge from an antibody structure. It was developed as a mathematical model incorporating the effects of electrostatic and hydrophobic interactions with the parameters of the model defined and validated using experimental data on 12 antibodies that were subjected to long-term stability studies (storage up to 2 y under controlled conditions) and then characterized by size-exclusion chromatography. The method was developed using 7 IgG1 antibodies and tested on 2 IgG1, 2 IgG2 and one IgG4. It was demonstrated that further parameterization of the method against therapeutically relevant proteins and experimental data is beneficial for qualitative ranking of antibodies by aggregation potential.9
We have compared the tool described here to the DI/SAP tool using 45 antibodies from the ‘external’ data set. Homology models were constructed and used to predict the DI for each antibody. The DI is a quantitative measure of the antibody aggregation propensity, as opposed to the qualitative measure provided by our tool, which predicts High or Low aggregation risk. Therefore, to enable a comparison of 2 predictions, a suitable threshold for DI values was identified to classify antibodies as High or Low aggregation risk. The threshold was selected using DI values and experimental aggregation values for a subset of 30 antibodies from the data set used for the training of the aggregation prediction tool described herein.
The results of the comparison study are shown in Table 4. The DI tool appears to be very accurate in predicting High aggregation risk antibodies, but at the expense of being over-predictive. Half of the antibodies with observed Low risk were predicted incorrectly as High risk by the DI tool, resulting in 48% accuracy in class Low for the DI tool. If used as an early development screening platform, these predictions would lead to many antibodies at Low aggregation risk being wrongly de-selected. The accuracy of the aggregation prediction tool described here is 84% and 83% in classes Low and High, respectively, and the overall accuracy (84%) is exceeding that of the DI tool (53%). Since the DI tool offers a quantitative measure of the aggregation propensity, a correlation between experimental aggregation data and the predicted DI values was calculated. The Pearson correlation coefficient between the experimental percentage of soluble aggregates and the DI values is r = −0.31 and the Spearman rank correlation coefficient is ρ = −0.48. Additional benefits of the tool described here are that antibody structures and homology models are not required, and the input is simply the antibody amino acid sequence, with no requirement for further parameter optimization.
Table 4.
Comparison of the aggregation prediction tool to the Developability Index tool on antibody variants from the ‘external’ data set
| DI prediction tool |
Lonza's aggregation prediction tool |
|||
|---|---|---|---|---|
| Observed aggregation class | Number of antibodies | Accuracy | Number of antibodies | Accuracy |
| Low | 40 | 48% | 43 | 84% |
| High | 5 | 100% | 6 | 83% |
| Overall | 45 | 53% | 49 | 84% |
Application of the aggregation prediction tool in developability assessment of antibodies
During drug discovery and early development, the majority of drug candidates are initially screened and selected based on affinity and functionality. However, there are other properties and attributes that need to be considered during lead selection and optimization in biotherapeutic development, such as protein yield, aggregation, chemical stability (e.g., susceptibility to degradation through oxidation, deamidation), formulability and immunogenicity, which should form part of a comprehensive developability risk assessment.1 The concept of developability is used to define the suitability of a drug candidate to be developed as a drug. In the context of biopharmaceutical drugs, developability assessment can be grouped into 3 major components – manufacturability, safety and pharmacology/mode of action.28
The manufacturability component identifies whether a biotherapeutic drug can be produced with a sufficient yield, with suitable quality attributes (such as lack of aggregation, good chemical stability profile, low risk of oxidation and deamidation) and successfully formulated for the desired route of administration and dosing. The safety component includes assessment of the immunogenicity, immunotoxicology and target-specificity of the product. Finally, the pharmacology/mode of action component addresses issues related to product delivery, route of administration, half-life, dosage regime and efficacy.
This is a simple way of organizing potential risk assessment, but these different components are inter-related, e.g., aggregation can be a determining factor in immunogenicity, or formulability can have an effect in the pharmacology and therapeutic window of a product.
Several platforms have been put forward to address the different components of the developability assessment, including in silico predictive tools, in vitro assays reproducing relevant process and biological environments, ex vivo assays using human donor-derived samples, and in vivo assays making use of animal models.1 In silico platforms that could be used for rapid screening exist for several developability properties, including aggregation prediction tools as the one described here, models for prediction of degradation and post-translational modification sites, and platforms for assessment of immunogenicity that evaluate the presence of T cell epitopes in a protein sequence.24,29
The aggregation prediction model discussed here is highly suitable for early assessment of antibody drug candidates and selection of leads with reduced risk of aggregation. The tool is a sequence-based statistical model developed and validated using experimental measurements of aggregation for over 500 antibodies. The model focuses on intrinsic aggregation propensity and predicts a risk of aggregation for an antibody. This platform was validated on a further 49 antibodies and demonstrated excellent overall accuracy, correctly predicting the aggregation risk for 84% of antibodies. The tool requires only the antibody amino acid sequence, does not require additional parameter optimization, and can be applied in a high-throughput manner early in the drug development process before any expression work has been initiated, enabling early selection of low risk candidates.
We advocate application of the aggregation prediction tool as part of a developability assessment workflow. Combined with other in silico tools for prediction of immunogenicity and post-translational modifications, this tool can be utilized early in the drug development pipeline and contributes to rational product design to ensure progression of leads with optimal properties, i.e., increased safety, reduced aggregation and good stability profiles. Early developability assessment has the potential to reduce drug attrition at later stages of drug development, reduce production costs and increase the probability of success.9,30-33
We presented here an example of a developability assessment performed during antibody engineering. Variants were designed, screened in silico for the risk of aggregation and potential immunogenicity using the Epibase™ T cell epitope profiling platform. The preferred variants were then progressed to expression and in vitro characterization. This project validated application of the aggregation prediction tool to lead selection and demonstrated that early application of in silico tools results in selection of the optimal variants.
The high accuracy and high-throughput applicability of the aggregation prediction platform make this tool highly suitable for use as part of a developability screening of biotherapeutic candidates in combination with other in silico and in vitro methods. In addition, the aggregation prediction tool can be used to support re-engineering to reduce aggregation and improve stability of antibodies, by quickly screening structurally feasible residue mutations and assessing the aggregation risk of the variants.
Materials and Methods
Computational methods and algorithms
Antibody set design
The ‘design’ set consists of a full factorial expansion of 6 heavy chain families with 6 different CDR3s in each family (36 sequences) and 8 light chain families (4 κ + 4 λ) with 2 different CDRs in each family (8+8 sequences); 576 antibodies in total, 288 κ and 288 λ sequences. For the ‘PDB’ set, human and humanized antibody variable domains (Fvs) with available crystal structures were downloaded from the PDB13 and curated, resulting in 186 unique Fv sequences; in addition, the sequences of therapeutic antibodies were collected from Chemical Abstracts Service.14
The diverse set of sequences was selected from the initial set of antibodies. Antibody variable domains were aligned according to the AHo numbering scheme, and a set of important positions to cluster on was decided upon; the positions were composed of the CDRs according to the AHo scheme, the upper core (AHo), framework positions contributing to canonical loop conformations (Chothia) and VH/VL interface. The Fv sequences were clustered using a hierarchical clustering algorithm with distance metric based on percentage identity. Matlab R2011b implementation34 of hierarchical clustering was used. As a result, the selection included 147 κ type antibodies (75 ‘PDB’ and 72 ‘design’) and 68 λ type antibodies (33 ‘PDB’ and 35 ‘design’). The ‘PDB’ set was then expanded to 376 combinations (272 κ and 104 λ) of different light and heavy chains.
Twelve antibodies did not express sufficiently for further characterization and were excluded from the final antibody set. The final antibody set consisted of 341 antibodies with κ light chain and 131 antibodies with λ light chain.
Physico-chemical sequence descriptors
Nine amino acid scales were used to describe amino acid sequences of antibodies: 3 z-scales,35 4 divided physico-chemical property scores (DPPS),16 isotropic surface area (ISA)16 and electronic charge index (ECI).16 Z-scales descriptors (z1, z2 and z3) are obtained by principal component analysis of 29 physico-chemical properties of amino acids, and interpreted as related to hydrophilicity (z1), size (z2) and electronic properties (z3).35 DPPS (D1, D2, D3 and D4) are obtained by principal component analysis of 119 electronic (D1), steric (D2), hydrophobic (D3) and hydrogen bond (D4) amino acid properties.16 ECI is the sum of the absolute values of the charges for each atom presented in the amino acid side-chains. ISA is the sum of surfaces of the side-chain atoms accessible to nonspecific solvent interactions.
Descriptors were pre-filtered by excluding features with low occurrence (less than 2% non-zero values in the set) and low variance (standard deviation of the descriptor across the set is less than 0.0001). In case of highly correlated descriptors (correlation coefficient exceeding 0.95), only one of the pair/group remained in the set. This procedure was performed on the training sets and the excluded descriptors were then removed from the corresponding test sets. In the κ set, 1474 descriptors remained after pre-filtering; in the ‘κ and λ’ set, 1567 descriptors remained after pre-filtering.
Algorithms and validation procedures
The split of the initial data set into training and test set (75% and 25%, respectively) was performed by hierarchical clustering algorithm in the space of descriptors using Matlab R2012b implementation.34 The number of clusters was selected in such a way that it was possible to take at least one member from each cluster into the test set. All centroids and singletons were included in the training set.
Final models for κ set and ‘κ and λ’ set were built using the Adaptive boosting classification tree ensemble algorithm (AdaBoost) using Matlab R2012b implementation.34 Various internal parameters in the algorithm were considered and optimized. In the κ model, an ensemble of 80 trees was used with all default parameters except for the prior probability parameter, which was set to p = 0.5. In the ‘κ and λ’ model, an ensemble of 100 trees was used with all the default parameters except for the prior probability parameter, which was set to p = 0.4 (p is the prior probability for the Low aggregation class).
Model validation by MC simulations was performed as follows. The data set was split randomly into 5 cross-validation groups. Models were trained using 4 groups and validated on a remaining leave-out group, 5 models in total. The performance on the whole set was obtained using predictions on leave-out groups. The procedure of random splits into 5 groups was repeated 30 times. The performance statistics were averaged across 30 repeats.
Epibase™ immunogenicity profiling
Epibase™ is a T cell epitope screening platform that analyses and predicts the potential immunogenicity of proteins25 by identifying potential T cell epitopes present in the protein sequence, based on the prediction of HLA/peptide binding. The platform analyses the HLA binding affinities of all 10-mer peptides derived from a target sequence for up to 85 HLA class II allotypes. The DRB1 score combines counts of potential T cell epitopes present in a protein sequence and population frequencies of affected HLA types to provide an immunogenicity risk score for individual peptides and whole proteins.
DI predictions
The DI predictions were performed using Discovery Studio v3.5 (Accelrys, BIOVIA) implementation.36 Default values were used for parameters pH = 6 and β = 0.05. As recommended by the Discovery Studio software support, the parameters for the DI tool need to be optimized on 30 to 50 in-house antibodies to enable classification of DI values into High and Low risk. The threshold for classification was optimized on 30 antibodies from the training data set.
Fab homology models of 30 antibodies from the training data set and 49 from the ‘external’ data set were constructed using the MODELLER implementation in Discovery Studio v3.5.36 The templates were typically: a Fab structure with the best sequence identity across the framework of both variable domains, highly similar variable domains and CDR templates in the common fashion.37 Finally, the CL and CH1 domains of a high resolution Fab structure were used to compensate for the cases where the Fab template constant domains had unresolved loops.
Expression and analytical characterization
Gene synthesis
Heavy and light chain genes were synthesized by GeneArt AG® (Life Technologies) and sub-cloned into Lonza Biologics GS™ Gene Expression system vectors, pEE6.4 and pEE12.4. A 20 amino acid signal sequence was added N-terminal to the light chain sequence, and a 19 amino acid signal sequence was added N-terminal to the heavy chain sequence. A Kozak sequence preceded the signal sequence, following the N-terminal restriction site.
DNA amplification
One μl of vector DNA was used to transform Subcloning Efficiency™ DH5α Chemically Competent Escherichia coli cells (Life technologies, 18265–017) using the heat-shock method according to manufacturer's instructions. Cells were spread onto ampicillin-containing (50 μg/ml) Luria Bertani agar plates (LB Agar, Sigma-Aldrich) and incubated overnight at 37°C until bacterial colonies were evident. For maxi-preps, single bacterial cultures were used to inoculate 300 ml Luria Bertani (LB) medium (Sigma-Aldrich) containing 50 μg/ml ampicillin, incubated at 37°C overnight with shaking. Vector DNA was isolated using the Nucleobond Maxiprep system (Thermo Fisher Scientific) according to manufacturer's instructions. DNA concentration was measured using a Nanodrop 1000 spectrophotometer (Thermo Fisher Scientific) and adjusted to 1 mg/ml. DNA quality was assessed by measuring the absorbance ratio at 260 and 280 nm.
Duetz transfection
3 μg of plasmid encoding the heavy chain and 3 μg of plasmid encoding the light chain were mixed and added with 150 μL of GS CHOK1SV cells at 6 × 10⁶ cells/mL to each well of a 96 well plate. Electroporation at 300 V, 900 μF was delivered using Bio-Rad Gene Pulser MXCell™ electroporator. Cells were then transferred into a 96-well deep-well plate with 150 μL of pre-warmed CD-CHO media (Life technologies) supplemented with 6 mM L-Glutamine. Plates were sealed with Duetz lids, transferred to Duetz clamps and incubated for 72 h at 36.5°C, 5% CO2, 85% humidity with shaking at 350 rpm. Supernatants were collected after centrifugation and stored at +4°C. There were 4 biological replicates per transfection.
Transient transfection of GS CHOK1SV
CHOK1SV transfections were carried out via electroporation using the Gene Pulser XCell™ (Bio-Rad). For each transfection, viable cells were resuspended in pre-warmed CD-CHO media supplemented with 6 mM L-Glutamine to 2.86 × 10⁷ cells/ml. 80 μg DNA was aliquotted into each cuvette (Bio-Rad, GenePulser cuvette, 0.4 cm gap) and 700 μl cell suspension added. Cells were electroporated at 300 V, 900 μF and incubated in a shaking incubator at 36.5°C, 10% CO2, 85% humidity, 140 rpm for 6 d. Supernatants were then harvested by centrifugation and stored at +4°C prior to purification.
Transient transfection of HEK293F
Serum-free adapted HEK293F cell suspension cultures (Life Technologies) were transfected using 293FectinTM (Life Technologies) following manufacturer's instructions. Cells were cultured in FreeStyle™ 293 (Life Technologies) medium and incubated in a shaking incubator at 36.5°C, 10% CO2, 85% humidity, 140 rpm for 6 d. Supernatants were then harvested by centrifugation and stored at +4°C prior to purification.
Protein A affinity chromatography
For all purifications, culture supernatant was harvested and clarified by centrifugation at 2000 rpm, 10 mins. The supernatant was then loaded onto a pre-packed 5 ml HiTrap MabSelect SuRE column (GE Healthcare) on an AKTA purifier (10 ml/min). The column was equilibrated with 50 mM sodium phosphate, 125 mM sodium chloride, pH 7.3, washed with 50 mM sodium phosphate and 1 M sodium chloride pH 7.3 and eluted with 10 mM sodium formate, pH 3.5. Eluted fractions were immediately pH adjusted to pH 7.3.
IgG titer ELISA
Technical and biological replicates of filtered supernatant samples were analyzed using appropriate dilutions. A 9-point standard (ranging from 1000–4 ng/ml) was generated using Human IgG1 Kappa UNLC (Southern Biotech) or Human IgG1 Lambda UNLC (Southern Biotech). The ELISA was performed using Microplate Immuno MaxiSorp 96-well flat bottom plates coated with 100 μl per well of AffiniPure F(ab’)2 Fragment Goat Anti-Human IgG -Fcγ Fragment Specific (Caltag) at a concentration of 4 μg/ml in coating buffer (50 mM sodium carbonate, pH 9.6) and incubated overnight at +4°C. The plate was washed 3 × 250 μl per well using ELISA wash buffer (10 mM sodium phosphate, 100 mM sodium chloride, 12.7 mM EDTA, 200 mg/L Tween-20, 1% v/v Butan-1-ol, pH 7.2). Wells were blocked using ELISA blocking buffer 200 μl per well (50 mM sodium carbonate, 66.7 mM Casein Hammerstein) for 1 h, room temperature, with shaking at 300 rpm then washed 3 × 250 μl per well. Supernatant samples were diluted using ELISA sample/conjugate buffer (100 mM Trisma base, 100 mM sodium chloride, 26.7 mM Casein Hammerstein, 40 mg Tween 20, pH 7.0). 100 μl of standard or sample was loaded per well and incubated at room temperature with shaking at 300 rpm for 1 h. Plates were washed as described previously and 100 μl of suitably diluted Anti-human IgG kappa HRP (Caltag) or Anti-human IgG Lambda HRP (Sigma-Aldrich) added and incubated at room temperature with shaking at 300 rpm for 1 h. The plate was washed again (3 × 250 μl per well) and 100 μl of 3,3,5,5‘-tetramethylbenzidine (TMB) substrate (Sigma-Aldrich) was added and incubated at room temperature for 15 min (Lambda) or 10 min (Kappa). 50 μl of 0.5 M sulfuric acid was added per well to quench the reaction. Optical density values were detected at 450 nm using a BioTek Synergy HT plate reader and titer values were calculated using the standard curves obtained using the standards.
Oligomer detection assay
ODA was used to assess antibody aggregation. The assay was performed using Microplate Immuno MaxiSorp 96-well flat bottom plates coated with 100 μl per well of monoclonal anti-human IgG Fc-specific antibody (Sigma-Aldrich) at a concentration of 4 μg/ml in coating buffer (50 mM sodium carbonate, pH 9.6) and incubated overnight at 4°C. The plate was washed 3 × 250 μl per well using ODA wash buffer (1 × PBS, 0.05% Tween-20, 150 mM NaCl) and wells then blocked with 200 μl per well of ODA blocking buffer prepared with wash buffer (as above) and 0.3% BSA, for 2 h at 37°C. The plate was washed 3 × 250 μl and 100 μl of internal aggregation standards or crude supernatant sample was loaded per well and incubated at room temperature for 1 h. Plates were washed as described previously and 100 μl of monoclonal anti-human IgG Fc-specific antibody-biotin conjugate (Sigma-Aldrich), diluted in blocking buffer, was added and incubated at room temperature for 1 h. The plate was washed again (3 × 250 μl per well) and 100 μl of streptavidin-HRP (Stratech), diluted in blocking buffer was added and incubated at room temperature for 1 h. Plates were washed as above and 100 μl of TMB substrate (Sigma-Aldrich) was added and incubated at room temperature for 5 min. 50 μl of 0.5 M sulfuric acid was added per well to quench the reaction. Optical density values were detected at 450 nm using a BioTek Synergy HT plate reader. The absorbance readings are directly proportional to the antibody aggregation.
Size-exclusion chromatography HPLC
Duplicate samples were analyzed by SE-HPLC on an Agilent 1200 series HPLC system, using a Zorbax GF-250 4.6 mm ID × 25 cm column (Agilent). Aliquots of sample at a concentration of 1 mg/ml were filtered through a 0.2 μm filter prior to injection. 100 μl aliquots were injected and run at 1 ml/min for 20 minutes. Soluble aggregate levels were analyzed using Chemstation software.
Ligand binding assay
Half maximal effective concentration (EC50) was calculated using an ELISA assay in which 100 ng/ml of His6-tagged recombinant human IFNγ (Prospec) was immobilized to a His-Select® Nickel coated 96-well flat bottom plate (Sigma-Aldrich). Plates were washed 3 times in 1 × PBS, 0.05% Tween-20 and incubated with 150 μl of 1 × PBS, 0.05% Tween-20, 0.5% BSA, pH 7.4 for 1 h at room temperature. Titrations of the different antibody variants were applied to the plate and incubated at room temperature for 1 h. Following a repeat of the washing steps, 100 μl of a 1:1000 dilution of a HRP conjugated goat anti-human IgG antibody (Jackson ImmunoResearch) was applied to wells and incubated at room temperature for 1 h. Following further washing steps, TMB Superslow (Sigma-Aldrich) was applied to the wells and the reaction was stopped after up to 5 minutes by the addition of 0.5 M sulfuric acid. Absorbance at 450 nm was measured on a BioTek Synergy HT plate reader. EC50 was extrapolated as the concentration value for the curve point that was midway between the min and max parameters.
Access to Software
Access to the aggregation prediction tool is provided by Lonza Biologics, and is available for evaluation at a charge.
Disclosure of Potential Conflicts of Interest
No potential conflicts of interest were disclosed.
Acknowledgments
We would like to thank our current and former Lonza colleagues who supported this project and participated in discussions, in particular Dr. Rebecca Michael for the experimental work on D1.3 antibody and Dr. Charlotte Farmer for experimental work on ODA and ELISA testing.
References
- 1. Zurdo J. Developability assessment as an early de-risking tool for biopharmaceutical development. Pharmaceutical Bioprocessing 2013; 1:29-50; http://dx.doi.org/ 10.4155/pbp.13.3 [DOI] [Google Scholar]
- 2. Rosenberg AS. Effects of protein aggregates: an immunologic perspective. AAPS J 2006; 8:E501-7; PMID:17025268; http://dx.doi.org/ 10.1208/aapsj080359 [DOI] [PMC free article] [PubMed] [Google Scholar]
- 3. Seidl A, Hainzl O, Richter M, Fischer R, Böhm S, Deutel B, Hartinger M, Windisch J, Casadevall N, London GM, et al. . Tungsten-induced denaturation and aggregation of epoetin alfa during primary packaging as a cause of immunogenicity. Pharm Res 2012; 29:1454-67; PMID:22094831; http://dx.doi.org/ 10.1007/s11095-011-0621-4 [DOI] [PMC free article] [PubMed] [Google Scholar]
- 4. Vazquez-Ray M, Lang D. Aggregates in monoclonal antibody manufacturing processes. Biotechnol Bioeng 2011; 108:1494-1508; PMID:21480193; http://dx.doi.org/ 10.1002/bit.23155 [DOI] [PubMed] [Google Scholar]
- 5. Belli M, Ramazzotti M, Chiti F. Prediction of amyloid aggregation in vivo. EMBO Rep 2011; 12:657-63; PMID:21681200; http://dx.doi.org/ 10.1038/embor.2011.116 [DOI] [PMC free article] [PubMed] [Google Scholar]
- 6. Agrawal NJ, Kumar S, Wang X, Helk B, Singh SK, Trout BL. Aggregation in protein-based biotherapeutics: computational studies and tools to identify aggregation prone regions. J Pharm Sci 2011; 100:5081-95; PMID:21789769; http://dx.doi.org/ 10.1002/jps.22705 [DOI] [PubMed] [Google Scholar]
- 7. Wang X, Das TK, Singh SK, Kumar S. Potential aggregation prone regions in biotherapeutics: a survey of commercial monoclonal antibodies. mAbs 2009; 1:254-67; PMID:20065649; http://dx.doi.org/ 10.4161/mabs.1.3.8035 [DOI] [PMC free article] [PubMed] [Google Scholar]
- 8. Chennamsetty N, Helk B, Voynov V, Kayser V, Trout BL. Aggregation-prone motifs in human immunoglobulin G. J Mol Biol 2009; 391:404-13; PMID:19527731; http://dx.doi.org/ 10.1016/j.jmb.2009.06.028 [DOI] [PubMed] [Google Scholar]
- 9. Lauer TM, Agrawal NJ, Chennamsetty N, Egodage K, Helk B, Trout BL. Developability index: a rapid in silico tool for the screening of antibody aggregation propensity. J Pharm Sci 2012; 101:102-15; PMID:21935950; http://dx.doi.org/ 10.1002/jps.22758 [DOI] [PubMed] [Google Scholar]
- 10. Szita N, Boccazzi P, Zhang Z, Boyle P, Sinskey AJ, Jensen KF. Development of a multiplexed microbioreactor system for high-throughput bioprocessing. Lab Chip 2005; 5:819-26; PMID:16027932; http://dx.doi.org/ 10.1039/b504243g [DOI] [PubMed] [Google Scholar]
- 11. Duetz WA, Rüedi L, Hermann R, O'Connor K, Büchs J, Witholt B. Methods for intense aeration, growth, storage, and replication of bacterial strains in microtiter plates. Appl Environ Microbiol 2000; 66:2641-6; PMID:10831450; http://dx.doi.org/ 10.1128/AEM.66.6.2641-2646.2000 [DOI] [PMC free article] [PubMed] [Google Scholar]
- 12. Zurdo J, Michael R, Stallwood Y, Hedman K, Aastrup T. Improving the developability of biopharmaceuticals. Inno Pharma Technol 2011; 37:34-40. [Google Scholar]
- 13. Berman HM, Westbrook J, Feng Z, Gilliland G, Bhat TN, Weissig H, Shindyalov IN, Bourne PE. The protein data bank. Nucleic Acids Res 2000; 28:235-42. http://www.rcsb.org; PMID:10592235; http://dx.doi.org/ 10.1093/nar/28.1.235 [DOI] [PMC free article] [PubMed] [Google Scholar]
- 14.Chemical Abstracts Service SciFinder [Internet]. Columbus: (OH: ): American Chemical Society (US), Chemical Abstracts Service; c2014. [cited 2014 Oct 7] Available from: http://www.cas.org/ [Google Scholar]
- 15. Honegger A, Plückthun A. The influence of the buried glutamine or glutamate residue in position 6 on the structure of immunoglobulin variable domains. J Mol Biol 2001; 309:687-99; PMID:11397089; http://dx.doi.org/ 10.1006/jmbi.2001.4664 [DOI] [PubMed] [Google Scholar]
- 16. Zhou P, Chen X, Wu Y, Shang Z. Gaussian process: an alternative approach for QSAM modelling of peptides. Amino Acids 2010; 38:199-212; PMID:19123053; http://dx.doi.org/ 10.1007/s00726-008-0228-1 [DOI] [PubMed] [Google Scholar]
- 17. Breiman L. Random forests. Machine Learning 2001; 45:5-32; http://dx.doi.org/ 10.1023/A:1010933404324 [DOI] [Google Scholar]
- 18. MacKay D. Information theory, inference, and learning algorithms. Cambridge: Cambridge University Press; 2003. 640 p. [Google Scholar]
- 19. Obrezanova O, Csanyi G, Gola JM, Segall MD. Gaussian processes: a method for automatic QSAR modeling of ADME properties. J Chem Inf Model 2007; 47:1847-57; PMID:17602549; http://dx.doi.org/ 10.1021/ci7000633 [DOI] [PubMed] [Google Scholar]
- 20. Freund Y, Schapire RE. A decision-theoretic generalization of on-line learning and an application to boosting. J Computer System Sci 1997; 55:119-39; http://dx.doi.org/ 10.1006/jcss.1997.1504 [DOI] [Google Scholar]
- 21. Padlan EA, Silverton EW, Sheriff S, Cohen GH, Smith-Gill SJ, Davies DR. Structure of an antibody-antigen complex: crystal structure of the HyHEL-10 Fab-lysozyme complex. Proc Natl Acad Sci U S A 1989; 86:5938-42; PMID:2762305; http://dx.doi.org/ 10.1073/pnas.86.15.5938 [DOI] [PMC free article] [PubMed] [Google Scholar]
- 22. Fischmann TO, Bentley GA, Bhat TN, Boulot G, Mariuzza RA, Phillips SE, Tello D, Poljak RJ. Crystallographic refinement of the three-dimensional structure of the Fab D1.3-lysozyme complex at 2.5-A resolution. J Biol Chem 1991; 266:12915-20; PMID:1712773 [PubMed] [Google Scholar]
- 23. Fan ZC, Shan L, Goldsteen BZ, Guddat LW, Thakur A, Landolfi NF, Co MS, Vasquez M, Queen C, Ramsland PA, et al. . Comparison of the three-dimensional structures of a humanized and a chimeric Fab of an anti-gamma-interferon antibody. J Mol Recognit 1999; 12:19-32; PMID:10398393; http://dx.doi.org/ 10.1002/(SICI)1099-1352(199901/02)12:1%3c19::AID-JMR445%3e3.0.CO;2-Y [DOI] [PubMed] [Google Scholar]
- 24. Van Walle I, Gansemans Y, Parren PW, Stas P, Lasters I. Immunogenicity screening in protein drug development. Expert Opin Biol Ther 2007; 7:405-18; PMID:17309332; http://dx.doi.org/ 10.1517/14712598.7.3.405 [DOI] [PubMed] [Google Scholar]
- 25.Lonza Biologics Epibase™ Immunogenicity Assessment Page [Internet]. Cambridge, UK: Lonza Biologics; 2014. [cited 2014 Oct 7] Available from: http://www.lonza.com/custom-manufacturing/development-technologies/protein-and-vaccine-development-services/immunogenicity-platforms.aspx [Google Scholar]
- 26. Fernandez-Escamilla A-M, Rousseau F, Schymkowitz J, Serrano L. Prediction of sequence-dependent and mutational effects on the aggregation of peptides and proteins. Nat Biotechnol 2004; 22:1302-6; PMID:15361882; http://dx.doi.org/ 10.1038/nbt1012 [DOI] [PubMed] [Google Scholar]
- 27. Tartaglia GG, Cavalli A, Pellarin R, Caflisch A. Prediction of aggregation rate and aggregation-prone segments in polypeptide sequences. Protein Sci 2005; 14:2723-34; PMID:16195556; http://dx.doi.org/ 10.1110/ps.051471205 [DOI] [PMC free article] [PubMed] [Google Scholar]
- 28. Zurdo J. Surviving the valley of death. Eur Biopharmaceutical Rev 2013; 195:50-4. [Google Scholar]
- 29. Wang P, Sidney J, Kim Y, Sette A, Lund O, Nielsen M, Peters B. Peptide binding predictions for HLA DR, DP and DQ molecules. BMC Bioinformatics 2010; 11:568-79; PMID:21092157; http://dx.doi.org/ 10.1186/1471-2105-11-568 [DOI] [PMC free article] [PubMed] [Google Scholar]
- 30. Yang X, Xu W, Dukleska S, Benchaar S, Mengisen S, Antochshuk V, Cheung J, Mann L, Babadjanova Z, Rowand J, et al. . Developability studies before initiation of process development: improving manufacturability of monoclonal antibodies. mAbs 2013; 5:787-94; PMID:23883920; http://dx.doi.org/ 10.4161/mabs.25269 [DOI] [PMC free article] [PubMed] [Google Scholar]
- 31. Strohl WR, Strohl LM. Therapeutic antibody engineering. Cambridge: Woodhead Publishing Limited; 2012. Chapter 16, Development issues: antibody stability, developability, immunogenicity and comparability; p. 377-403. [Google Scholar]
- 32. Sathish H, Angell N, Lowe D, Shah A, Bishop S. Application of biophysics to the early developability assessment of therapeutic candidates and its application to enhance developability properties. In: Narhi LO, editor. Biophysics for therapeutic protein development. New York: Springer; 2013. Chapter 6, p. 127-146. [Google Scholar]
- 33. Alavattam S, Demeule B, Liu J, Yadav S, Cromwell M, Shire SJ. Biophysical analysis in support of development of protein pharmaceuticals. In: Narhi LO, editor. Biophysics for therapeutic protein development. New York: Springer; 2013. Chapter 8, p. 173-204. [Google Scholar]
- 34.MathWorks Inc MATLAB (Release R2012b) [Computer software]. Natick: MathWorks Inc.; 2012. [Google Scholar]
- 35. Hellberg S, Sjöström M, Skagerberg B, Wold S. Peptide quantitative structure-activity relationships, a multivariate approach. J Med Chem 1987; 30:1126-35; PMID:3599020; http://dx.doi.org/ 10.1021/jm00390a003 [DOI] [PubMed] [Google Scholar]
- 36.Accelrys Software Inc Discovery Studio Modeling Environment (Release 3.5) [Computer software]. San Diego, USA: Accelrys Software Inc. (Biovia company); 2012. [Google Scholar]
- 37. Almagro JC, Beavers MP, Hernandez-Guzman F, Maier J, Shaulsky J, Butenhof K, Labute P, Thorsteinson N, Kelly K, Teplyakov A, et al. . Antibody modeling assessment. Proteins 2011; 79:3050-66; PMID:21935986; http://dx.doi.org/ 10.1002/prot.23130 [DOI] [PubMed] [Google Scholar]