

Abstract
Higher levels of LINE1 methylation in blood DNA have been associated with increased kidney cancer risk using post-diagnostically collected samples; however, this association has never been examined using pre-diagnostic samples. We examined the association between LINE1 %5mC and renal cell carcinoma (RCC) risk using pre-diagnostic blood DNA from the United States-based, Prostate, Lung, Colorectal, and Ovarian Cancer Screening Trial (PLCO) (215 cases/436 controls), and the Alpha-tocopherol, Beta-carotene Cancer Prevention Study (ATBC) of Finnish male smokers (191 cases/575 controls). Logistic regression adjusted for age at blood draw, study center, pack-years of smoking, body mass index, hypertension, dietary alcohol intake, family history of cancer, and sex was used to calculate odds ratios (ORs) and 95% confidence intervals (CIs) using cohort and sex-specific methylation categories. In PLCO, higher, although non-significant, RCC risk was observed for participants at or above median methylation level (M2) compared to those below the median (M1) (OR: 1.37, 95% CI: 0.96–1.95). The association was stronger in males (M2 vs. M1, OR: 1.54, 95% CI: 1.00–2.39) and statistically significant among male smokers (M2 vs. M1, OR: 2.60, 95% CI: 1.46–4.63). A significant interaction for smoking was also detected (P-interaction: 0.01). No association was found among females or female smokers. Findings for male smokers were replicated in ATBC (M2 vs. M1, OR: 1.31, 95% CI: 1.07–1.60). In a pooled analysis of PLCO and ATBC male smokers (281cases/755controls), the OR among subjects at or above median methylation level (M2) compared to those below the median (M1) was 1.89 (95% CI: 1.34–2.67, P-value: 3 x 10⁻⁴); a trend was also observed by methylation quartile (P-trend: 0.002). These findings suggest that higher LINE1 methylation levels measured prior to cancer diagnosis may be a biomarker of future RCC risk among male smokers.
Keywords: ATBC, cohort; global methylation; nested case-contro; PLCO; pre-diagnostic blood DNA; renal cell carcinoma; smoking interaction
Introduction
Alteration of DNA methylation is thought to promote carcinogenesis by weakening chromosomal stability and changing normal gene expression patterns.1 These epigenetic alterations that occur throughout the genome are considered early events in the carcinogenic process. Recently, long interspersed nucleotide element (LINE1) methylation levels in blood DNA have been examined in relation to risk of several cancers.2-6 To our knowledge, only one case-control study, conducted in Central and Eastern Europe, has assessed this association in relation to renal cell carcinoma (RCC) risk.7 In that study, LINE1 methylation of bisulfite-converted genomic DNA isolated from leukocytes observed that higher global DNA LINE1 methylation levels were associated with an increased risk of RCC. A significant interaction with smoking was also reported where the association between RCC risk and LINE1 methylation was limited to smokers. The findings from this study were unusual given that most studies that have used post-diagnostic samples have observed lower blood methylation levels among cases compared to controls.
Since global methylation at CpG loci throughout the genome change in response to the environment, exposures, immune response, and the carcinogenic process itself, it is unclear whether the observed difference in LINE1 methylation levels reported in the aforementioned case-control study occurred prior to, or as a result of the carcinogenesis.7 Furthermore, questionnaire data used to estimate exposures and other risk factors post-diagnosis could be subject to recall bias. Therefore, we designed a nested case-control study within the Prostate, Lung, Colorectal, and Ovarian Cancer (PLCO) Screening Trial, a prospective cohort conducted in the US. For replication, a second nested RCC case-control study was conducted within the α-tocopherol, β-carotene cancer prevention study (ATBC), a prospective cohort of male Finnish smokers.
Methods
PLCO Screening Trial
The PLCO study design, sample collection and processing have been previously described.8 Briefly, PLCO is a multi-center randomized intervention trial designed to evaluate the effectiveness of prostate, lung, colorectal, and ovarian cancer screening modalities on disease-specific mortality. Men and women, 55 to 74 y of age, were enrolled in the cohort from 1993 to 2001 and randomly assigned into a screening or control arm. Information on a variety of factors, including smoking, dietary, demographics, and lifestyle was collected at baseline via questionnaire. Participants in the screening arm provided non-fasting blood samples at 6 annual examinations. Informed consent was obtained from all subjects. Biospecimen collection was approved by the US National Cancer Institute (NCI) Special Studies Institutional Review Board (IRB) (OH-C-N041) of the US National Institutes of Health (NIH) and IRBs at each screening site.
For the current study, approval to use biological specimens and questionnaire data was granted through a peer review process administered by the PLCO Etiologic and Early Marker Studies (EEMS) program [http://www.plcostars.com]. Incident RCC cases (International Classification of Diseases for Oncology, 2nd Edition (ICD-O-2): C64.9) were selected from subjects within the PLCO screening arm. For each case, 2 controls from the screening study were frequency-matched on sex and 5-year categories for age at randomization. Controls were selected to be alive and RCC-free at the time of case diagnosis, but could have been diagnosed with other cancers. Both cases (n = 233) and controls (n = 465) were selected from the cohort of subjects who self-identified as white, were cancer-free at baseline, had complete questionnaire data and at least 500 ng of pre-diagnostic genomic DNA available for analysis. Of these participants, 29 (12.7%) cases and 43 (9.5%) controls were diagnosed with a cancer other than the RCC at some point during follow-up. Controls were sampled with replacements to prioritize controls with genome-wide association study (GWAS) data; one control was randomly sampled twice. When more than one blood sample was available for a subject, the sample most proximal to the renal cancer diagnosis or censorship was analyzed.
ATBC Study
The ATBC is a randomized, double-blinded, placebo-controlled, primary prevention trial designed to evaluate whether daily vitamin supplementation with α-tocopherol and/or β-carotene reduced cancer incidence in a cohort of Finnish male smokers.9 Finnish men between 50 and 69 y of age, who smoked at least 5 cigarettes per day, were recruited for participation between April 1985 and June 1988. Subjects were randomly assigned to one of 4 intervention groups. Information on smoking status as well as dietary and anthropometric data was ascertained from participants at enrollment via questionnaire. Post-intervention cohort follow-up continues through the Finnish Cancer Registry and the National Register of Causes of Death where data on cancer incidence and mortality were ascertained. Written informed consent was obtained from all participants. The ATBC trial was registered as Clinical Trial.gov number NCT00342992 [ClinicalTrials.gov] and approved by the IRB of the US NCI and the National Public Health Institute of Finland.
For this study, cases were defined as primary RCC (International Classification of Diseases (ICD), 9th revision: 189.0). The majority of RCC cases (93.4%) were histologically confirmed. For each case, 3 controls were randomly selected and frequency-matched on age at randomization (+/- 2 years). Controls were selected to be alive and RCC-free at the time of case diagnosis, but could have been diagnosed with other cancers. Both cases (n = 196) and controls (n = 588) were white, cancer-free at enrollment, had complete questionnaire data, and had at least 500 ng of pre-diagnostic genomic DNA available for analysis. Genomic DNA was extracted from pre-diagnostically collected whole blood at baseline. Controls were sampled with replacements and 151 controls were selected twice.
LINE1 Methylation Quantification
Methylation levels were quantified using CpG loci within the LINE1 promoter; LINE1 is the most highly expressed transposable element in the genome. In humans, there are over 500,000 copies of LINE1 elements, comprising of about 17% of the genome.10 The assay used to quantify LINE1 methylation throughout the genome is thought to serves as a surrogate measure of total CpG content. The accurate, high-throughput, and quantitative nature of this assay makes it attractive for use in large epidemiological studies.2,10,11 Quantification of LINE1 in PLCO and ATBC participant samples was conducted at the same laboratory using the same methods. Bisulfite DNA modification (0.25–0.5 μg/μl) was conducted using the EZ DNA Methylation Kit (Zymo Research, Orange, CA) according to the manufacturer's instructions. One T/C SNP, an unmethylated site, was used to evaluate completion of the bisulfite conversion process by examining the proportion of unmethylated Cs altered and unaltered after bisulfite treatment. When complete, the unmethylated cytosine locus should be completely modified. For quantification of LINE1 methylation levels, 4 additional CpG loci spanning the LINE1 promoter (-492 to -419 bp from ATG) region were averaged to determine the mean CpG site methylation level of the LINE1 promoter region. LINE1 percent 5-methylcytosine (%5mC) levels were quantified using pyrosequencing (EpigenDx Worcester, MA).12 Each 50 μl PCR reaction contained the bisulfite-converted DNA, 10X PCR buffer, 3.0 mM MgCl2, 200 μM dNTPs, 0.2 μM primers, 1.25 U DNA polymerase (HotStar, Qiagen Inc.., Alameda, CA). A biotinylated primer was used to capture one single-stranded DNA template for pyrosequencing.12,13 using the PyrosequencingPSQ96 HS System (Biotage, Kungsgatan, Sweden).
For quality control, each 96-well plate contained a blank well and each containing one unmethylated (0%), partially methylated (50%), and heavily methylated (∼100%) DNA sample (SssI treated).14 Duplicate samples were also analyzed for quality control and comprised approximately 5% of each plate. CpG methylation reactions were run in triplicate and levels were averaged across each of the 4 CpG loci. We eliminated individual runs across the 4 CpG sites with greater than 7.5% bisulfite-unconverted cytosine loci. We also excluded subjects with a coefficient of variation (CV) across averages of the 4 CpG sites across triplicate runs that were greater than 10%. After exclusions, our final population consisted of 215 RCC cases and 436 controls in PLCO and 191 RCC cases and 575 controls in ATBC. The intraclass correlation coefficients (ICCs) for LINE1 %5mC levels were calculated using triplicate runs from each individual using the GLM procedure in SAS calculated as 0.3 and 0.5 for PLCO and ATBC, respectively.
Statistical Analysis
Initially, data from the PLCO and ATBC cohorts were analyzed separately using the same statistical methods. We utilized chi-square tests to assess differences in selected characteristics between cases and controls. The distribution of methylation levels among controls closely fit a normal distribution when assessed and therefore were not transformed. Among the controls, mean methylation levels were calculated for subgroups defined by selected characteristics after adjustment for age at blood draw and sex (PLCO only); differences in mean values across groups were evaluated using the F-test for categorical and the P-trend for ordinal variables.
We calculated odds ratios (ORs) and 95% confidence intervals (CIs) for associations between LINE1 %5mC levels and RCC risk using logistic regression adjusting for hypertension (yes/no), body mass index (BMI), pack-years of smoking, age at blood draw, family history of cancer (yes/no), study center, sex (in PLCO only) and intervention arm (in ATBC only). In addition, we evaluated nutrients involved in one-carbon metabolism and alcohol intake as potential confounders. Using the Pearson correlation coefficient, we also evaluated the relationship between pack-years of smoking and age (at randomization, at blood draw, and at control selection) among controls, and limited to smokers, and male smokers. We applied a generalized estimating equation approach to accommodate repeat sampling of some participants in variance computations.
Categories of LINE1 %5mC levels were calculated based on sex-specific control distributions in PLCO, given the higher levels observed among male versus female controls as observed in previous studies. Male quartiles (Q1-Q4) were: 73.60 to <76.50%, 76.50 to <77.20%, 77.20 to <78.00%, and 78.00 to 80.60%. Female quartiles (Q1-Q4) were: 72.00 to <75.80%, 75.80 to <76.70%, 76.70 to <77.45%, and 77.45 to 79.30%. Quartiles among ATBC males were: 75.23 to <77.96%, 77.96 to <78.60%, 78.60 to <79.60%, and 79.60 to 83.80%. While the range in methylation levels was similar between the cohorts, the levels in ATBC were higher than PLCO as it included only males; therefore, sex and cohort-specific cut points were necessary for categorization.
We assessed methylation categories by quartile and subsequently by median levels due to lack of heterogeneity between Q1 vs. Q2, and Q3 vs. Q4 cut-points. Tests of interaction were computed for the referent: M1 (below the median) compared to M2 (at or above the median) separately by sex (PLCO only), years between blood draw and diagnosis date, cigarette pack-years, alcohol consumption, and dietary factors hypothesized to modify methylation and/or RCC risk using an interaction term in logistic regression models. Since certain dietary intake measurement indices differed between the cohorts, median values estimated among controls in each cohort were used to create comparison groups. Different measurement indices (i.e., servings vs. grams) were used for intake of vegetables and fruits (servings per day/grams per day) and alcohol (drinks per day/grams per day). Similar measurement indices were used for intake of protein (grams per day) as well as folate (diet and supplement), methionine, and vitamins B6 and B12 (μg per day).
PLCO data for male smokers (90 RCC cases/190 controls) were pooled with ATBC data (281 RCC cases/755 controls) and logistic regression with cohort-specific quartiles and median methylation levels were used to calculate ORs and 95% CIs. Using an interaction term in logistic regression, we also evaluated potentially different effects for the 2 cohorts. All analyses were conducted using SAS version 9.1 (SAS Institute, Cary, NC) and STATA version 10.0 (College Station, TX).
Results
For PLCO, DNA samples from 233 RCC cases and 465 controls were sent to the lab. Of these, results were obtained from 229 (98.3%) cases and 436 (93.8%) controls. Of these, suitable CVs (<10 %) from triplicate runs were obtained from the majority of cases and controls (215 cases (93.9%) and 436 (100%) controls). Cases and controls included in PLCO analyses did not differ significantly from those excluded in this analysis (data not shown). For ATBC, of the 196 RCC cases and 588 controls sent for laboratory analyses, results were available from 191 cases (97.4%) and 575 (97.8%) controls; all CVs in ATBC were less than 10%.
No significant differences between case-control status were observed for matching characteristics (age at randomization, sex in PLCO), nor for age at blood draw, study center, years between blood draw and case diagnosis/control selection, education, and family history of cancer (Table 1). In both PLCO and ATBC, cases were significantly more likely than controls to have hypertension. Compared to controls, PLCO cases were more likely to have high BMI. In PLCO, approximately 44% of RCC cases and controls were never smokers; no difference in case-control status was observed for pack-years of smoking. In ATBC, all participants were smokers and cases were more likely to have a higher pack-year of smoking compared to controls. ATBC subjects, in addition to being Finnish male smokers, were younger (range: 49–69 vs. 55–74) compared to PLCO subjects.
Table 1.
Selected characteristics of PLCO and ATBC cases and controls
| |
PLCO1 |
|
|
ATBC2 |
|
||||||
|---|---|---|---|---|---|---|---|---|---|---|---|
| Cases |
Controls |
Cases |
Controls |
||||||||
| Characteristic | N | (%) | N | (%) | P3 | Characteristic | N | (%) | N | (%) | P3 |
| Total | 215 | (100.0) | 436 | (100.0) | NA | Total | 191 | (100.0) | 575 | (100.0) | NA |
| Gender | |||||||||||
| Male | 139 | (64.7) | 291 | (66.7) | Male | 191 | (100.0) | 575 | (100.0) | NA | |
| Female | 76 | (35.4) | 145 | (33.3) | - | ||||||
| 0.60 | |||||||||||
| Age at randomization (years) | |||||||||||
| - | 49-54 | 75 | (39.3) | 230 | (40.0) | ||||||
| 55–59 | 73 | (34.0) | 146 | (33.5) | 55–59 | 66 | (34.6) | 194 | (33.7) | ||
| 60–64 | 74 | (34.4) | 149 | (34.2) | 60–64 | 41 | (21.5) | 123 | (21.4) | ||
| 65–69 | 44 | (20.5) | 91 | (20.9) | 65–69 | 9 | (4.7) | 28 | (4.9) | ||
| 70–74 | 24 | (11.2) | 50 | (11.5) | - | ||||||
| 0.998 | 0.997 | ||||||||||
| Age at blood draw (years) | |||||||||||
| – | 53–54 | 8 | (4.2) | 11 | (1.9) | ||||||
| 55–59 | 19 | (8.8) | 34 | (7.8) | 55–59 | 65 | (34.0) | 199 | (34.6) | ||
| 60–64 | 67 | (31.2) | 142 | (32.6) | 60–64 | 65 | (34.0) | 210 | (36.5) | ||
| 65–69 | 73 | (34.0) | 146 | (33.5) | 65–69 | 43 | (22.5) | 121 | (21.0) | ||
| 70–79 | 56 | (26.1) | 114 | (26.2) | 70–76 | 10 | (5.2) | 34 | (5.9) | ||
| 0.96 | 0.48 | ||||||||||
| Years Between Age at Blood Draw and Case Diagnosis and Matching for Controls | |||||||||||
| <1 | 16 | (7.4) | 43 | (9.9) | <1 | 14 | (7.3) | 37 | (6.4) | ||
| 1–4 | 134 | (62.3) | 257 | (58.9) | 1–4 | 50 | (26.2) | 165 | (28.7) | ||
| 5–9 | 59 | (27.4) | 120 | (27.5) | 5–9 | 58 | (30.4) | 164 | (28.5) | ||
| 10–14 | 3 | (1.4) | 13 | (3.0) | 10–14 | 42 | (22.0) | 131 | (22.8) | ||
| 15–16 | 3 | (1.4) | 3 | (0.7) | 15–17 | 27 | (14.1) | 78 | (13.6) | ||
| 0.48 | 0.95 | ||||||||||
| Center | |||||||||||
| Colorado | 10 | (4.7) | 39 | (8.9) | Kouvola | 9 | (4.7) | 20 | (3.5) | ||
| Georgetown | 7 | (3.3) | 26 | (6.0) | Kotka | 12 | (6.3) | 20 | (3.5) | ||
| Henry Ford | 19 | (8.8) | 49 | (11.2) | Helsinki | 63 | (33.0) | 160 | (27.8) | ||
| Minnesota | 59 | (27.4) | 91 | (20.9) | Jyvaskyla | 11 | (5.8) | 52 | (9.0) | ||
| Washington | 26 | (12.1) | 52 | (11.9) | Hameenlinna | 8 | (4.2) | 32 | (5.6) | ||
| Pittsburgh | 30 | (14.0) | 61 | (14.0) | Lahti | 13 | (6.8) | 36 | (6.3) | ||
| Utah | 22 | (10.2) | 40 | (9.2) | Meltola | 2 | (1.1) | 8 | (1.4) | ||
| Marshfield | 39 | (18.1) | 66 | (15.1) | Pori | 8 | (4.2) | 29 | (5.0) | ||
| Alabama | 3 | (1.4) | 12 | (2.8) | Tampere | 18 | (9.4) | 53 | (9.2) | ||
| Salo | 3 | (1.6) | 14 | (2.4) | |||||||
| Seinajoki | 19 | (10.0) | 44 | (7.7) | |||||||
| Tutku | 19 | (10.0) | 90 | (15.7) | |||||||
| Rauma | 6 | (3.1) | 17 | (3.0) | |||||||
| 0.19 | 0.44 | ||||||||||
| Education | |||||||||||
| Less than 12 Years | 16 | (7.4) | 17 | (3.9) | Less than Elementary | 6 | (3.1) | 16 | (2.8) | ||
| High School Graduate | 58 | (27.0) | 96 | (22.0) | Elementary School | 142 | (74.4) | 429 | (74.6) | ||
| Post Highschool Training | 31 | (14.4) | 56 | (12.8) | Some Jr. High School | 11 | (5.8) | 37 | (6.4) | ||
| Some College | 49 | (22.8) | 93 | (21.3) | Jr. High School | 17 | (8.9) | 43 | (7.5) | ||
| College Graduate | 37 | (12.6) | 80 | (184) | Some Sr. High School | 3 | (1.6) | 5 | (0.9) | ||
| Postgraduate | 34 | (15.8) | 94 | (21.6) | Sr. High School Graduate | 12 | (6.3) | 45 | (7.8) | ||
| 0.06 | 0.89 | ||||||||||
| History of Hypertension | |||||||||||
| No | 124 | (57.9) | 304 | (70.1) | No | 144 | (75.4) | 477 | (83.0) | ||
| Yes | 90 | (42.1) | 130 | (30.0) | Yes | 47 | (24.6) | 98 | (17.0) | ||
| 0.002 | 0.02 | ||||||||||
| BMI (kg/m2) | |||||||||||
| 16.7–<25 | 45 | (20.9) | 123 | (28.2) | 17.6–<25 | 57 | (29.8) | 211 | (36.7) | ||
| 25 – <30 | 90 | (41.9) | 212 | (48.6) | 25 – <30 | 97 | (50.8) | 280 | (48.7) | ||
| 30–62.1 | 80 | (37.2) | 101 | (23.2) | 30–40.4 | 37 | (19.4) | 84 | (14.6) | ||
| 0.001 | 0.13 | ||||||||||
| Ever/Never Smoking | |||||||||||
| Never | 190 | (43.6) | 95 | (44.2) | Never | 0 | (0.0) | 0 | (0.0) | ||
| Ever | 246 | (56.4) | 120 | (55.8) | Ever | 191 | (100.0) | 575 | (100.0) | NA | |
| 0.88 | |||||||||||
| Pack-Years of Smoking | |||||||||||
| 0 | 95 | (44.2) | 190 | (43.6) | - | ||||||
| 1–20 | 42 | (19.5) | 93 | (21.3) | 1–20 | 40 | (20.9) | 139 | (24.2) | ||
| 21–40 | 34 | (15.8) | 65 | (14.9) | 21–40 | 83 | (43.5) | 284 | (49.4) | ||
| 41–60 | 23 | (10.7) | 43 | (9.9) | 41–60 | 62 | (32.5) | 123 | (21.4) | ||
| 60–200 | 20 | (9.8) | 38 | (10.3) | 61–113 | 6 | (3.1) | 29 | (5.0) | ||
| 0.98 | 0.02 | ||||||||||
| Family History of Cancer | |||||||||||
| No | 101 | (47.0) | 210 | (48.2) | No | 87 | (52.4) | 250 | (49.9) | ||
| Yes | 114 | (51.8) | 226 | (51.8) | Yes | 79 | (47.6) | 251 | (50.1) | ||
| 0.78 | 0.58 | ||||||||||
Abbreviations: ATBC- Alpha-Tocopherol, Beta-Carotene Cancer Prevenetion Cohort; BMI- body mass index; N- number; NA- not applicable; PLCO- Prostate, Lung, Colorectal and Ovarian Cancer Screening Trial.
Data on family history of cancer missing from 25 cases and 74 controls in ATBC.
Data on hypertension missing from 1 case and 2 controls, diabetes status missing from 2 controls, and pack-years of smoking missing from 1 case and 7 controls in PLCO.
PLCO included 1 control that was randomly selected as a control twice.
ATBC included 151 controls that were randomly matched to more than 1 case.
χ2 P-value
Mean LINE1 %5mC levels among controls in each cohort are presented in Table 2/Table S1 after adjustment for age at blood draw and sex (in PLCO). PLCO males had significantly higher mean LINE1 %5mC compared to females (77.15% vs. 76.58%; P-value <0.0001). Mean LINE1 %5mC levels were also higher in ATBC (78.77%) than PLCO (male ever smokers: 77.02%). Age at blood draw was positively associated with mean LINE1 %5mC in ATBC but not among PLCO controls. Years between blood draw and control selection was not associated with mean LINE1 %5mC levels in either cohort. LINE1 %5mC did not vary significantly by PLCO study center, but differed across ATBC centers. Level of education and history of hypertension were not associated with mean LINE1 %5mC levels in ATBC or PLCO controls. In ATBC, BMI was inversely associated with mean LINE1 %5mC (P-trend <0.001) but this association was not replicated in PLCO. In PLCO, never smokers had significantly higher LINE1 %5mC compared to ever smokers (77.11% vs. 76.84%; P-value = 0.02); this association was limited to male smokers (never vs. ever: 77.35% vs.77.02%; P-value: 0.02). For pack-years of smoking, no association was observed with mean LINE1 %5mC levels among controls in either cohort. No significant correlation between pack-years of smoking and age was detected among the controls (data not shown), a factor which could potentially confound the associations observed. Lastly, mean LINE1 %5mC levels did not vary by dietary factors among controls in either cohort except for total vegetable intake among ATBC controls (below vs. above median intake: 78.64% vs. 78.90%; P-value = 0.01).
Table 2.
Mean LINE1 %5mC among PLCO and ATBC controls
| PLCO1 |
ATBC2 |
||||||||
|---|---|---|---|---|---|---|---|---|---|
| |
Controls |
|
Controls |
||||||
| Characteristic | N | Mean LINE1 %5mC | (SE) | P3 | Characteristic | N | Mean LINE1 %5mC | (SE) | P3 |
| Total | 436 | 76.96 | (0.06) | Total | 575 | 78.77 | (0.05) | ||
| NA | NA | ||||||||
| Gender | |||||||||
| Male | 291 | 77.15 | (0.07) | Male | 575 | 78.77 | (0.05) | ||
| Female | 145 | 76.58 | (0.10) | - | |||||
| <0.0001 | NA | ||||||||
| Age at blood draw (years) | |||||||||
| – | 53–54 | 11 | 78.34 | (0.36) | |||||
| 55–59 | 34 | 76.54 | (0.21) | 55–59 | 199 | 78.42 | (0.09) | ||
| 60–64 | 142 | 77.05 | (0.10) | 60–64 | 210 | 78.68 | (0.08) | ||
| 65–69 | 146 | 77.06 | (0.10) | 65–69 | 121 | 79.34 | (0.11) | ||
| 70–79 | 114 | 76.83 | (0.11) | 70–76 | 34 | 79.60 | (0.21) | ||
| 0.99 | <0.001 | ||||||||
| Years Between Age at Blood Draw and Case Diagnosis and Matching for Controls | |||||||||
| <1 | 43 | 76.88 | (0.18) | <1 | 37 | 78.51 | (0.20) | ||
| 1–4 | 257 | 76.98 | (0.07) | 1–4 | 165 | 78.83 | (0.09) | ||
| 5–9 | 120 | 77.11 | (0.11) | 5–9 | 164 | 78.72 | (0.10) | ||
| 10–14 | 13 | 75.54 | (0.33) | 10–14 | 131 | 78.8 | (0.11) | ||
| 15–17 | 3 | 76.26 | (0.68) | 15–17 | 78 | 78.88 | (0.14) | ||
| 0.22 | 0.37 | ||||||||
| History of Hypertension | |||||||||
| No | 304 | 77.00 | (0.07) | No | 477 | 78.78 | (0.06) | ||
| Yes | 130 | 76.86 | (0.11) | Yes | 98 | 78.77 | (0.12) | ||
| 0.29 | 0.93 | ||||||||
| BMI (kg/m2) | |||||||||
| 16.7–<25 | 123 | 76.95 | (0.11) | 17.6– <25 | 211 | 79.00 | (0.08) | ||
| 25 – <30 | 212 | 76.94 | (0.08) | 25 – <30 | 280 | 78.73 | (0.07) | ||
| 30–62.1 | 101 | 77.01 | (0.12) | 30–40.4 | 84 | 78.39 | (0.13) | ||
| 0.71 | <0.001 | ||||||||
| Ever/Never Smoking- Males | |||||||||
| Never | 111 | 77.35 | (0.11) | Never | – | – | – | ||
| Ever | 180 | 77.02 | (0.09) | Ever | 575 | 78.77 | (0.05) | ||
| 0.02 | NA | ||||||||
| Ever/Never Smoking- Females | NA | ||||||||
| Never | 79 | 76.66 | (0.14) | ||||||
| Ever | 66 | 76.47 | (0.15) | ||||||
| 0.36 | |||||||||
| Pack-Years of Smoking- Males | |||||||||
| 0 | 111 | 77.35 | (0.11) | - | |||||
| 1–20 | 65 | 76.91 | (0.15) | 1–20 | 139 | 78.60 | (0.10) | ||
| 21–40 | 47 | 77.18 | (0.17) | 21–40 | 284 | 78.82 | (0.07) | ||
| 41–60 | 31 | 77.27 | (0.21) | 41–60 | 123 | 78.86 | (0.11) | ||
| 60–200 | 31 | 76.80 | (0.21) | 61–113 | 29 | 78.83 | (0.22) | ||
| 0.10 | 0.10 | ||||||||
| Pack- Years of Smoking- Females | NA | ||||||||
| 0 | 79 | 76.66 | (0.14) | ||||||
| 1–20 | 28 | 76.63 | (0.23) | ||||||
| 21–40 | 18 | 75.90 | (0.29) | ||||||
| 41–60 | 12 | 76.45 | (0.35) | ||||||
| 60–108 | 7 | 77.3 | (0.47) | ||||||
| 0.69 | |||||||||
| Family History of Cancer | |||||||||
| No | 210 | 76.91 | (0.08) | No | 250 | 78.76 | (0.08) | ||
| Yes | 226 | 77.00 | (0.08) | Yes | 251 | 78.73 | (0.08) | ||
| 0.48 | 0.73 | ||||||||
Abbreviations: ATBC- Alpha-Tocopherol, Beta-Carotene Cancer Prevenetion Cohort; BMI- body mass index; N- number; NA- not applicable; PLCO- Prostate, Lung, Colorectal and Ovarian Cancer Screening Trial; SE- standard error.
Values adjusted for age at blood draw and sex (in PLCO only).
Data on family history of cancer missing from 74 controls in ATBC.
Data on hypertension and diabetes missing from 2 controls, and data on pack-years of smoking missing from 7 controls in PLCO.
PLCO included 1 control that was randomly selected as a control twice.
ATBC included 151 controls that were randomly matched to more than 1 case.
F-test for categorical groups and p-trend for ordinal groups.
Risk estimates for RCC and LINE1 %5mC are shown in Table 3/Table S2. In PLCO, RCC risk approached significance among participants with methylation levels at or above the median (M2) compared to below the median (M1) (OR = 1.37, 95% CI: 0.96–1.95, P-value = 0.08). By quartile, no evidence of a monotonic trend by was detected (P = 0.12). When stratified by sex, the association between median LINE1 %5mC and RCC was borderline significant among males (M2 vs. M1: OR = 1.54, 95% CI: 1.00–2.39, P-value = 0.05) but not among females (M2 vs. M1: OR = 1.16, 95% CI: 0.61–2.21, P-value = 0.65). After stratification by ever/never smoking, the significant association was restricted to ever smokers (OR = 2.15, 95% CI: 1.33–3.48, P-value = 0.002) and null among never smokers (OR = 0.81, 95% CI: 0.47–1.39, P-value = 0.44; P-interaction = 0.01). No evidence of risk modification in PLCO was observed by pack-years of smoking. In the ATBC replication study, a cohort comprised of male smokers, a significantly higher RCC risk was observed for participants with methylation levels at or above the median (M2) compared to those below the median level of methylation (M1) (OR = 1.31, 95% CI: 1.07–1.60, P-value= 0.01); a significant positive trend was observed across quartiles (P = 0.02). Similar to PLCO, no evidence of risk modification by age at blood draw, years between blood draw and case diagnosis/control selection, hypertension, BMI, pack-years of smoking or nutrients involved in methylation reactions was observed.
Table 3.
Odds ratios and 95% confidence intervals for renal cell carcinoma risk and LINE1 %5mC
| PLCO1 |
ATBC2 |
||||||||||||
|---|---|---|---|---|---|---|---|---|---|---|---|---|---|
| Case |
Control |
Case |
Control |
||||||||||
| Characteristic | N | N | OR | 95%CI | P3 | Characteristic | N | N | OR | 95%CI | P3 | ||
| Methylation Quartiles3 | Methylation Quartiles4 | ||||||||||||
| Q1 | 56 | 114 | 1.00 (ref.) | Q1 | 40 | 145 | 1.00 (ref.) | ||||||
| Q2 | 47 | 114 | 0.87 | (0.52-1.45) | 0.59 | Q2 | 36 | 146 | 1.13 | (0.63-2.02) | 0.69 | ||
| Q3 | 49 | 102 | 1.18 | (0.71-1.96) | 0.51 | Q3 | 57 | 141 | 1.83 | (1.06-3.18) | 0.03 | ||
| Q4 | 63 | 106 | 1.37 | (0.84-2.21) | 0.20 | Q4 | 58 | 143 | 1.78 | (1.00-3.19) | 0.05 | ||
| P-trend | 0.12 | P-trend | 0.02 | ||||||||||
| Methylation Median5 | Methylation Median6 | ||||||||||||
| M1 | 103 | 228 | 1.00 (ref.) | M1 | 76 | 291 | 1.00 (ref.) | ||||||
| M2 | 112 | 208 | 1.37 | (0.96-1.95) | 0.08 | M2 | 115 | 284 | 1.31 | (1.07-1.60) | 0.01 | ||
| Gender | See above | ||||||||||||
| Male | M1 | 63 | 115 | 1.00 (ref.) | |||||||||
| M2 | 76 | 136 | 1.54 | (1.00-2.39) | 0.053 | ||||||||
| Female | M1 | 40 | 73 | 1.00 (ref.) | |||||||||
| M2 | 36 | 72 | 1.16 | (0.61-2.21) | 0.65 | ||||||||
| P-int | 0.42 | ||||||||||||
| Age at blood draw (years) | |||||||||||||
| 55-64 | M1 | 36 | 92 | 1.00 (ref.) | 53-64 | M1 | 66 | 250 | 1.00 (ref.) | ||||
| M2 | 50 | 84 | 2.17 | (1.17-4.01) | 0.01 | M2 | 72 | 170 | 1.33 | (1.05-1.67) | 0.02 | ||
| 65-79 | M1 | 67 | 136 | 1.00 (ref.) | 65–76 | M1 | 10 | 41 | 1.00 (ref.) | ||||
| M2 | 62 | 124 | 1.16 | (0.73–1.83) | 0.53 | M2 | 43 | 114 | 1.08 | (0.65–1.79) | 0.76 | ||
| P-int | 0.18 | P-int | 0.82 | ||||||||||
| <4 | M1 | 75 | 154 | 1.00 (ref.) | <4 | M1 | 24 | 100 | 1.00 (ref.) | ||||
| M2 | 75 | 146 | 1.17 | (0.76–1.79) | 0.48 | M2 | 40 | 102 | 1.23 | (0.83–1.82) | 0.31 | ||
| 5–17 | M1 | 28 | 74 | 1.00 (ref.) | 5–17 | M1 | 52 | 191 | 1.00 (ref.) | ||||
| M2 | 37 | 62 | 2.15 | (1.09–4.25) | 0.03 | M2 | 75 | 182 | 1.41 | (1.10–1.82) | 0.01 | ||
| P-int | 0.19 | P-int | 0.55 | ||||||||||
| History of Hypertension | |||||||||||||
| No | M1 | 60 | 152 | 1.00 (ref.) | No | M1 | 64 | 243 | 1.00 (ref.) | ||||
| M2 | 64 | 152 | 1.07 | (0.68–1.68) | 0.77 | M2 | 80 | 234 | 1.28 | (1.01–1.61) | 0.04 | ||
| Yes | M1 | 42 | 75 | 1.00 (ref.) | Yes | M1 | 12 | 48 | 1.00 (ref.) | ||||
| M2 | 48 | 55 | 2.08 | (1.14–3.80) | 0.02 | M2 | 35 | 50 | 1.52 | (0.90–2.56) | 0.11 | ||
| P-int | 0.10 | P-int | 0.19 | ||||||||||
| BMI (kg/m2) | |||||||||||||
| 16.7–<25 | M1 | 22 | 63 | 1.00 (ref.) | 17.6–<25 | M1 | 21 | 89 | 1.00 (ref.) | ||||
| M2 | 23 | 60 | 1.29 | (0.58–2.90) | 0.53 | M2 | 36 | 122 | 1.03 | (0.70–1.52) | 0.87 | ||
| 25 to <30 | M1 | 39 | 110 | 1.00 (ref.) | 25 to <30 | M1 | 43 | 149 | 1.00 (ref.) | ||||
| M2 | 51 | 102 | 1.50 | (0.87–2.58) | 0.14 | M2 | 54 | 131 | 1.31 | (0.97–1.77) | 0.80 | ||
| 30–62.1 | M1 | 42 | 55 | 1.00 (ref.) | 30–40.4 | M1 | 12 | 53 | 1.00 (ref.) | ||||
| M2 | 38 | 46 | 1.15 | (0.60–2.20) | 0.67 | M2 | 25 | 31 | 3.27 | (1.30–8.23) | 0.01 | ||
| P-int | 0.65 | P-int | 0.10 | ||||||||||
| Ever/Never Smoking | NA | ||||||||||||
| Never | M1 | 54 | 92 | 1.00 (ref.) | |||||||||
| M2 | 41 | 98 | 0.81 | (0.47–1.39) | 0.44 | ||||||||
| Ever | M1 | 49 | 136 | 1.00 (ref.) | |||||||||
| M2 | 71 | 110 | 2.15 | (1.33–3.48) | 0.002 | ||||||||
| P-int | 0.01 | ||||||||||||
| Pack-Years of Smoking | |||||||||||||
| 1–40 | M1 | 32 | 90 | 1.00 (ref.) | 1–40 | M1 | 51 | 222 | 1.00 (ref.) | ||||
| M2 | 44 | 68 | 2.00 | (1.08–3.69) | 0.03 | M2 | 72 | 201 | 1.34 | (1.03–1.73) | 0.03 | ||
| 41–200 | M1 | 17 | 46 | 1.00 (ref.) | 41–113 | M1 | 25 | 69 | 1.00 (ref.) | ||||
| M2 | 27 | 42 | 2.62 | (1.08–6.33) | 0.03 | M2 | 43 | 83 | 1.35 | (0.88–2.06) | 0.17 | ||
| P-int | 0.76 | P-int | 0.87 | ||||||||||
| Family History of Cancer | |||||||||||||
| No | M1 | 47 | 114 | 1.00 (ref.) | No | M1 | 38 | 135 | 1.00 (ref.) | ||||
| M2 | 54 | 96 | 1.81 | (1.06–3.07) | 0.03 | M2 | 49 | 115 | 1.34 | (0.99–1.82) | 0.06 | ||
| Yes | M1 | 56 | 114 | 1.00 (ref.) | Yes | M1 | 29 | 129 | 1.00 (ref.) | ||||
| M2 | 58 | 112 | 1.06 | (0.64–1.75) | 0.83 | M2 | 50 | 122 | 1.36 | (0.99–1.88) | 0.06 | ||
| P-int | 0.18 | P-int | 0.80 | ||||||||||
Abbreviations: ATBC- Alpha-Tocopherol, Beta-Carotene Cancer Prevenetion Cohort; BMI- body mass index; CI- confidence interval; M- median; N- number; NA- not applicable; OR- odds ratio; P-int- p-interaction; PLCO- Prostate, Lung, Colorectal and Ovarian Cancer Screening Trial; Q- quartiles; ref.- reference.
Data on Family History of Cancer missing from 25 cases and 74 controls in ATBC.
Data on hypertension missing from 1 case and 2 controls, data on diabetes status missing from 2 controls, and data on pack years of smoking missing from 1 case and 7 controls in PLCO.
PLCO adjusted for hypertention, BMI, pack-years of smoking, age at blood draw, study center, dietary alcohol intake, family history of cancer, and sex
ATBC adjusted for hypertention, BMI, pack-years of smoking, age at blood draw, study center, dietary alcohol intake, family history of cancer, and intervention arm
Quartile distribution for PLCO males: 73.60 to <76.50%; 76.50% to <77.20%; 77.20% to <78.00%; 78.00 to 80.60; females: 72.00 to <75.80%; 75.80% to <76.70%; 76.70% to <77.45%; 77.45% to 79.30.
Quartile distribution for ATBC: 75.23 to <77.96%; 77.96% to <78.60%; 78.60% to <79.60%; 79.60 to 83.80.
Median distribution for PLCO males: 73.60 to <77.20%; 77.20% to 80.60; females: 72.00 to <76.70%; 76.70% to 79.30.
Median distribution for ATBC: 75.23 to <78.60%; 78.60% to 83.80.
Because of the differences in association observed by sex and smoking status, we conducted additional stratified analyses among PLCO subjects (Table 4). A significant increase in RCC risk was observed among male smokers (M2 vs. M1: OR = 2.60, 95% CI: 1.46–4.63, P-value = 0.001) but not among never smokers (M2 vs. M1: OR = 0.77, 95% CI: 0.35–1.69, P-value = 0.52; P- interaction = 0.01). A similar elevated pattern of association (M2 vs. M1: OR = 1.78, 95% CI: 0.56–5.68) was observed among female smokers (30 RCC cases/66 controls), but the association was not significant (P-interaction = 0.47).
Table 4.
Odds ratios and 95% confidence intervals for renal cell carcinoma risk and LINE1 %5mC by gender and smoking status in PLCO
| PLCO1 | ||||||||||
|---|---|---|---|---|---|---|---|---|---|---|
| Never Smokers |
Ever Smokers |
|||||||||
| Sex | Cases | Controls | OR | 95%CI | P3 | Cases | Controls | OR | 95%CI | P3 |
| MALES | ||||||||||
| Quartile 1 (Q1) | 15 | 25 | 1.00 (ref.) | 22 | 54 | 1.00 (ref.) | ||||
| Quartile 2 (Q2) | 14 | 27 | 1.06 | (0.35–3.18) | 0.92 | 12 | 49 | 0.60 | (0.24–1.46) | 0.26 |
| Quartile 3 (Q3) | 8 | 28 | 0.68 | (0.20–2.30) | 0.54 | 23 | 38 | 1.85 | (0.84–4.09) | 0.13 |
| Quartile 4 (Q4) | 12 | 31 | 0.87 | (0.30–2.51) | 0.80 | 33 | 39 | 2.34 | (1.10–4.97) | 0.03 |
| P-trend | 0.66 | 0.01 | ||||||||
| P-Int | 0.03 | |||||||||
| < Median (M1) | 29 | 52 | 1.00 (ref.) | 34 | 103 | 1.00 (ref.) | ||||
| > Median (M2) | 20 | 59 | 0.77 | (0.35–1.69) | 0.52 | 56 | 77 | 2.60 | (1.46–4.63) | 0.001 |
| P-Int | 0.01 | |||||||||
| FEMALES | ||||||||||
| Quartile 1 (Q1) | 12 | 18 | 1.00 (ref.) | 7 | 17 | 1.00 (ref.) | ||||
| Quartile 2 (Q2) | 13 | 22 | 0.99 | (0.30–3.29) | 0.99 | 8 | 16 | 0.66 | (0.12–3.52) | 0.62 |
| Quartile 3 (Q3) | 10 | 19 | 0.80 | (0.21–2.99) | 0.74 | 8 | 17 | 1.49 | (0.31–7.15) | 0.62 |
| Quartile 4 (Q4) | 11 | 20 | 0.90 | (0.26–3.10) | 0.87 | 7 | 16 | 1.43 | (0.28–7.40) | 0.67 |
| P-trend | 0.79 | 0.49 | ||||||||
| P-Int | 0.82 | |||||||||
| < Median (M1) | 25 | 40 | 1.00 (ref.) | 15 | 33 | 1.00 (ref.) | ||||
| > Median (M2) | 21 | 39 | 0.86 | (0.36–2.04) | 0.73 | 15 | 33 | 1.78 | (0.56–5.68) | 0.33 |
| P-Int | 0.47 | |||||||||
Abbreviations: BMI- body mass index; CI- confidence interval; M- median; OR- odds ratio; P-int- p-interaction; PLCO- Prostate, Lung, Colorectal and Ovarian Cancer Screening Trial; Q- quartiles; ref.- reference.
Quartile distribution for PLCO males: 73.60 to <76.50%; 76.50% to <77.20%; 77.20% to <78.00%; 78.00 to 80.60; females: 72.00 to <75.80%; 75.80% to <76.70%; 76.70% to <77.45%; 77.45% to 79.30.
PLCO adjusted for hypertention, BMI, age at blood draw, study center, dietary alcohol intake, family history of cancer. 2χ2 P-value
Since associations between LINE1 methylation levels and RCC risk did not differ by study (P-interaction = 0.23), we pooled data from male ever smokers from PLCO and ATBC (Fig. 1). A significantly higher RCC risk was observed for male smokers at or above median methylation levels (M2) compared to below the median (M1) (OR= 1.89, 95% CI: 1.34–2.67, P-value = 0.0003). A significant trend by methylation quartile was also detected (P-trend = 0.002).
Figure 1.
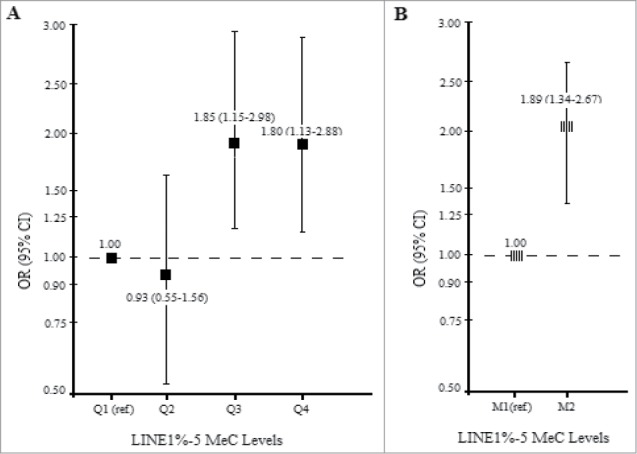
Pooled analysis of RCC risk and LINE1 %5mC (A) by quartile (B) by median among (281 RCC cases and 755 controls) male smokers in the PLCO and ATBC cohort.
Discussion
We examined the association between RCC risk and LINE1 %5mC levels using prospectively collected blood DNA from 2 nested case-control studies conducted in the US and Finland. In PLCO, no evidence of a trend was observed when data were analyzed in quartiles; however, we did observe a significant trend after restricting our analysis to males, and particularly to male smokers. Replication in the ATBC study corroborated our findings among male smokers. A stronger and significant positive association between LINE1 %5mC level and RCC risk was detected after pooling data from male smokers in PLCO and ATBC. These findings are novel in demonstrating that, among healthy individuals and prior to cancer diagnosis, having higher LINE1 methylation levels was associated with increased cancer risk among smokers. Smoking measured in pack-years was not associated with LINE1 %5mC levels among cases or controls. This finding indicates that LINE1 %5mC levels represent an independent risk factor for renal cancer that is limited to smokers.
Previous studies using pre- and post-diagnostically collected blood samples have shown increased cancer risk of tobacco-associated urologic cancers associated with having higher LINE1 methylation levels that was limited to smokers2,5-7 As aforementioned, increased RCC risk was observed among participants with higher LINE1 %5mC levels measured in peripheral blood DNA in a large European case-control study.7 Most recently, having higher LINE1 %5mC levels were reported to be a strong risk factor for the development of bladder cancer in analyses of pre-diagnostic blood DNAs among participants in the ATBC and PLCO cohorts.6 Other epidemiological studies that have investigated other cancer types in relation to LINE1 methylation levels in pre-diagnostic blood DNA samples have been less consistent for non-urologic malignancies.15-18 The effect of cigarette smoking on methylation levels and RCC risk was not initially apparent in the population as a whole. In PLCO, the association between hypermethylation and RCC was not significant overall, but significant among males, and specifically male smokers. This finding is consistent with results reported by Liao and colleagues, who showed stronger RCC associations with higher methylation levels among current smokers compared to former and never smokers in a study conducted in Central and Eastern Europe.7 A similar association was observed in the prospective PLCO cohort, in which smoking was shown to modify the association between high vs. low LINE1 methylation levels and future bladder cancer risk; the association was significant in males, particularly in male smokers.6 In contrast, in studies that have used post-diagnostic samples cancer risks were higher among never smokers with lower methylation levels.19-21 With regards to our findings, higher cancer risk among smokers could imply that prior to renal cancer development, cells with higher methylation levels may be more resistant to the genotoxic effects of smoking compared to those with lower methylation levels. Conceivably, damaged cells from individuals with both low DNA methylation and cigarette carcinogen exposure may be more prone to programmed cell death or apoptosis, thus reducing the likelihood of survival, clonal expansion, and uncontrolled division of damaged cells.19 The relationship between methylation levels in blood and somatic tissue is unknown; however, it is possible that blood DNA could be a biomarker susceptibility to carcinogens such as those found in cigarette smoke.
In our study, LINE1 %5mC levels were within ranges observed in other studies.2,7,19,20,22 Similar comparative associations were observed in ATBC and PLCO, though slightly higher LINE1 %5mC levels were observed in ATBC compared to PLCO male participants. Ethnic variation in LINE1 %5mC levels using this same assay have been observed in other studies. Additionally, PLCO included both male and female smokers and non-smokers, whereas ATBC included only male smokers that have generally demonstrated higher LINE1 methylation levels compared to females.2,6
Strengths of our study include its prospective design and use of high quality questionnaire data collected prior to cancer diagnosis thus, reduced the risk of recall bias. The random selection of other cancer cases as controls ensured that our control population was not healthier than all study controls and increased the generalizability of our results. The vast majority of RCC cases (97%) were histologically confirmed, reducing possible outcome misclassification. Although the possibility of false negative results due to laboratory error cannot be ruled out, we attempted to reduce intra- and inter-individual variation by excluding the very few individual PCR runs with low bisulfate conversion levels or individual runs with high CVs across triplicates.
A limitation of our study is that the ATBC cohort only included male smokers, which limited our ability to examine never smokers or women. Similarly, in PLCO, the small number of female participants as well as female smokers limited our statistical power to detect modest risk estimates. While we assessed temporality of association by using the time between blood draw and date of diagnosis/control selection, ideally changes in methylation levels over time would require assessment of repeat measurements from the same individuals both pre- and post-cancer diagnosis, which was beyond the scope of the current study, but merits future analysis.
In summary, this is the first prospective study, to our knowledge, to examine the association between LINE1 %5mC and RCC risk in 2 unique populations using a similar study design. Consistent with the results of the previous European RCC case-control study,7 we found elevated RCC risks associated with higher methylation levels limited to male smokers. Future epigenome wide studies hold promise to identify specific CpG alterations associated with RCC risk in healthy populations.
Disclosure of Potential Conflicts of Interest
No potential conflicts of interest were disclosed.
Funding
This research was supported in part by the Intramural Research Program of the National Cancer Institute, US. National Institutes of Health, Department of Health and Human Services. Additionally, this research was supported by US. Public Health Service contracts N01-CN-45165, N01-RC-45035, N01-RC-37004 and HHSN261201000006C from the National Cancer Institute, National Institutes of Health, Department of Health and Human Services.
Supplemental Material
Supplemental data for this article can be accessed on the publisher's website.
Author Contributions
All authors participated in the critical review of this report for its intellectual content. In particular SK, GA, LML, RMP, SJW, MPP, JNH, DA, SM, and LEM participated in the design, data collection, data interpretation, and writing of this report. SK, GA, LML, RMP, and LEM participated in data analysis. DA and SM designed/conducted the original cohort studies. SJW, DA, and SM collected data, provided risk factor, dietary and exposure data and biological samples for laboratory analyses. SK, GA, LML, and LEM developed the study concept, design, data interpretation, revising and finalizing this report for publication.
References
- 1. Sproul D, Meehan RR. Genomic insights into cancer-associated aberrant CpG island hypermethylation. Brief Funct Genomics 2013;12(3):174-90; PMID:23341493; http://dx.doi.org/ 10.1093/bfgp/els063 [DOI] [PMC free article] [PubMed] [Google Scholar]
- 2. Brennan K, Flanagan JM. Is there a link between genome-wide hypomethylation in blood and cancer risk? Cancer Prev Res (Phila) 2012;5(12):1345-57; PMID:23135621; http://dx.doi.org/ 10.1158/1940-6207.CAPR-12-0316 [DOI] [PubMed] [Google Scholar]
- 3. Mirabello L, Savage SA, Korde L, Gadalla SM, Greene MH. LINE-1 methylation is inherited in familial testicular cancer kindreds. BMC Med Genet 2010;11:77; PMID:20478068; http://dx.doi.org/ 10.1186/1471-2350-11-77 [DOI] [PMC free article] [PubMed] [Google Scholar]
- 4. Wu HC, Delgado-Cruzata L, Flom JD, Perrin M, Liao Y, Ferris JS, Santella RM, Terry MB. Repetitive element DNA methylation levels in white blood cell DNA from sisters discordant for breast cancer from the New York site of the BCFR. Carcinogenesis 2012;33:1946-52; PMID:22678115; http://dx.doi.org/ 10.1093/carcin/bgs201 [DOI] [PMC free article] [PubMed] [Google Scholar]
- 5. Woo HD, Kim J. Global DNA hypomethylation in peripheral blood leukocytes as a biomarker for cancer risk: a meta-analysis. PLoS One 2012;7(4):e34615; PMID:22509334; http://dx.doi.org/ 10.1371/journal.pone.0034615 [DOI] [PMC free article] [PubMed] [Google Scholar]
- 6. Andreotti G, Karami S, Pfeiffer RM, Hurwitz L, Liao LM, Weinstein SJ, Albanes D, Virtamo J, Silverman DT, Rothman N, Moore LE. LINE1 methylation levels associated with increased bladder cancer risk in pre-diagnostic blood DNA among US (PLCO) and European (ATBC) cohort study participants. Epigenetics 2014;9(3):404-15; PMID:24316677; http://dx.doi.org/ 10.4161/epi.27386 [DOI] [PMC free article] [PubMed] [Google Scholar]
- 7. Liao LM, Brennan P, van Bemmel D, Zaridze D, Matveev V, Janout V, Kollarova H, Bencko V, Navratilova M, Szeszenia-Dabrowska N, et al. LINE-1 methylation levels in leukocyte DNA and risk of renal cell cancer. PLoS One 2011;6(11):e27361; PMID:22076155; http://dx.doi.org/ 10.1371/journal.pone.0027361 [DOI] [PMC free article] [PubMed] [Google Scholar]
- 8. Hayes RB, Sigurdson A, Moore L, Peters U, Huang WY, Pinsky P, Reding D, Gelmann EP, Rothman N, Pfeiffer RM, Hoover RN, Berg CD; PLCO Trial Team . Methods for etiologic and early marker investigations in the PLCO trial. Mutat Res 2005;592:147-54; PMID:16054167; http://dx.doi.org/ 10.1016/j.mrfmmm.2005.06.013 [DOI] [PubMed] [Google Scholar]
- 9. Albanes D, Heinonen OP, Taylor PR, Virtamo J, Edwards BK, Rautalahti M, Hartman AM, Palmgren J, Freedman LS, Haapakoski J, et al. Alpha-Tocopherol and β-carotene supplements and lung cancer incidence in the α-tocopherol, β-carotene cancer prevention study: effects of base-line characteristics and study compliance. J Natl Cancer Inst 1996;88:1560-70; PMID:8901854; http://dx.doi.org/ 10.1093/jnci/88.21.1560 [DOI] [PubMed] [Google Scholar]
- 10. Nelson HH, Marsit CJ, Kelsey KT. Global methylation in exposure biology and translational medical science. Environ Health Perspect 2011;119:1528-33; PMID:21669556; http://dx.doi.org/ 10.1289/ehp.1103423 [DOI] [PMC free article] [PubMed] [Google Scholar]
- 11. Yang AS, Estécio MR, Doshi K, Kondo Y, Tajara EH, Issa JP. A simple method for estimating global DNA methylation using bisulfite PCR of repetitive DNA elements. Nucleic Acids Res 2004;32:e38; PMID:14973332; http://dx.doi.org/ 10.1093/nar/gnh032 [DOI] [PMC free article] [PubMed] [Google Scholar]
- 12. Royo JL, Hidalgo M, Ruiz A. Pyrosequencing protocol using a universal biotinylated primer for mutation detection and SNP genotyping. Nat Protoc 2007;2:1734-9; PMID:17641638; http://dx.doi.org/ 10.1038/nprot.2007.244 [DOI] [PubMed] [Google Scholar]
- 13. Brakensiek K, Wingen LU, Länger F, Kreipe H, Lehmann U. Quantitative high-resolution CpG island mapping with Pyrosequencing reveals disease-specific methylation patterns of the CDKN2B gene in myelodysplastic syndrome and myeloid leukemia. Clin Chem 2007;53(1):17-23; PMID:17095538; http://dx.doi.org/ 10.1373/clinchem.2007.072629 [DOI] [PubMed] [Google Scholar]
- 14. England R, Pettersson M. Pyro Q-CpG™: Quantitative analysis of methylation in multiple CpG sites by pyrosequencing. Nature Methods 2005;2:1-2; http://dx.doi.org/ 10.1038/nmeth800 [DOI] [Google Scholar]
- 15. Gao Y, Baccarelli A, Shu XO, Ji BT, Yu K, Tarantini L, Yang G, Li HL, Hou L, Rothman N, et al. Blood leukocyte Alu and LINE-1 methylation and gastric cancer risk in the Shanghai Women's Health Study. Br J Cancer 2012;106:585-91; PMID:22173668; http://dx.doi.org/ 10.1038/bjc.2011.562 [DOI] [PMC free article] [PubMed] [Google Scholar]
- 16. Wu HC, Wang Q, Yang HI, Tsai WY, Chen CJ, Santella RM. Global DNA methylation levels in white blood cells as a biomarker for hepatocellular carcinoma risk: a nested case-control study. Carcinogenesis 2012;33:1340-5; PMID:22581841; http://dx.doi.org/ 10.1093/carcin/bgs160 [DOI] [PMC free article] [PubMed] [Google Scholar]
- 17. Brennan K, Garcia-Closas M, Orr N, Fletcher O, Jones M, Ashworth A, Swerdlow A, Thorne H, KConFab Investigators , Riboli E, Vineis P, et al. Intragenic ATM methylation in peripheral blood DNA as a biomarker of breast cancer risk. Cancer Res 2012;72(9):2304-13; PMID: 22374981; http://dx.doi.org/ 10.1158/0008-5472.CAN-11-3157 [DOI] [PubMed] [Google Scholar]
- 18. Zhu ZZ, Sparrow D, Hou L, Tarantini L, Bollati V, Litonjua AA, Zanobetti A, Vokonas P, Wright RO, Baccarelli A, et al. Repetitive element hypomethylation in blood leukocyte DNA and cancer incidence, prevalence, and mortality in elderly individuals: the Normative Aging Study. Cancer Causes Control 2011;22:437-47; PMID:21188491; http://dx.doi.org/ 10.1007/s10552-010-9715-2 [DOI] [PMC free article] [PubMed] [Google Scholar]
- 19. Moore LE, Pfeiffer RM, Poscablo C, Real FX, Kogevinas M, Silverman D, García-Closas R, Chanock S, Tardón A, Serra C, et al. Genomic DNA hypomethylation as a biomarker for bladder cancer susceptibility in the SpanishBladder Cancer Study: a case-control study. Lancet Oncol 2008;9:359-66; PMID:18339581; http://dx.doi.org/ 10.1016/S1470-2045(08)70038-X [DOI] [PMC free article] [PubMed] [Google Scholar]
- 20. Cash HL, Tao L, Yuan JM, Marsit CJ, Houseman EA, Xiang YB, Gao YT, Nelson HH, Kelsey KT. LINE-1 hypomethylation is associated with bladder cancer risk among nonsmoking Chinese. Int J Cancer 2012;130:1151-9; PMID:21445976; http://dx.doi.org/ 10.1002/ijc.26098 [DOI] [PMC free article] [PubMed] [Google Scholar]
- 21. Furniss CS, Marsit CJ, Houseman EA, Eddy K, Kelsey KT. Line region hypomethylation is associated with lifestyle and differs by human papillomavirus status in head and neck squamous cell carcinomas.Cancer Epidemiol Biomarkers Prev 2008;17(4):966-71; PMID:18398038; http://dx.doi.org/ 10.1158/1055-9965.EPI-07-2775 [DOI] [PMC free article] [PubMed] [Google Scholar]
- 22. Ludgate JL, Le Mée G, Fukuzawa R, Rodger EJ, Weeks RJ, Reeve AE, Morison IM. Global demethylation in loss of imprinting subtype of Wilms tumor. Genes Chromosomes Cancer 2013;52(2):174-84; PMID:23074036; http://dx.doi.org/ 10.1002/gcc.22017 [DOI] [PubMed] [Google Scholar]
Associated Data
This section collects any data citations, data availability statements, or supplementary materials included in this article.