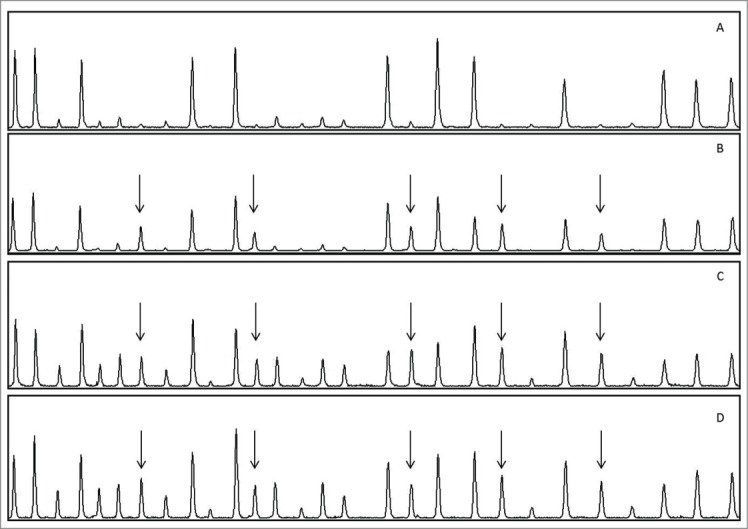
Figure 1.

MS-MLPA analysis of samples from patient M60 and an unmethylated control sample. (A) Control (peripheral leukocytes); (B) M60, peripheral leukocytes; (C) M60, rectal cancer; (D) M60, breast cancer. Arrows indicate the 5 MLH1 peaks corresponding to methylated sites. The intensities of these peaks are higher in (C) and (D) compared to (B). In both tumor samples additional peaks appear which are not present or are just barely visible in leukocytes; these correspond to methylated areas in other MMR genes analyzed by the kit.
