

Abstract
Alterations in global DNA methylation levels have been associated with chronic diseases. Despite the increase in the number of studies measuring markers of global methylation, few have adequately examined within-individual differences by source of DNA and whether within-individual differences by source of DNA differ by age, race and other lifestyle factors. We examined correlations between peripheral mononuclear cell (PBMC) and granulocyte DNA methylation levels measured by the luminometric methylation assay (LUMA), and in LINE-1, Sat2, and Alu by MethyLight and pyrosequencing, in the same individual in 112 women participating in The New York City Multiethnic Breast Cancer Project. Levels of DNA methylation of Sat2 by MethyLight (r = 0.57; P < 0.01) and LINE-1 by pyrosequencing (r = 0.30; P < 0.01) were correlated between PBMC and granulocyte DNA of the same individuals, but LUMA and Alu levels were not. The magnitude of the correlations for Sat2 and LINE-1 varied when stratified by selected demographic and lifestyle factors, although the study sample size limited our comparisons across subgroups. These results lend further support to the importance of considering the source of DNA in epidemiologic studies of white blood cell DNA methylation. Results from studies that combine individuals with different available DNA sources need to be interpreted with caution.
Keywords: Alu, DNA methylation, LINE-1, LUMA, Sat2
Abbreviations
- LUMA
Luminometric methylation assay
- PBMC
peripheral mononuclear cell
Introduction
Alterations in the epigenome have been related to several complex chronic diseases such as asthma, autoimmune and neurologic disorders, and cancer.1-4 Global DNA methylation biomarkers are separated into those that determine levels in specific repeat sequences, such as LINE-1, Alu, and Sat2, and those that directly measure 5mC levels at all or a fraction of all CpG sites. LINE-1 and Alu have been frequently measured in epidemiologic studies using assays such as Taqman-based MethyLight or pyrosequencing.5 Measuring directly 5mC content in population studies has been more challenging because of the cost and the amount and quality of DNA needed. Alternative methods, such as differential digestion of the DNA with methylation sensitive enzymes are available but have not been frequently used.6 In the few epidemiologic studies that have measured several global epigenetic markers at once, different measures were not strongly correlated with each other, suggesting they represent different biological constructs that should not be used interchangeably.7,8
Studies of global DNA methylation biomarkers have commonly determined levels in peripheral tissue such as blood because it is readily accessible, and it has been associated with disease, environmental exposures, and behavioral factors.3 White blood cells (WBC) or leukocytes are composed of different proportions of distinct cell populations. Granulocytes are the largest WBC fraction composed largely of neutrophils. The other major fraction is peripheral blood mononuclear cells (PBMC), which has the longest life span of all blood cells and are considered to better represent biological changes related to environmental exposures or modifications of lifestyle and behavior. Because of the heterogeneity of leukocytes, several studies have investigated how DNA methylation biomarkers compare among the different cell fractions.9-17 Most of this research has shown differences in DNA methylation levels at promoter regions of certain genes or other specific genomic sites, when investigating different blood cell fractions.9,10,13,16,17 However, only 2 studies investigated global DNA methylation biomarkers among blood cell fractions, finding that these measures are mostly not correlated between blood cell subtypes and that DNA methylation at the LINE-1 repeat might be correlated to the percentages of some of the blood fractions.14,18 An additional challenge in epidemiologic studies is the fact that WBC composition also varies in relation to demographic factors such as gender, ethnicity and age which have also shown to be associated to changes in DNA methylation biomarkers.1 Therefore, a better understanding of biomarker measurement variations between cell types and how these differences relate to demographic factors is needed.
Here, we performed a cross-sectional analysis comparing levels from 2 sources in 112 women enrolled in the New York City Multiethnic Breast Cancer Project to understand the relation between different blood cell types and global DNA methylation measures. We also investigated whether correlations between granulocytes and PBMC differed when considering demographic and behavioral characteristics in this population of healthy women. We examined these associations for 4 different global DNA methylation biomarkers: LINE-1, Alu, Sat2, and the luminometric methylation assay (LUMA).
Results
In Table 1, we show the means and standard deviations (SD) of all repetitive element measurements by age and ethnicity of the study sample. Mean levels in granulocyte and PBMC DNA are statistically significantly different for all epigenetic markers studied. We observed lower levels of DNA methylation in granulocyte DNA than in PBMC for LINE-1 (Gran 77.3% vs. PBMC 91.2%, P = 0.02), Sat2 (Gran 59.3% vs. PBMC 72.8%, P = 0.01), and Alu (Gran 46.4% vs. PBMC 108.0%, P = 0.01) measured by MethyLight. Measurements of the LUMA assay were lower for granulocyte than for PBMC DNA (Gran 68.1% vs. 69.3%, P = 0.06). In contrast, LINE-1 DNA methylation levels measured by pyrosequencing of granulocytes were higher than those of PBMC DNA (Gran 75.9% vs. PBMC 75.1%, P = 0.01).
Table 1.
DNA methylation levels of the repetitive elements Alu, Sat2 and LINE-1, and global DNA methylation by LUMA for granulocytes and peripheral blood mononuclear cells in healthy women in the New York City Multiethnic Breast Cancer Project, overall and stratified by age and race/ethnicity Mean percentages, standard deviations (SD) and P values of the differences between granulocyte and PBMC for each marker are shown
| Age (years) |
Race/ Ethnicity |
|||||||||||||||
|---|---|---|---|---|---|---|---|---|---|---|---|---|---|---|---|---|
| Overall sample (N = 112) |
≤ 50 (N = 57) |
> 50 (N = 55) |
White (N = 28) |
Hispanic Caribbean (N = 14) |
Afro-Caribbean (N = 21) |
African American (N = 46) |
||||||||||
| Variable (N) | % DNA meth (SD) | 95% CI | % DNA meth (SD) | 95% CI | % DNA meth (SD) | 95% CI | % DNA meth (SD) | 95% CI | % DNA meth (SD) | 95% CI | % DNA meth (SD) | 95% CI | % DNA meth (SD) | 95% CI | ||
| MethyLight | Alu | PBMC | 108.0 (47.0) | 99.2–116.8 | 110.2 (48.3) | 97.4–123.0 | 105.6 (45.9) | 93.2–118.1 | 101.2 (32.5) | 88.6–113.8 | 96.3 (29.1) | 79.5–113.2 | 112.1 (65.3) | 82.4–141.9 | 112.6 (50.1) | 97.7–127.5 |
| Gran | 46.4 (10.3) | 44.5–48.3 | 47.0 (11.2) | 44.0–49.9 | 45.8 (9.3) | 43.3–48.4 | 44.9 (10.8) | 40.7–49.0 | 48.8 (12.4) | 41.6–55.9 | 50.3 (8.7) | 46.4–54.2 | 44.6 (9.7) | 41.7–47.5 | ||
| P | <0 .01 | <0 .01 | <0 .01 | <0 .01 | <0 .01 | 0.01 | <0 .01 | |||||||||
| Sat2 | PBMC | 72.8 (27.9) | 67.6–78.0 | 75.4 (29.1) | 67.7–83.2 | 70.1 (26.6) | 62.9–77.3 | 64.2 (21.4) | 55.9–72.6 | 70.1 (19.1) | 59.1–81.2 | 73.8 (31.9) | 59.3–88.3 | 78.0 (30.8) | 68.8–87.1 | |
| Gran | 59.3 (24.5) | 54.7–63.9 | 58.4 (25.0) | 51.8–65.0 | 60.2 (24.2) | 53.7–66.7 | 53.2 (21.8) | 44.8–61.7 | 61.5 (24.7) | 47.2–75.7 | 66.1 (25.4) | 54.5–77.6 | 59.2 (25.7) | 51.5–66.8 | ||
| P | 0.01 | <0 .01 | 0.01 | 0.02 | 0.04 | 0.27 | <0 .01 | |||||||||
| LINE-1 | PBMC | 91.2 (56.8) | 80.5–101.8 | 92.6 (64.5) | 75.5–109.7 | 89.7 (48.1) | 76.7–102.7 | 86.6 (48.7) | 67.7–105.5 | 92.6 (57.5) | 59.4–125.8 | 116.7 (93.9) | 74.2–159.2 | 83.5 (35.0) | 73.1–93.9 | |
| Gran | 77.3 (22.6) | 73.1–81.5 | 74.1 (22.5) | 68.1–80.1 | 80.6 (22.4) | 74.6–86.6 | 77.8 (22.9) | 68.9–86.6 | 83.5 (16.4) | 74.0–93.0 | 80.6 (23.8) | 69.8–91.5 | 74.6 (23.9) | 67.5–81.7 | ||
| P | 0.02 | 0.04 | 0.21 | 0.39 | 0.58 | 0.1 | 0.18 | |||||||||
| Pyrosequencing LINE-1 | PBMC | 75.1 (1.7) | 74.8–75.4 | 75.1 (1.8) | 74.7–75.6 | 75.1 (1.6) | 74.6–75.5 | 74.9 (1.5) | 74.4–75.5 | 74.9 (1.5) | 73.9–75.8 | 75.0 (1.8) | 74.2–75.8 | 75.4 (1.8) | 74.8–75.9 | |
| Gran | 75.9 (2.1) | 75.5–76.3 | 75.5 (2.1) | 74.9–76.0 | 76.4 (2.1) | 75.8–77.0 | 75.6 (2.1) | 74.8–76.4 | 76.8 (1.8) | 75.7–77.9 | 75.8 (1.9) | 74.9–76.7 | 75.9 (2.4) | 75.2–76.6 | ||
| P | 0.01 | 0.25 | 0.01 | 0.10 | 0.01 | 0.04 | 0.21 | |||||||||
| LUMA | PBMC | 69.3 (4.7) | 68.4–70.2 | 70.3 (4.7) | 69.1–71.6 | 68.2 (4.5) | 66.9–69.4 | 69.2 (4.7) | 67.3–71.0 | 68.6 (4.3) | 66.1–71.1 | 69.6 (5.1) | 67.3–72.0 | 69.6 (4.7) | 68.2–71.0 | |
| Gran | 68.1 (5.2) | 67.1–69.1 | 68.3 (5.0) | 67.0–69.6 | 67.9 (5.4) | 66.4–69.4 | 67.5 (5.2) | 65.5–69.6 | 67.2 (5.0) | 64.4–70.1 | 67.4 (5.2) | 65.1–69.8 | 69.0 (5.4) | 67.4–70.6 | ||
| P | 0.06 | 0.02 | 0.76 | 0.20 | 0.42 | 0.12 | 0.48 | |||||||||
After stratifying by age, differences between PBMC and granulocytes remained with few exceptions. LINE-1 measures by pyrosequencing were similar in PBMC and granulocyte DNA of individuals younger than 50 y old (Table 1, Gran 75.5% vs. PBMC 75.1%, P = 0.25). In contrast, LINE-1 MethyLight levels from different cell types were not statistically significantly different in those older than 50 y old (Table 1, Gran 80.6% vs. PBMC 89.7%, P = 0.21), and neither were levels measured by LUMA (Table 1, Gran 67.9% vs. PBMC 68.2%, P = 0.76). No other age differences were observed.
For Alu, we observed no difference between granulocytes and PBMC when stratifying by race/ethnicity categories; and only one difference was observed for Sat2 when stratifying by these categories (Table 1). Sat2 granulocyte and PBMC levels in Afro-Caribbeans were no longer statistically significantly different (Gran 66.1% vs. PBMC 73.8%, P = 0.27). There was less consistency in the differences between LINE-1 granulocyte and PBMC levels measured by both methods. Differences between granulocytes and PBMC were observed in the Hispanic-Caribbean and Afro-Caribbean categories (Hispanic-Caribbean: Gran 76.8% vs. 74.9%, P = 0.01; Afro-Caribbean: Gran 75.8% vs. 75%, P = 0.04); in other race and ethnicity categories there were no differences observed for LINE-1 regardless of the method used. No differences by race/ethnicity categories were observed in granulocytes and PBMC for LUMA similar to the measures of the overall sample. No differences between race and ethnicity categories were observed for any of the markers among the same cell type (data not shown).
In Table 2, we report Spearman correlation coefficients between PBMC and granulocyte DNA methylation levels in the same individual for all markers. Only Sat 2 (r = 0.57, P < 0.0001) and LINE-1 measured by pyrosequencing (r = 0.31, P = 0.0007) were correlated between granulocyte and PBMC. The correlation between these cell types varied by demographic and life style categories. For Sat2, levels were not correlated for Afro-Caribbeans, current smokers, and individuals with a BMI of less than 25. Levels of LINE-1 measured by pyrosequencing were statistically significantly positively correlated for Afro Caribbeans (r = 0.56, P < 0.01) and whites (r = 0.45, P < 0.05), never smokers (r = 0.39, P < 0.01), current drinkers (r = 0.46, P < 0.01), those younger than 50 y old (r = 0.40, P < 0.01), those who exercise more than 2 hours a week (r = 0.44, P < 0.01), and those with a BMI lower than 25 (r = 0.58, P < 0.01). While the magnitude of the correlations coefficients differed by these factors, these differences were not statistically significant.
Table 2.
Spearman correlation coefficients between granulocyte and peripheral blood mononuclear cells DNA methylation measures in the New York City Multiethnic Breast Cancer Project overall and by demographic and behavioral characteristics
| MethyLight |
|||||
|---|---|---|---|---|---|
| Variable (%) | LINE-1 | Sat2 | Alu | Pyrosequencing LINE-1 | LUMA |
| Overall | 0.08 | 0.57* | 0.08 | 0.31* | 0.15 |
| Age in years | |||||
| ≤50 (51%) | 0.07 | 0.49* | 0.07 | 0.40* | 0.09 |
| >50 (49%) | 0.04 | 0.67* | 0.11 | 0.23 | 0.23 |
| Race/ Ethnicity | |||||
| Hispanic Caribbean (12%) | 0.08 | 0.76* | 0.18 | 0.39 | 0.28 |
| White (25%) | 0.20 | 0.38* | 0.11 | 0.45* | 0.12 |
| African Caribbean (19%) | 0.11 | 0.40 | -0.07 | 0.56* | 0.17 |
| African American (41%) | −0.06 | 0.60* | 0.15 | 0.12 | 0.24 |
| Smoking Status | |||||
| Never (66%) | −0. 01 | 0.50* | 0.03 | 0.39* | 0.19 |
| Former (23%) | 0.11 | 0.71* | 0.21 | 0.29 | −0.12 |
| Current (11%) | 0.59* | 0.52 | 0.13 | −0.18 | 0.11 |
| BMI | |||||
| <25 (29%) | 0.12 | 0.34 | 0.01 | 0.58* | 0.16 |
| 25–30 (29%) | −0.10 | 0.56* | 0.02 | 0.31 | 0.29 |
| 30+ (41%) | 0.13 | 0.66* | 0.14 | 0.25 | −0.07 |
| Alcohol consumption | |||||
| Never (38%) | 0.35 | 0.62* | 0.15 | 0.13 | 0.08 |
| Former (17%) | −0.37 | 0.47* | −0.11 | 0.18 | 0.05 |
| Current (44%) | −0.01 | 0.56* | 0.08 | 0.46* | 0.20 |
| Physical Activity | |||||
| None (12%) | −0. 36 | 0.67* | 0.10 | 0.17 | 0.47 |
| <2 hr/wk (49%) | 0.12 | 0.61* | 0.24 | 0.22 | 0.17 |
| ≥2 hr/wk (38%) | 0.13 | 0.42* | −0.13 | 0.44* | −0.07 |
<0 .05
Figure 1 shows plots of granulocyte and PBMC DNA methylation levels for Sat2 and LINE-1. Linear regression models adjusted for the demographic and lifestyle categories suggest granulocyte DNA methylation levels can predict PBMC levels for Sat2 and LINE-1 when measured by pyrosequencing. Adjusted estimates for Sat2 and LINE-1 were 0.55 (95% CI: 0.35, 0.75) and 0.21 (95% CI: 0.06, 0.37), respectively.
Figure 1.
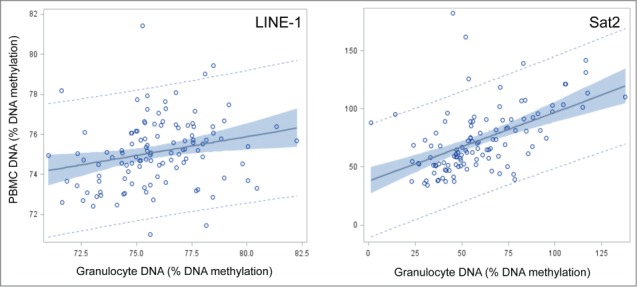
Correlation plots of peripheral blood mononuclear cells (PBMC) and granulocyte DNA methylation percentages for LINE-1 and Sat2 in the New York City Multiethnic Breast Cancer Project.
In Figure 2, we show the plots for the correlations between the 2 measurements of LINE-1, MethyLight and pyrosequencing, for the different cell subtypes. No statistically significant correlations were observed for either granulocyte or PBMC DNA. The granulocyte and PBMC Spearman correlation coefficients were 0.13 (P = 0.18), and -0.17 (P = 0.07), respectively.
Figure 2.
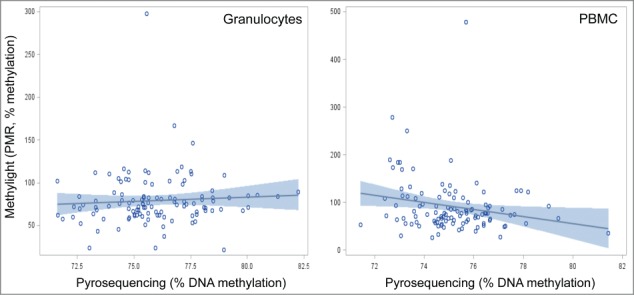
Correlation plots of LINE-1 methylation by pyrosequencing and MethyLight measures in peripheral mononuclear cells (PBMC) (A), and granulocytes (B) in the New York City Multiethnic Breast Cancer Project.
Discussion
We found that DNA methylation levels in PMBC and granulocytes were statistically significantly different in the same individual for LINE-1, Alu, and Sat2. However, although the differences were statistically significant, they were quite small and might not indicate a biologically relevant difference between cell types. We observed modest to moderate correlations between DNA methylation levels of LINE-1, measured by pyrosequencing, and Sat2, measured by MethyLight, between PBMC and granulocyte DNA of the same individual. These correlations varied when considering demographic and lifestyle factors, although our study sample size limited our evaluations by subgroup. These results lend further support to the importance of considering source of DNA when conducting and interpreting data on epidemiologic studies of white blood cell DNA methylation.
Blood is a complex specimen and studies are designed differently to collect specific blood cell fractions depending on the goals of the researchers. Previous research has shown that considering blood cell type is relevant when investigating global epigenetic markers. Zhu et al investigated the association of different blood cell fractions and the levels of LINE-1 and Alu DNA methylation measured by pyrosequencing.18 The authors found increasing neutrophil counts to be positively related to LINE-1 DNA methylation and conversely, they observed the percentage of lymphocyte DNA to be negatively associated with DNA methylation in this repeat. Their research did not show any associations for Alu DNA methylation levels, or with other cell fractions and the overall WBC counts.18
The findings of this study are in support of our previously published work in a separate population investigating correlations of global DNA methylation markers in different blood subtypes.14 In that study, we found a significant correlation for Sat2 in PBMC and granulocytes (Spearman correlation coefficient of 0.38 (P = 0.01)). There, we also did not observe statistically significant correlations between these cell types for LUMA and levels of DNA methylation in the repetitive elements. In this previous work, we did not observe a strong correlation with LINE-1, but we used the MethyLight assay. In contrast, here the correlation is significant when using pyrosequencing to determine LINE-1 DNA methylation.14 Here we are also able to directly compare both measures of LINE-1 for the same individual. We performed these comparisons within the same cell fraction to avoid any effect as a result of the differential DNA pattern of a particular blood cell subtype. There was no correlation for the 2 LINE-1 measures in either cell subtype, PBMC nor granulocytes. MethyLight is a TaqMan-based methodology, which provides a relative quantitative measure of DNA methylation levels, and only give a positive signal when all CpG sites in the PCR primers and Taqman probe are fully methylated.19 However, LINE-1 pyrosequencing is a bisulfite sequencing-based method, which makes a more accurate measure of DNA methylation levels at each CpG site. Both assays use PCR amplification and share the limitations related to its use: PCR amplification bias and efficiency variations. The range of values and the standard deviations for both assays show that the MethyLight assay (shown in Table 1 and Fig. 2) has a larger variability. In MethyLight, another repetitive sequence (a fragment within the Alu element) is used as a reference for DNA input. This repeat might vary among individuals, which can limit the reliability of the results. The calculation of the PMR uses the values from a fully methylated DNA, and 2 separate reactions of the sample; these are all performed in duplicate, which might increase the effect of variable reaction efficiency in the final methylation percentage calculations. Determining levels of DNA methylation of LINE-1 by pyrosequencing does not have these limitations, pyrosequencing is more expensive than MethyLight and the assays commonly used only determine DNA methylation at 3 sites in the promoter region of the LINE-1 element. This indicates that not only the type of marker but the methodology used might have an impact on global epigenetic measures.
While levels in the global epigenetic biomarkers are consistently different between PBMC and granulocyte DNA, we found that some epigenetic markers (Sat2 and LINE-1 measured by pyrosequencing) are positively correlated but others (Alu, LINE-1 by MethyLight and LUMA) are not. The differential correlation between blood cell types among the measures studied supports the notion that these represent individual biological constructs and their levels are affected differently among the blood cell types. Lifestyle and demographic characteristics such as age and ethnicity can modify the percentages of neutrophils and lymphocytes in blood20-23 and associations with these cell counts and LINE-1 levels have been reported, suggesting that this biomarker could be affected by lifestyle or demographic data. Although in our analysis the magnitude of the correlation coefficients differed by covariates such as age, the differences between these coefficients were not statistically significant (eg. Sat2 ≤ 50 r = 0.49 and > 50 r = 0.67, P-value of comparison = 0.168). The small size of our study, limited our power to examine subgroup differences. Larger studies are needed to formally evaluate the differences between subgroups.
Our study has several strengths. We measured several epigenetic markers that have been commonly used in large epidemiologic studies, in different sources of DNA available for all participants. Our study population is also racially and ethnically diverse allowing us to investigate the association of epigenetic makers and different racial groups. We were able to explore the measurements of global epigenetic biomarkers, in particular the limitations of using different methodologies such as in determining methylation levels of LINE-1, and compare the different techniques. However, we were not able to investigate within individual variation, and compare it with assay variation because of a lack of sample availability. We were also limited, by our overall sample size to explore multivariate associations. Our research was performed in a female study population only, while our results should be able to be generalized to male cohort it would be important to replicate these findings in that population. In addition, larger studies would aid in providing a better understanding of how epigenetic biomarkers relate to epidemiologic risk factors such as demographic and life style characteristics. Overall this work highlights the importance of considering blood cell type when investigating global epigenetic markers in epidemiologic studies.
Materials and Methods
Study population: We used epidemiologic data and DNA from 112 women participating in the New York City Multiethnic Breast Cancer Project.24 The study participants were recruited during screening mammography appointments in the Radiology Department of the Long Island City Hospital between January 2007 and April 2008. Participants provided information on personal and family medical history, reproductive history, and socio-demographic and behavioral factors such smoking history, alcohol consumption and physical activity.
Specimen collection, DNA extractions and bisulfite conversion
We collected blood samples at the time of recruitment. We separated granulocytes from PBMC in the white blood cell fraction by using Ficoll® Paque PLUS (17–1440–02, GE Healthcare Biosciences) following the manufacturer's instructions. Briefly, blood was layered on Ficoll and centrifuged at 2700 rpm for 25 min at room temperature. If the layers are well defined after centrifugation, the PBMC layer is extracted from above the Ficoll, and the granulocyte fraction is removed from above the erythrocyte layer. Genomic DNA from each subtype, was extracted by standard salting out procedures. After quantification, aliquots of DNA (500 ng) were bisulfite-treated with the EZ DNA methylation kit (D5001, Zymo Research Corporation) following the manufacturer's protocol. We use Human HCT116 DKO Methylated DNA (D5014–2, Zymo Research Corporation) as our fully methylated positive control for all assays, and use the REPLI-g Mini Kit (150023, Qiagen Corporation) to generate an unmethylated sample by whole genome amplification of DNA from a pool of lymphocytic cell lines, as our negative control. These fully methylated and unmethylated DNA samples were run in all the assay batches as reference samples to monitor data quality.
Epigenetic biomarkers
LINE-1 Pyrosequencing assay: Pyrosequencing for LINE-1 methylation levels was carried out using PCR and sequencing primers as previously described, and 10 ng of DNA were used for each amplification reaction for all samples, regardless of cell fraction.8,25,26 Pyrosequencing was conducted using a PyroMark Q24 instrument (Qiagen, Hilden, Germany) with subsequent quantitation of methylation levels determined with the PyroMark Q24 1.010 software. Relative peak heights were used to calculate the percentage of methylated cytosines at each given site. Percent methylation within a sample was subsequently determined by averaging across all 3 interrogated CpG sites in the analysis. Each set of amplifications included bisulfite-converted CpGenome universal methylated, unmethylated and non-template controls. The unmethylated sample had DNA methylation percentages of 5.2%, and the fully methylated sample had a percentage of 79.2%. The inter assay coefficient of variation was 1.2%.
Luminometric methylation assay (LUMA): The luminometric methylation assay was performed as previously described.27 DNA (100 ng) was digested for each sample, regardless of cell fraction, with 2 isoschizomers that digest DNA differentially depending on the methylation status of the CpG site contained within the 5’-CCGG-3’ sequence. MspI and HpaII target the same sequence; however, MspI will digest all CCGG sites and HpaII digestions will be blocked by the presence of a 5-methylcytosines in the second position. An additional enzyme, EcoRI, is used in the individual digests as a reference for DNA amount present in the reaction mixture. Pyrosequencing performed as indicated above, is used to sequence the overhangs left by each double digest. Percentage of DNA methylation is expressed as (1-(HpaII/EcoRIΣG/ΣT)/ (MspI/ EcoRIΣG/ΣT))*100. For this assay, fully methylated sample had a percentage of 80.0%. The unmethylated sample with DNA methylation percentages of 51.9%, was in this case Human HCT116 DKO Non-methylated DNA (D5014–1, Zymo Research Corporation) because whole genome amplifications generate single stranded ends not suitable for this assay. The inter-assay coefficient of variation was 1.5%.
MethyLight assay to determine LINE-1, Sat2, and Alu DNA methylation levels: We performed real-time PCR using 2 ng of each sample, regardless of cell fraction, with sequences of probes and forward and reverse primers of LINE-1-M1, Sat2-M1 and Alu-M2 that have been described previously.8,19 Universal methylated DNA served as a methylated reference, and an Alu-based control reaction (AluC4) was used to measure the levels of input DNA to normalize the signal for each methylation reaction. The Human HCT116 DKO Methylated DNA (D5014–2, Zymo Research Corporation) was used as the 100% methylated reference sample. Each MethyLight reaction was performed in duplicate, and the percent of methylated reference (PMR) values represent the mean. The inter assay coefficient of variation was 1.2%. For each repeat LINE-1, Alu, and Sat2, the DNA methylation percentage was expressed as PMR values. The PMR is a relatively quantitative measure and obtained percentages can be above 100% because the number of consensus sequences might be different between each individual sample and the methylated reference control.
PMR = 100% * 2 exp - [Delta Ct (sample repeat − sample AluC4) − Delta Ct (methylated reference repeat − methylated reference AluC4)].
Statistical analyses: We used ANOVA to test the DNA methylation levels of the different biomarkers in the categorical analysis of behavioral and demographic factors including age, smoking history, alcohol consumption, BMI and physical activity.
To determine the coefficient of variability of each assay, we reran 10% of the samples, selected at random. We also calculated the Spearman correlation coefficients for the correlations between the 2 LINE-1 measurements, MethyLight and pyrosequencing.
We calculated Spearman correlation coefficients between PBMC and granulocyte DNA for each biomarker, and we examined Spearman correlations stratified by age and race/ethnicity. We did not have lifestyle and demographic data for all participants therefore sample size for race/ethnicity, alcohol consumption, BMI and physical activity are not the same. We further used a z-test to determine whether the correlation coefficients stratified by risk factors were different.28
Ethics Committee
The Institutional Review Boards at Columbia University Medical Center, Long Island College Hospital and Long Island University approved this study, and all participants provided written informed consent.
Disclosure of Potential Conflicts of Interest
No potential conflicts of interest were disclosed.
Acknowledgments
We would like to thank Diane Levy, Wendy Lewis, Gladys Rivera, Joy White, Jessica Cabildo and Renata Khanis for assisting with data collection and recruitment activities; and Irina Gurvich for specimen collection and storage management.
Funding
This work was funded by grants from the National Cancer Institute (U54 CA101598) and the National Institute of Environmental Health Sciences Center Support (ES009089). Neomi Vin-Raviv was partly supported by a post-doctoral fellowship from the Environment and Health Fund, Jerusalem, Israel; and Lissette Delgado-Cruzata was partly supported by NCI R25 CA094061–08S1.
References
- 1. Terry MB, Delgado-Cruzata L, Vin-Raviv N, Wu HC, Santella RM. DNA methylation in white blood cells: association with risk factors in epidemiologic studies. Epigenetics 2011; 6:828-37; PMID:21636973; http://dx.doi.org/ 10.4161/epi.6.7.16500 [DOI] [PMC free article] [PubMed] [Google Scholar]
- 2. Meda F, Folci M, Baccarelli A, Selmi C. The epigenetics of autoimmunity. Cell Mol Immunol 2011; 8:226-36; PMID:21278766; http://dx.doi.org/ 10.1038/cmi.2010.78 [DOI] [PMC free article] [PubMed] [Google Scholar]
- 3. Baccarelli A, Ghosh S. Environmental exposures, epigenetics and cardiovascular disease. Curr Opin Clin Nutr Metab Care 2012; 15:323-9; PMID:22669047; http://dx.doi.org/ 10.1097/MCO.0b013e328354bf5c [DOI] [PMC free article] [PubMed] [Google Scholar]
- 4. Woo HD, Kim J. Global DNA hypomethylation in peripheral blood leukocytes as a biomarker for cancer risk: a meta-analysis. PLoS One 2012; 7:e34615; PMID:22509334; http://dx.doi.org/ 10.1371/journal.pone.0034615 [DOI] [PMC free article] [PubMed] [Google Scholar]
- 5. Nelson HH, Marsit CJ, Kelsey KT. Global methylation in exposure biology and translational medical science. Environ Health Perspect 2011; 119:1528-33; PMID:21669556; http://dx.doi.org/ 10.1289/ehp.1103423 [DOI] [PMC free article] [PubMed] [Google Scholar]
- 6. Delgado-Cruzata L, Wu HC, Perrin M, Liao Y, Kappil MA, Ferris JS, Flom JD, Yazici H, Santella RM, Terry MB. Global DNA methylation levels in white blood cell DNA from sisters discordant for breast cancer from the New York site of the Breast Cancer Family Registry. Epigenetics 2012; 7:868-74; PMID:22705975; http://dx.doi.org/ 10.4161/epi.20830 [DOI] [PMC free article] [PubMed] [Google Scholar]
- 7. Choi JY, James SR, Link PA, McCann SE, Hong CC, Davis W, Nesline MK, Ambrosone CB, Karpf AR. Association between global DNA hypomethylation in leukocytes and risk of breast cancer. Carcinogenesis 2009; 30:1889-97; PMID:19584139; http://dx.doi.org/ 10.1093/carcin/bgp143 [DOI] [PMC free article] [PubMed] [Google Scholar]
- 8. Wu HC, Delgado-Cruzata L, Flom JD, Perrin M, Liao Y, Ferris JS, Santella RM, Terry MB. Repetitive element DNA methylation levels in white blood cell DNA from sisters discordant for breast cancer from the New York site of the Breast Cancer Family Registry. Carcinogenesis 2012; 33:1946-52; PMID:22678115; http://dx.doi.org/ 10.1093/carcin/bgs201 [DOI] [PMC free article] [PubMed] [Google Scholar]
- 9. Koestler DC, Christensen B, Karagas MR, Marsit CJ, Langevin SM, Kelsey KT, Wiencke JK, Houseman EA. Blood-based profiles of DNA methylation predict the underlying distribution of cell types: a validation analysis. Epigenetics 2013; 8:816-26; PMID:23903776; http://dx.doi.org/ 10.4161/epi.25430 [DOI] [PMC free article] [PubMed] [Google Scholar]
- 10. Adalsteinsson BT, Gudnason H, Aspelund T, Harris TB, Launer LJ, Eiriksdottir G, Smith AV, Gudnason V. Heterogeneity in white blood cells has potential to confound DNA methylation measurements. PLoS One 2012; 7:e46705; PMID:23071618; http://dx.doi.org/ 10.1371/journal.pone.0046705 [DOI] [PMC free article] [PubMed] [Google Scholar]
- 11. Talens RP, Boomsma DI, Tobi EW, Kremer D, Jukema JW, Willemsen G, Putter H, Slagboom PE, Heijmans BT. Variation, patterns, and temporal stability of DNA methylation: considerations for epigenetic epidemiology. FASEB J 2010; 24:3135-44; PMID:20385621; http://dx.doi.org/ 10.1096/fj.09-150490 [DOI] [PubMed] [Google Scholar]
- 12. Reinius LE, Acevedo N, Joerink M, Pershagen G, Dahlen SE, Greco D, Söderhäll C, Scheynius A, Kere J. Differential DNA methylation in purified human blood cells: implications for cell lineage and studies on disease susceptibility. PLoS One 2012; 7:e41361; PMID:22848472; http://dx.doi.org/ 10.1371/journal.pone.0041361 [DOI] [PMC free article] [PubMed] [Google Scholar]
- 13. Jacoby M, Gohrbandt S, Clausse V, Brons NH, Muller CP. Interindividual variability and co-regulation of DNA methylation differ among blood cell populations. Epigenetics 2012; 7:1421-34; PMID:23151460; http://dx.doi.org/ 10.4161/epi.22845 [DOI] [PMC free article] [PubMed] [Google Scholar]
- 14. Wu HC, Delgado-Cruzata L, Flom JD, Kappil M, Ferris JS, Liao Y, Santella RM, Terry MB. Global methylation profiles in DNA from different blood cell types. Epigenetics 2011; 6:76-85; PMID:20890131; http://dx.doi.org/ 10.4161/epi.6.1.13391 [DOI] [PMC free article] [PubMed] [Google Scholar]
- 15. Shen H, Qiu C, Li J, Tian Q, Deng HW. Characterization of the DNA methylome and its interindividual variation in human peripheral blood monocytes. Epigenomics 2013; 5:255-69; PMID:23750642; http://dx.doi.org/ 10.2217/epi.13.18 [DOI] [PMC free article] [PubMed] [Google Scholar]
- 16. Lam LL, Emberly E, Fraser HB, Neumann SM, Chen E, Miller GE, Kobor MS. Factors underlying variable DNA methylation in a human community cohort. Proc Natl Acad Sci U S A 2012; 109 Suppl 2:17253-60; PMID:23045638; http://dx.doi.org/ 10.1073/pnas.1121249109 [DOI] [PMC free article] [PubMed] [Google Scholar]
- 17. Kochanek S, Radbruch A, Tesch H, Renz D, Doerfler W. DNA methylation profiles in the human genes for tumor necrosis factors α and β in subpopulations of leukocytes and in leukemias. Proc Natl Acad Sci U S A 1991; 88:5759-63; PMID:2062856; http://dx.doi.org/ 10.1073/pnas.88.13.5759 [DOI] [PMC free article] [PubMed] [Google Scholar]
- 18. Zhu ZZ, Hou L, Bollati V, Tarantini L, Marinelli B, Cantone L, Yang AS, Vokonas P, Lissowska J, Fustinoni S, et al. Predictors of global methylation levels in blood DNA of healthy subjects: a combined analysis. Int J Epidemiol 2012; 41:126-39; PMID:20846947; http://dx.doi.org/ 10.1093/ije/dyq154 [DOI] [PMC free article] [PubMed] [Google Scholar]
- 19. Weisenberger DJ, Campan M, Long TI, Kim M, Woods C, Fiala E, Ehrlich M, Laird PW. Analysis of repetitive element DNA methylation by MethyLight. Nucleic Acids Res 2005; 33:6823-36; PMID:16326863; http://dx.doi.org/ 10.1093/nar/gki987 [DOI] [PMC free article] [PubMed] [Google Scholar]
- 20. Jia EZ, Yang ZJ, Yuan B, Zang XL, Wang RH, Zhu TB, Wang LS, Chen B, Ma WZ. Relationship between leukocyte count and angiographical characteristics of coronary atherosclerosis. Acta Pharmacol Sin 2005; 26:1057-62; PMID:16115371; http://dx.doi.org/ 10.1111/j.1745-7254.2005.00169.x [DOI] [PubMed] [Google Scholar]
- 21. Zezulka AV, Gill JS, Beevers DG. ‘Neutropenia’ in black west Indians. Postgrad Med J 1987; 63:257-61; PMID:3684833; http://dx.doi.org/ 10.1136/pgmj.63.738.257 [DOI] [PMC free article] [PubMed] [Google Scholar]
- 22. McCarthy A, Bourke S, Fahy J, Binchy I, Fitzgerald MX. Fatal recurrence of neuroleptic malignant syndrome. Br J Psychiatry 1988; 152:558-9; PMID:3167411; http://dx.doi.org/ 10.1192/bjp.152.4.558 [DOI] [PubMed] [Google Scholar]
- 23. Shin YO, Lee JB. Leukocyte chemotactic cytokine and leukocyte subset responses during ultra-marathon running. Cytokine 2013; 61:364-9; PMID:23273667; http://dx.doi.org/ 10.1016/j.cyto.2012.11.019 [DOI] [PubMed] [Google Scholar]
- 24. Tehranifar P, Reynolds D, Flom J, Fulton L, Liao Y, Kudadjie-Gyamfi E, Terry MB. Reproductive and menstrual factors and mammographic density in African American, Caribbean, and white women. Cancer Causes Control 2011; 22:599-610; PMID:21327938; http://dx.doi.org/ 10.1007/s10552-011-9733-8 [DOI] [PMC free article] [PubMed] [Google Scholar]
- 25. Yang AS, Estecio MR, Doshi K, Kondo Y, Tajara EH, Issa JP. A simple method for estimating global DNA methylation using bisulfite PCR of repetitive DNA elements. Nucleic Acids Res 2004; 32:e38; PMID:14973332; http://dx.doi.org/ 10.1093/nar/gnh032 [DOI] [PMC free article] [PubMed] [Google Scholar]
- 26. Lumey LH, Terry MB, Delgado-Cruzata L, Liao Y, Wang Q, Susser E, McKeague I, Santella RM. Adult global DNA methylation in relation to pre-natal nutrition. Int J Epidemiol 2012; 41:116-23; PMID:22422450; http://dx.doi.org/ 10.1093/ije/dyr137 [DOI] [PMC free article] [PubMed] [Google Scholar]
- 27. Bjornsson HT, Sigurdsson MI, Fallin MD, Irizarry RA, Aspelund T, Cui H, Yu W, Rongione MA, Ekström TJ, Harris TB, et al. Intra-individual Change Over Time in DNA Methylation With Familial Clustering. JAMA 2008; 299:2877-83; http://dx.doi.org/ 10.1001/jama.299.24.2877 [DOI] [PMC free article] [PubMed] [Google Scholar]
- 28. Weaver B, Wuensch KL. SPSS and SAS programs for comparing Pearson correlations and OLS regression coefficients. Behav Res Methods 2013; 45:880-95; PMID:23344734; http://dx.doi.org/ 10.3758/s13428-012-0289-7 [DOI] [PubMed] [Google Scholar]