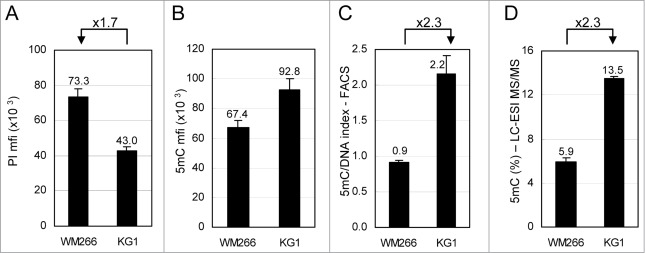
Figure 2.

Comparative analysis of total 5-methylcytosine (5mC) content in cell lines by flow cytometry. WM266–4 melanoma and KG1 leukemia cells were labeled with anti-5mC monoclonal antibody prior to DNA staining with propidium iodide (PI). (A). DNA contents in G0/G1 cells were expressed as PI mfis. (B). 5mC contents in G0/G1 cells were expressed as in Figure 1F (C). 5mC/DNA indexes were calculated as ratios of 5mC mfis vs. PI mfis. (D). Percentages of 5mC among total cytosines were measured by LC-ESI MS/MS.
