

Abstract
Tandem affinity purification (TAP) tagging provides a powerful tool for isolating interacting proteins in vivo. TAP-tag purification offers particular advantages for the identification of stimulus-induced protein interactions. Type II bZIP transcription factors (TGA2, TGA5 and TGA6) play key roles in pathways that control salicylic acid, ethylene, xenobiotic and reactive oxylipin signaling. Although proteins interacting with these transcription factors have been identified through genetic and yeast 2-hybrid screening, others are still elusive. We have therefore generated a C-terminal TAP-tag of TGA2 to isolate additional proteins that interact with this transcription factor. Three lines most highly expressing TAP-tagged TGA2 were functional in that they partially complemented reactive oxylipin-responsive gene expression in a tga2 tga5 tga6 triple mutant. TAP-tagged TGA2 in the most strongly overexpressing line was proteolytically less stable than in the other 2 lines. Only this overexpressing line could be used in a 2-step purification process, resulting in isolation of co-purifying bands of larger molecular weight than TGA2. TAP-tagged TGA2 was used to pull down NPR1, a protein known to interact with this transcription factor. Mass spectrometry was used to identify peptides that co-purified with TAP-tagged TGA2. Having generated this TGA2 TAP-tag line will therefore be an asset to researchers interested in stimulus-induced signal transduction processes.
Keywords: 12-oxo-phytodienoic acid, glutathione-S-transferase, lipid stress, protein complex, thale cress
Abbreviations
- bZIP
basic region/leucine zipper motif
- CaMV
cauliflower mosaic virus
- CBB
calmodulin binding buffer
- CBP
calmodulin-binding peptide
- FDR
false discovery rate
- MS
mass spectrometry
- OPDA
12-oxo-phytodienoic acid
- PGA1
prostaglandin A1
- PPA1
phytoprostane A1
- RubisCo
ribulose-1,5-bisphosphate carboxylase
- SA
salicylic acid
- SAR
systemic acquired resistance
- TAP
tandem affinity purification
- TEV
tobacco etch virus
- Y2H
yeast 2-hybrid
Introduction
Genetic and biochemical approaches have been used to study protein interactions, including the yeast 2-hybrid (Y2H) system and various affinity purification techniques.1 The advantages of affinity purification methods are that interactions can be studied under native physiological and various treatment conditions. To reduce the false-positive discovery rate of affinity purification methods, a tandem affinity purification (TAP)-tag was developed, which contains 2 IgG-binding units of Staphylococcus aureus protein A, a cleavage site for protease from tobacco etch virus (TEV) and a calmodulin-binding peptide (CBP).2 The utility of TAP tagging was recently demonstrated for protein interactions related to brassinosteroid and abscisic signaling.3,4
TGA factors belong to the basic region/leucine zipper motif (bZIP) superfamily of transcription factors;5 they bind to tfhe TGACG motif to regulate defense and developmental processes.6,7 Different methods have been used to study interactions between TGA factors and other proteins. Y2H screens were used to show that 7 TGA factors differentially interact with a key regulator of systemic acquired resistance (SAR), NPR1.8-11 In addition, Y2H screening identified the GRAS protein SCL14 and glutaredoxins as interacting with TGA2.12,13 The significance of interactions between TGA factors and glutaredoxins was later shown not to be restricted to defense responses but also to occur during developmental processes.7 A His-tagged TGA2 was used to pull down NPR1,14 demonstrating early on the feasibility of using affinity purification to identify proteins that interact with TGA factors. Along those lines, TAP-tagged NPR1 was used to pull down a thioredoxin involved in SAR.15
Besides being involved in SAR,16 type II TGA factors (TGA2, TGA5 and TGA6) regulate ethylene-induced defense responses,17 xenobiotic resistance12 and detoxification genes that are responsive to reactive oxylipins,18 the latter of which are formed by oxygenation of polyunsaturated fatty acids.19 Reactive oxylipins contain an α,β-unsaturated carbonyl group20 and include the enzymatically generated 12-oxo-phytodienoic acid (OPDA)21,22 and phytoprostanes, which are products of a radical chain reaction.19 The function of phytoprostanes is likely analogous to structurally related prostaglandins in animals.19,23 Type II TGA factors contribute to 60% and 30% of the gene expression in response to phytoprostane A1 (PPA1) and OPDA, respectively.18 These transcription factors interact with SCL14 to mediate xenobiotic resistance,12 but the transcriptional regulation in response to reactive oxylipins is not understood. We therefore generated a TGA2 construct that contains a C-terminal TAP-tag. A transgenic Arabidopsis thaliana line overexpressing this TGA2 TAP-tag in the background of the tga2 tga5 tga6 triple mutant was identified that could be used for affinity purification of interacting proteins. This line will be an asset for researchers interested in class II TGA factor signaling.
Results
Generation, identification, and functional analysis of lines overexpressing TAP-tagged TGA2 in A. thaliana
We generated transgenic lines, which overexpress TAP-tagged TGA2 in the tga2,5,6 mutant background, for biochemical purification of proteins that interact with this transcription factor in A. thaliana. TGA2 expression was analyzed in 17 transgenic lines to select highly expressing lines using quantitative RT-PCR. Lines 1, 12 and 17 were of interest because they consistently expressed high levels of TGA2 when analyzing 2 independent biological replicates (Fig. 1). Line 7 was not pursued further because gene expression varied greatly between replicates; expression relative to wild type was increased by 2- and 38-fold, respectively. In contrast, expression was elevated more than 14-fold in both replicates when analyzing Lines 1, 12, and 17.
Figure 1.
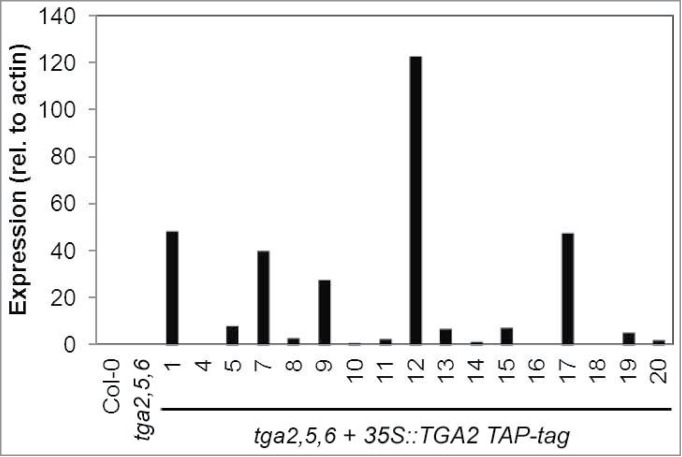
TGA2 expression in transgenic A. thaliana lines. Individual transgenic lines containing a 35S::TGA2 construct with a C-terminal TAP-tag in the genetic background of the tga2,5,6 mutant are shown on the abscissa. Bars represent means of quantitative RT-PCR from 2 biological replicates. TGA2 expression was normalized to the expression of actin. Expression in wild type was arbitrarily set to 1 and expression values in all other genotypes were relative to it.
TGA2 protein levels in these lines were investigated by immunoblot analyses using a polyclonal αTGA antiserum.24 The abundance of TAP-tagged TGA2 protein in the transgenic lines with the predicted molecular mass of 57.5 kDa was much higher than the abundance of endogenous TGA2 in the wild type with a predicted molecular mass of 36.7 kDa (Fig. 2A). Besides the uppermost band, representing the intact recombinant protein, additional bands of smaller molecular mass were identified in the transgenic lines. These smaller bands probably represent degradation products of a proteolytically susceptible transcription factor. Apparent proteolysis was particularly prominent in the transgenic line 12 as compared to lines 1 and 17. Besides these putative proteolytic fragments, a cross-reactive band of ∼40 kDa was also detected.
Figure 2.
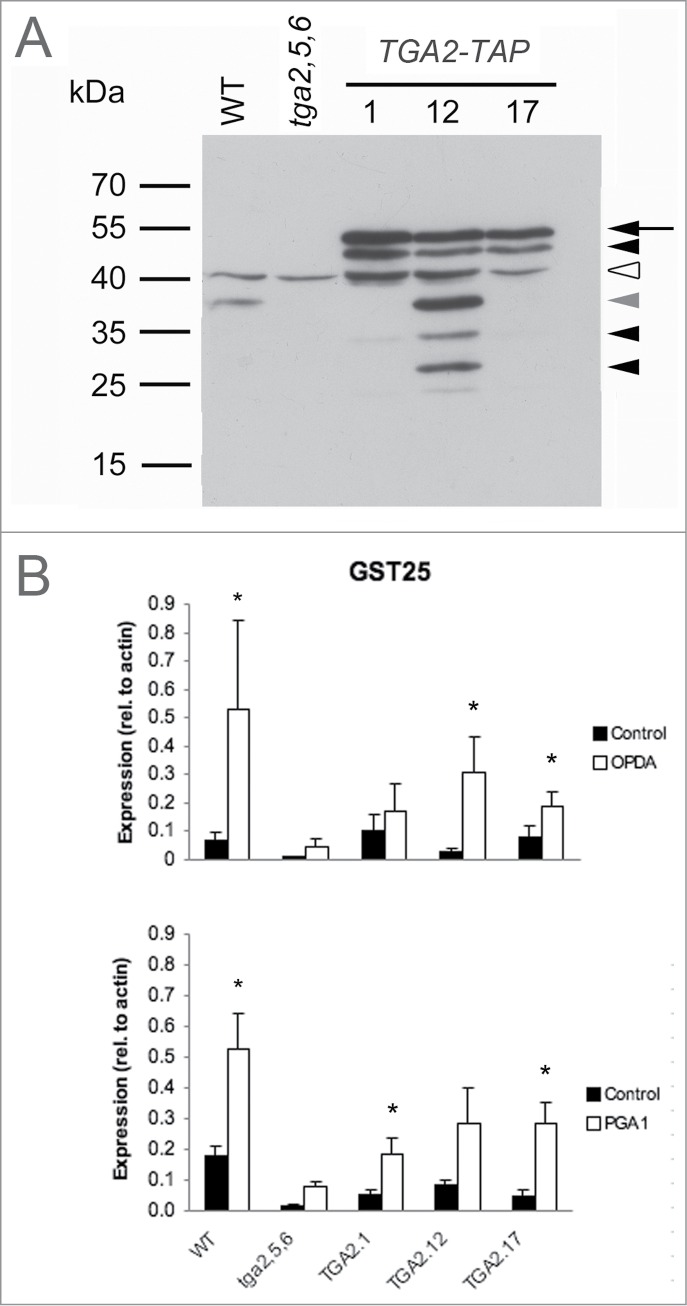
Functional analysis of recombinant TGA2 in transgenic A. thaliana seedlings grown in liquid medium. (A) Immunoblot analysis of TGA2 expression using a polyclonal αTGA2-C antiserum.24 Molecular weight markers and genotypes are indicated on the left and on the top, respectively. Coomassie staining demonstrated that lanes were equally loaded (data not shown). The arrow indicates TAP-tagged TGA2, the white arrowhead indicates a cross-reactive band, and the other arrowheads indicate putative degradation products. The gray arrowhead indicates the predicted size of native TGA2 without the TAP-tag. (B) TGA-dependent and stimulus-induced expression of GST25. Expression relative to actin was based on quantitative RT-PCR. Means and standard errors of 3 biological replicates are shown. Asterisks indicate significant differences between treatment means (P < 0.05) based on Relative Expression Software Tool (REST).35
The functional consequence of TGA2 overexpression in the tga2,5,6 mutant background was assessed by treating A. thaliana seedlings grown in liquid medium with or without inducers of GST25 expression (Fig. 2B). As expected, both OPDA and prostaglandin A1 (PGA1) induced GST25 expression in the wild type. GST25 expression in the tga2,5,6 mutant was below uninduced wild-type levels. Overexpression of the TGA2 TAP-tag restored the induction of GST25 in the tga2,5,6 mutant by ∼50%. These results clearly demonstrate that TAP-tagged TGA2 is functional and partially restores target gene expression in the absence of 2 other TGA factors.
Calmodulin affinity resin pull-down of NPR1 with TAP-tagged TGA2
To test the potential of using TAP-tagged TGA2 for in vivo interaction studies, we examined the known association with NPR1. Specifically, the feasibility of using TAP-tagged TGA2 to purify NPR1 was tested.
Plants of the transgenic A. thaliana line 17 (Fig. 1 and 2) were treated for 30 h with or without 1 mM salicylic acid (SA). Foliar proteins were extracted and incubated with calmodulin affinity resin to partially purify TAP-tagged TGA2. The presence of TGA2 and NPR1 was monitored using the corresponding antibodies. NPR1 co-purified with TAP-tagged TGA2 (Fig. 3). Both TAP-tagged TGA2 and NPR1 were specifically retained on the calmodulin affinity resin and eluted with EGTA. A band of ∼35 kDa cross-reacting with the NPR1 antibody was only detected in extracts and fractions not bound to the calmodulin affinity resin; this band was lost during subsequent affinity purification. A slight increase in the abundance of TGA2 after SA treatment was observed in this experiment (Fig. 3) but this increase was not confirmed in a second experiment (Fig. 4). TAP-tagged TGA2 can therefore be used to purify protein complexes from plant extracts.
Figure 3.
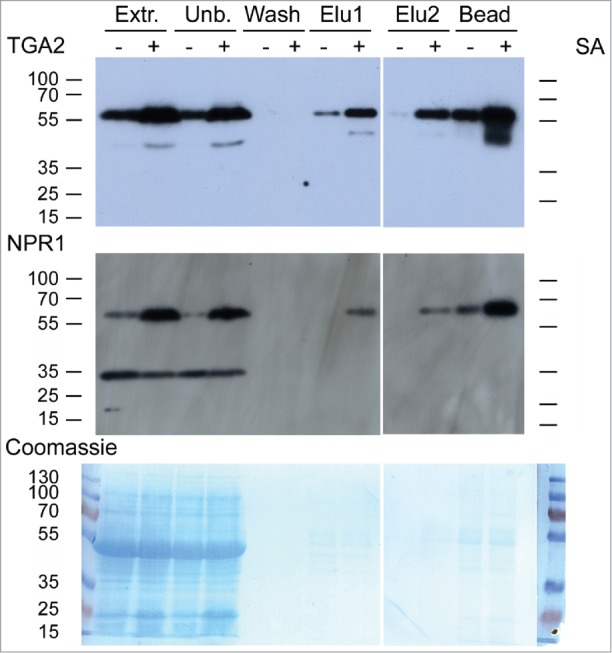
In vivo pull-down of NPR1 with TAP-tagged TGA2 from leaves using a calmodulin (CaM) affinity resin. Affinity purification of TAP-tagged TGA2 was followed by immunoblotting using αTGA2-C antiserum.24 Fractions are shown on the top; extracts (Extr.) from 6-week old plants treated without or with 1 mM salicylic acid (SA) for 30 h, fraction unbound to CaM affinity matrix (Unb.), wash fraction, EGTA elution steps (Elu1 and Elu2), and protein remaining on the CaM affinity matrix (Bead). Immunoblot using αNPR1 antibody36 shows copurification of NPR1 with TGA2. A band of ∼35 kDa cross-reacting with the NPR1 antibody is also visible. Coomassie staining of the blot, which shows approximately equal loading of the lanes containing the extracts. Reduced staining in lanes labeled Elu1, Elu2, and Bead demonstrates partial purification of TGA2 and the associated NPR1.
Figure 4.
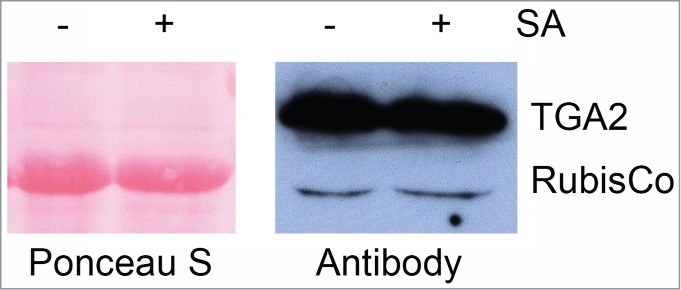
Expression of TAP-tagged TGA2 in transgenic A. thaliana treated with 1 mM salicylic acid (SA) or not treated. In this experiment, samples were taken 26 hours after spraying of 6-week old plants. This immunoblot was stained with Ponceau S prior to antibody detection. The αTGA2-C antiserum24 slightly cross-reacts with the large subunit of ribulose-1,5-bisphosphate carboxylase (RubisCo). Note that the SA treatment does not alter the abundance of recombinant TGA2 in this experiment.
TAP-tag purification of TGA2
TAP-tag purification is a useful tool to study post-translational modification and protein interactions in vivo. We were primarily interested in purifying TAP-tagged TGA2 from transgenic line 17 because the recombinant protein in this line was less prone to degradation (Fig. 2A) and because induction of GST25 by OPDA and PGA1 (Fig. 2B) was significant. However, only the calmodulin-binding properties could be exploited for purification of this version of recombinant TGA2 (Fig. 3). IgG-affinity matrices did not allow purification of TAP-tagged TGA2 from transgenic line 17.
In contrast, TAP-tag purification of TGA2 was successful from transgenic line 12. The state of this recombinant protein differs from that of line 17 because it is more prone to proteolysis (Fig. 2A) but permits TAP-tag purification of TGA2. TAP-tagged TGA2 specifically bound to the IgG affinity matrix (Fig. 5A) in contrast to the majority of the extracted proteins, including the prominent 53 kDa band representing ribulose-1,5-bisphosphate carboxylase (RubisCo) (Fig. 5B). TGA2 was almost quantitatively eluted from the IgG affinity matrix after cleavage of the IgG-binding domain with TEV protease (Fig. 5A). The most prominent band after TEV cleavage was similar to the predicted size of the TGA2 cleavage product being 42 kDa. Additional washing with 0.5 M acetic acid, pH 3.4 released an additional small amount of TGA2. Interestingly, fewer degradation products were apparent after elution under acidic conditions, suggesting that incubation with protease for 90 min resulted in stronger TGA2 degradation than more rapid washes with acetic acid. The TEV-treated TGA2 was quantitatively bound to the calmodulin affinity resin (Fig. 5C). No antibody-reactive bands were visible in the unbound or in the wash fraction. A concentration of 5 mM EGTA was not sufficient to release all of the bound TGA2, as additional bands were eluted after boiling in SDS sample buffer. Few bands were visible after silver staining of the EGTA eluent, but strongly staining bands between 55 and 70 kDa occurred in fractions that tightly bound to the calmodulin affinity matrix (Fig. 5D).
Figure 5.
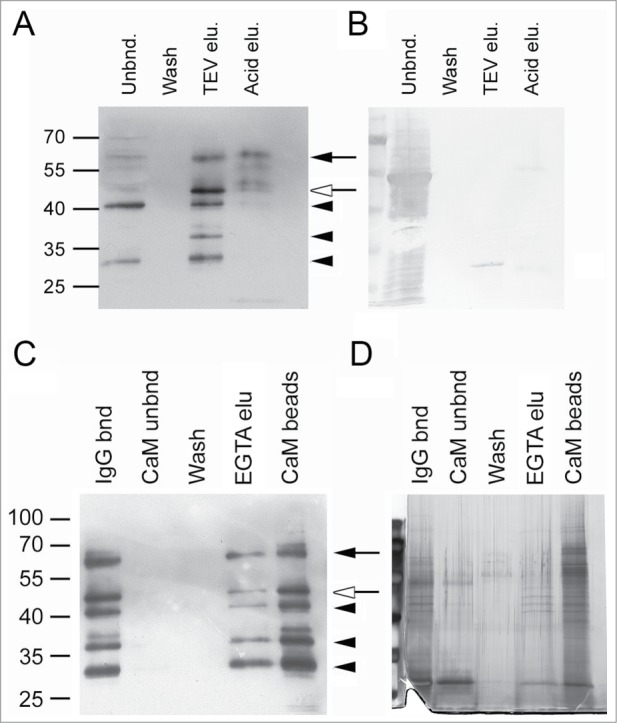
TAP-tag purification of TGA2 from seedlings grown in liquid medium. (A) Immunoblot analysis of TGA2 using the αTGA2-C antiserum. TAP-tagged TGA2 was bound to IgG-sepharose for 90 min at 20°C. The resin was washed with Tris-saline Tween 20. Tobacco etch virus (TEV) protease was used to cleave off the IgG-binding domain. Any remaining TGA2 was eluted with 0.5 M acetic acid, pH 3.4 (see Materials and Methods for details). Molecular weight markers are indicated on the left. The black arrow indicates TAP-tagged TGA2, the white arrow indicates TEV-cleaved tagged TGA2 and black arrowheads indicate putative degradation products. (B) Coomassie staining of the immunoblot shown to the left. Note that the 27 kDa band represents TEV protease. The bands in the lane of the acid elution step likely represent large and small IgG subunits. (C) Immunoblot analysis of TGA2; second purification step using calmodulin (CaM) affinity resin. TGA2 was bound to CaM affinity resin for 90 min at 20°C, washed with CaM binding buffer (see Materials and Methods), and eluted with 5 mM EGTA. Proteins remaining on the column after this elution were released by boiling in SDS sample buffer (CaM beads). Molecular weight markers, arrows and arrowheads are as indicated above. (D) Silver staining of a gel containing fractions collected during CaM purification.
An additional experiment was carried out using rosette leaves of plants grown in soil that were treated or not treated with SA. Proteins were cross-linked prior to purification. Two-step purification of this material resulted in purification of a band similar to the predicted size of TGA2 after TEV cleavage (Fig. 6A). SYPRO Ruby staining of the purified fraction eluted from the calmodulin affinity resin identified 3 bands in the size range between 55 and 70 kDa (Fig. 6B). It is likely that these bands represent proteins that co-purified with TEV-cleaved TGA2 because they were larger than the band recognized by the αTGA2-C antiserum.
Figure 6.
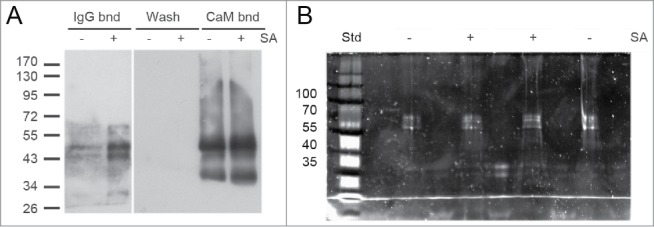
TAP-tag purification of TGA2 from plants grown in soil treated or not treated with salicylic acid (SA). Proteins were cross-linked in situ prior to extraction. (A) Immunoblot analysis of TGA2 using αTGA2-C antiserum. TAP-tagged TGA2 was bound to IgG-sepharose (IgG bnd). TGA2 was cleaved off the resin with Tobacco etch virus (TEV) protease to remove the IgG-binding domain. Proteins were bound to calmodulin (CaM) affinity resin, washed, and finally eluted (CaM bnd). Molecular weight markers are indicated on the left. The largest band is similar to the predicted size of TEV-cleaved tagged TGA2. Putative degradation products are smaller. (B) SYPRO Ruby staining of putative TGA2-interacting proteins. The approximate sizes of the standard (Std) are shown to the left.
TAP-tag purified bands (Fig. 5D) were excised for mass spectrometry after Coomassie staining to identify proteins that interact with TGA2 in vivo. Identification of TGA2 itself validated the method (Table 1). Other interesting proteins identified included a Rad21/Rec8-like family protein (At5g40840), the GTP-binding elongation factor Tu family protein (At1g07930) and cullin4 (AT5G46210). However, except for TGA2, these hits were only represented by single peptide sequences.
Table 1.
Identification of peptides after digestion in gel slices and MS/MS analysis using an LTQ-Orbitrap XL mass spectrometer
| Accession/slice1 | Description | Score2 | Coverage3 | # Proteins4 | # Unique Peptides5 | # Peptides6 | # PSMs7 | # AAs | MW [kDa] | calc. pI | |||
|---|---|---|---|---|---|---|---|---|---|---|---|---|---|
| AT5G40840.3 | Rad21/Rec8-like family protein | 2.60 | 1.62 | 3 | 1 | 1 | 2 | 678 | 76.7 | 5.96 | |||
| A2 | Sequence | # PSMs | # Proteins | # Protein Groups8 | Protein Group Accessions | Modifications9 | XCorr10 | Charge | MH+ [Da] | ΔM [ppm]11 | RT [min] | # Missed Cleavages | |
| 1B | High | lFyETLVLKTK | 2 | 3 | 1 | AT5G40840.3 | N-Term(Acetyl); Y3(Phospho) | 2.60 | 2 | 1476.76885 | −4.17 | 17.71 | 1 |
| AT1G07930.2 | GTP binding Elongation factor Tu family protein | 2.33 | 2.69 | 3 | 1 | 1 | 1 | 372 | 41.3 | 9.23 | |||
| A2 | Sequence | # PSMs | # Proteins | # Protein Groups | Protein Group Accessions | Modifications | XCorr | Charge | MH+ [Da] | ΔM [ppm] | RT [min] | # Missed Cleavages | |
| 1B | Medium | STTTGHLIYK | 1 | 3 | 1 | AT1G07930.2 | 2.33 | 2 | 1120.59929 | −0.38 | 10.31 | 0 | |
| AT5G06950.1 | bZIP transcription factor family protein | 5.02 | 6.97 | 9 | 2 | 2 | 2 | 330 | 36.7 | 8.60 | |||
| A2 | Sequence | # PSMs | # Proteins | # Protein Groups | Protein Group Accessions | Modifications | XCorr | Charge | MH+ [Da] | ΔM [ppm] | RT [min] | # Missed Cleavages | |
| 1C | High | SALNAHAGDSELR | 1 | 1 | 1 | AT5G06950.1 | 2.54 | 2 | 1340.65581 | 0.32 | 11.73 | 0 | |
| High | LTQLEQELQR | 1 | 9 | 1 | AT5G06950.1 | 2.48 | 2 | 1257.67803 | −1.40 | 23.24 | 0 | ||
| AT1G06420.2 | unknown protein | 2.21 | 4.55 | 2 | 1 | 1 | 1 | 198 | 23.2 | 9.88 | |||
| A2 | Sequence | # PSMs | # Proteins | # Protein Groups | Protein Group Accessions | Modifications | XCorr | Charge | MH+ [Da] | ΔM [ppm] | RT [min] | # Missed Cleavages | |
| 2A | Medium | KNPVKENtR | 1 | 2 | 1 | AT1G06420.2 | T8(Phospho) | 2.21 | 2 | 1165.58257 | 8.58 | 13.60 | 2 |
| AT5G46210.1 | cullin4 | 2.20 | 1.64 | 1 | 1 | 1 | 1 | 792 | 91.4 | 8.02 | |||
| A2 | Sequence | # PSMs | # Proteins | # Protein Groups | Protein Group Accessions | Modifications | XCorr | Charge | MH+ [Da] | ΔM [ppm] | RT [min] | # Missed Cleavages | |
| 2A | Medium | tVKGLLsmIEKER | 1 | 1 | 1 | AT5G46210.1 | T1(Phospho); S7(Phospho); M8(Oxidation) | 2.20 | 2 | 1679.77312 | −6.47 | 20.10 | 2 |
| AT1G03055.2 | unknown protein | 2.10 | 5.50 | 2 | 1 | 1 | 2 | 200 | 22.4 | 9.54 | |||
| A2 | Sequence | # PSMs | # Proteins | # Protein Groups | Protein Group Accessions | Modifications | XCorr | Charge | MH+ [Da] | ΔM [ppm] | RT [min] | # Missed Cleavages | |
| 2A | Medium | MNTKLSLsQtK | 2 | 2 | 1 | AT1G03055.2 | S8(Phospho); T10(Phospho) | 2.10 | 2 | 1410.60784 | −1.54 | 22.83 | 1 |
| AT5G40840.3 | Rad21/Rec8-like family protein | 2.08 | 1.62 | 3 | 1 | 1 | 2 | 678 | 76.7 | 5.96 | |||
| A2 | Sequence | # PSMs | # Proteins | # Protein Groups | Protein Group Accessions | Modifications | XCorr | Charge | MH+ [Da] | ΔM [ppm] | RT [min] | # Missed Cleavages | |
| 2A | Medium | lFyETLVLKTK | 2 | 3 | 1 | AT5G40840.3 | N-Term(Acetyl); Y3(Phospho) | 2.08 | 2 | 1476.76653 | −5.74 | 16.88 | 1 |
| AT2G45320.1 | unknown protein | 2.02 | 2.30 | 1 | 1 | 1 | 1 | 392 | 43.5 | 9.67 | |||
| A2 | Sequence | # PSMs | # Proteins | # Protein Groups | Protein Group Accessions | Modifications | XCorr | Charge | MH+ [Da] | ΔM [ppm] | RT [min] | # Missed Cleavages | |
| 2A | Medium | sYITFLEmK | 1 | 1 | 1 | AT2G45320.1 | N-Term(Acetyl); M8(Oxidation) | 2.02 | 2 | 1189.58220 | 1.03 | 22.06 | 0 |
| AT5G59160.1 | type one serine/threonine protein phosphatase 2 | 2.01 | 3.21 | 1 | 1 | 1 | 1 | 312 | 35.5 | 5.36 | |||
| A2 | Sequence | # PSMs | # Proteins | # Protein Groups8 | Protein Group Accessions | Modifications | XCorr | Charge | MH+ [Da] | ΔM [ppm] | RT [min] | # Missed Cleavages | |
| 2A | Medium | qAMLNESEIR | 1 | 1 | 1 | AT5G59160.1 | N-Term(Acetyl) | 2.01 | 2 | 1232.59783 | 3.08 | 9.50 | 0 |
| AT5G66470.1 | RNA binding;GTP binding | 1.96 | 1.64 | 1 | 1 | 1 | 1 | 427 | 48.9 | 7.06 | |||
| A2 | Sequence | # PSMs | # Proteins | # Protein Groups | Protein Group Accessions | Modifications9 | XCorr10 | Charge | MH+ [Da] | ΔM [ppm]11 | RT [min] | # Missed Cleavages | |
| 2A | Medium | KLEWYEK | 1 | 1 | 1 | AT5G66470.1 | 1.96 | 2 | 995.51976 | 0.07 | 12.50 | 1 | |
| AT1G52230.1 | photosystem I subunit H2 | 1.96 | 7.59 | 2 | 1 | 1 | 1 | 145 | 15.3 | 9.91 | |||
| A2 | Sequence | # PSMs | # Proteins | # Protein Groups | Protein Group Accessions | Modifications | XCorr | Charge | MH+ [Da] | ΔM [ppm] | RT [min] | # Missed Cleavages | |
| 2A | Medium | gLGGssLAGAK | 1 | 2 | 1 | AT1G52230.1 | N-Term(Acetyl); S5(Phospho); S6(Phospho) | 1.96 | 2 | 1119.43877 | −8.57 | 10.10 | 0 |
Slice 1B = molecular masses of approx. 50-60 kDa, slice 1C = approx. 30 kDa (both slices represent the EGTA fraction eluted from the calmodulin affinity resin); slice 2A = approx. 70 kDa (represents proteins removed the calmodulin affinity resin by boiling in SDS sample buffer).
Protein score = sum of scores of individual peptides; For SEQUEST results, the score is the sum of all peptide Xcorr values above the specified score threshold. The score threshold is calculated as follows: 0.8 + peptide_charge × peptide_relevance_factor where peptide_relevance_factor is an advanced parameter of the SEQUEST node in the “Protein Scoring Option” category with a default value of 0.4. For each spectrum, only the highest-scoring match is used. For each spectrum and sequence, the Proteome Discoverer application uses only the highest scored peptide. When it performs a search using dynamic modifications, one spectrum might have multiple matches because of permutations of the modification site.
Coverage displays the coverage of the protein, which is the percentage of the protein sequence covered by the identified peptides.
Proteins displays the number of proteins in which this peptide is found.
Unique Peptides displays the number of peptide sequences unique to a protein group.
Peptides displays the number of distinct peptide sequences in the protein group.
PSM displays the total number of identified peptide sequences (PSMs) for the protein, including those redundantly identified.
Protein groups displays the number of protein groups in which this peptide is found.
Modifications displays the static and dynamic modifications identified in the peptide.
XCorr scores the number of fragment ions that are common to 2 different peptides with the same precursor mass and calculates the cross-correlation score for all candidate peptides queried from the database. The #1 hit will always have the highest value of Xcorr, as Xcorr is used to produce the final ranking of the candidate peptides in the search. Usually XCorr values above 2.0 are considered as good correlation. However, XCorr values are usually higher for well-matched, large peptides, and lower for smaller peptides.
ΔM [ppm]: Displays the difference between the theoretical mass of the peptide and the experimental mass of the precursor ion.
Discussion
We expressed a TGA2 construct with a C-terminal TAP-tag driven by the cauliflower mosaic virus (CaMV) 35S promoter in the background of the tga2 tga5 tga6 triple mutant able to partially complement the mutant phenotype. The degree of complementation as judged by the partial induction of the TolB-like gene (data not shown) and GST25 (Fig. 2B) in response to reactive oxylipins is similar to that of overexpressing TGA2 in the triple mutant background without a TAP-tag.25 The TAP-tag therefore does not impair the function of this transcription factor.
Overexpression of TAP-tagged TGA2 resulted in proteolysis, particularly in A. thaliana seedlings that were grown on liquid medium (Fig. 2A). Proteolysis of TAP-tagged TGA2 varied among the lines overexpressing this construct. Interestingly, only the line that overexpressed a proteolytically unstable TAP-tagged TGA2 was amenable to a 2-step purification using IgG and calmodulin affinity matrices. This suggests that the less stable recombinant protein was more accessible to the IgG affinity matrix. The transgenic A. thaliana line that can be used for TAP presents a new tool for investigating the function of type II TGA factors under different physiological and treatment conditions.
TAP can be used to demonstrate known interactions of TGA2 with proteins like NPR1 (Fig. 3). In addition, the TAP-tagged TGA2 can be used to identify interactions with proteins not previously uncovered. In a first effort to isolate such interactors, we came across a GTP-binding elongation factor Tu family protein, which has been annotated as calmodulin-binding. Purification of this protein may therefore represent an artifact of the particular purification method employed. The tantalizing identification of a Rad21/Rec8-like family protein and cullin4 is weakened by the fact that both proteins as well as the remaining ones were represented by only single peptides (Table 1). Additional experiments will therefore be needed to identify true novel TGA2 interactors.
Materials and Methods
Plant material, plant transformation, and growth conditions
Seeds of ecotype Col-0 originated from the Arabidopsis Biological Resource Center (Ohio State University, Columbus, Ohio, USA). The tga6, tga25, and tga256 mutants were those originally described.16
A C-terminal TAP-tag under the control of the 35S promoter was cloned without the stop codon into the vector pFGC5941.26 The plant expression vector was transformed into Agrobacterium tumefaciens strain GV3101. Arabidopsis thaliana was transformed using the floral dip method for A. tumefaciens-mediated gene transfer.27 Transformants were selected with 50 mg l−1 BASTA (Bayer CropScience, Monheim, Germany).
A. thaliana seedlings were grown in liquid MS medium as previously described.18 Otherwise, plants were grown in soil maintained with a 9 h light/15 h dark cycle at 22°C under fluorescent light (100 μmol m−2 s−1). Plants were harvested after 6 to 7 weeks of growth.
Chemical treatments
Seedlings grown in liquid MS medium were treated with OPDA synthesized by enzymatic conversion of linolenic acid using linseed acetone powder28 or with prostaglandin A1 (PGA1) (Cayman Chemical). Plants grown in soil were sprayed with 1 mM salicylic acid (Sigma), which was diluted from a 100 mM stock solution adjusted to pH 6, or water until run-off and harvested 26 or 30 h later.
Quantitative RT-PCR analysis
Total RNA was extracted and processed as previously described.25 DNA contamination was removed and total RNA was reverse transcribed. Real-time PCR was performed using SYBR Green. Primers, experimental equipment and cycle conditions were published previously.25 Purified RT-PCR products were used for calibration using the Relative Standard Curve Method (Applied Biosystems). Three biological replicates were used for each data point. The Relative Expression Software Tool V2.0.13 (Qiagen) was used to determine statistical significance between pairwise comparisons of quantitative PCR data.
Protein purification
TAP-tag purification of TGA2 from seedlings grown in liquid followed a published protocol29 with minor modifications. Frozen plant material (1.6 g FW) was ground in an equal volume of 100 mM Tris, pH 8, 5 mM EDTA, 150 mM NaCl, 10 mM DTT, 0.5% (v/v) plant protease inhibitor cocktail (Sigma). Upon centrifugation at 21,000 g for 10 min at 4°C, the supernatant was incubated with 150 μL of equilibrated IgG Sepharose (GE Healthcare) for 90 min at 20°C using overhead rotation. The resin was washed 5 times with 0.5 mL of 50 mM Tris, pH 8, 150 mM NaCl, 5 mM EDTA, 2 mM DTT and twice with 5 mM NH4-acetate, pH 5. The resin was equilibrated 3 times with 0.5 mL of 50 mM Tris, pH 8, 150 mM NaCl, 0.5 mM EDTA, 1 mM DTT. Bound TGA was cleaved off the resin by incubation with 50U TEV protease (Life Technologies) for 75 min at 20°C. Any TGA remaining bound to the matrix was eluted with 0.5 mL 0.5 M acetic acid, pH 3.4. The Ca2+ concentration of the TEV protease eluent was adjusted to 5 mM and combined with CaM binding buffer (1.5 mL of 50 mM Tris, pH 8, 150 mM NaCl, 10 mM β-mercaptoethanol, 1 mM Mg-acetate, 1 mM imidazole, 5 mM CaCl2). After addition of 150 μL equilibrated calmodulin affinity resin (Stratagene), the sample was incubated for 90 min at 20°C with overhead rotation. The resin was washed 6 times with 0.5 mL of CaM binding buffer. TGA2 was eluted 5 times in a total volume of 475 μL of 50 mM Tris, pH 8, 150 mM NaCl, 10 mM β-mercaptoethanol, 1 mM Mg-acetate, 1 mM imidazole, 5 mM EGTA. In addition, the resin was boiled in 150 μL sample buffer to release TGA2 remaining bound to the resin.30 A volume of 20 μL of the different fractions was used for SDS-PAGE.
For the NPR1 pull-down experiment, leaf material from SA-treated (1.2 mg FW) and untreated leaves (1.0 mg FW) were extracted in CaM binding buffer containing 0.5% (v/v) plant protease inhibitor cocktail and centrifuged as detailed above. Purification using calmodulin affinity resin was the same as explained above.
Rosette leaves of plants grown in soil were subjected to cross-linking with formaldehyde31 prior to extraction. Extraction and protein purification followed a published method with the following modifications.32 Plant material (50 g) was extracted in an equal volume of extraction buffer (50 mM Tris, pH 8; 2.5 mM EDTA; 150 mM NaCl; 10 mM β-mercaptoethanol; 0.1% IGEPAL; 20 mM NaF; 2 mM benzamidine; 1 mM PMSF; 10 μM leupeptin; 10 μM dichloroisocoumarin; plant protease inhibitor cocktail, diluted 1:200). The extract was filtered and centrifuged; the supernatant was mixed with 1 mL of equilibrated IgG Sepharose beads and incubated for 90 min at 20°C using overhead rotation. Beads were collected by centrifugation, followed by 4 washes, each containing 5 mL of 50 mM Tris, pH 8; 150 mM NaCl; 2.5 mM EDTA; 2 mM DTT; 0.1% IGEPAL. Samples were equilibrated using 3 washes, each in 2 mL TEV buffer.32 Beads were incubated with TEV protease as described32 but for a period of 90 min at 20°C. The cleaved eluate was adjusted to 5 mM CaCl2 using calmodulin binding buffer (CBB).32 After addition of 200 μL equilibrated calmodulin affinity resin, samples were incubated for 90 min at 20°C by overhead rotation. Samples were washed 6 times with 2 mL CBB. Elution occurred in CBB containing 5 mM EGTA.32 Proteins were precipitated with trichloroacetic acid and dissolved in SDS sample buffer;30 protein remaining on beads were released with SDS sample buffer.
Immunoblotting, protein detection and tryptic digestion
Proteins were separated using 10% acrylamide gels for SDS-PAGE30 and electroblotted to PVDF membrane. Optional visualization of transferred proteins involved Ponceau S (Sigma) staining. 3% nonfat dry milk was used to block the membrane. Primary antibody was used at a dilution of 1:10,000. The αTGA2-C antiserum was as described.24 NPR1 antibody was obtained from Dr. Xinian Dong (Duke University, Durham, NC). An HRP-conjugated secondary antibody was used at a dilution of 1:40,000. A chemiluminescent HRP substrate (Millipore) was used for detection. After detection with the NPR1 antibody, the membrane was stripped with 0.2 M NaOH and reprobed for detection with αTGA2-C antiserum in the pull-down experiment. The membrane was stained with Coomassie to visualize total protein.
Silver staining after SDS-PAGE followed published procedures.33 Gels used for tryptic digestions were stained with Coomassie. Sypro Ruby (Sigma) staining provides an alternative visualization method that is compatible with mass spectrometry. Visualized bands were cut into small pieces, dehydrated with acetonitrile and washed with NH4HCO3 according to published procedures34 prior to incubation with sequencing grade modified trypsin (Promega). Peptides were extracted from the digested gel slices using a formic acid/acetonitrile mixture.34
Mass spectrometric analysis of peptides
Peptides were separated in a monolithic reversed phase C18 capillary column, 15 cm, ID 0.1 mm (Merck) using gradient from 95% A (0.1% formic acid), 5% B (0.1% formic acid, 90% acetonitrile) to 60% A, 40% B within 40 or 60 min. The flow rate was set to 500 nL/min. Mass spectrometry (MS) analysis was done with an LTQ-Orbitrap XL mass spectrometer (Thermo). The following settings were used for MS. Spray voltage 1.9 kV, capillary voltage of 48 V and capillary temperature 180°C. MS full scan range was 300–1800 m/z with a resolution of 30 000 and 371.101230 m/z was used as the lock mass. The top 10 intense peptide masses were subjected to MS/MS analysis. CID collision energy was set to 35.0 with an activation Q of 0.250 and an activation time of 30 000 ms. Dynamic exclusion duration was 60 s and ions having charge state +1 or unassigned charge states were rejected.
Proteome discoverer 1.3 (Thermo Scientific) with the SEQUEST algorithm was used for peptide identification. Search was done against TAIR10 database, to which the sequences of porcine modified trypsin and common contaminants were added, with following settings: the enzyme was set to trypsin and maximum 2 missed cleavage sites were allowed, the precursor mass tolerance was set to 10 ppm, the MS/MS fragment mass tolerance to 0.8 Da, and false discovery rate (FDR) was set to 0.01 (strict) and 0.05 (relaxed). The following variable modifications were used: oxidation of methionine (+15.995 Da), phosphorylation (+79.966 Da) of Ser, Thr and Tyr and N-Terminal acetylation (+42.011 Da).
Disclosure of Potential Conflicts of Interest
No potential conflicts of interest were disclosed.
Acknowledgments
We are grateful to Prof. Christiane Gatz and Dr. Corinna Thurow (Georg-August-Universität, Göttingen, Germany), who provided the 35S::TGA2 TAP-tag construct and the αTGA2-C antibody. Prof. Gatz also furnished a critical review of the manuscript. We are also indebted to Prof. Xinnian Dong (Duke University, Durham, NC, USA) for the generous gift of the NPR1 antibody. We thank Beate Krischke for transforming A. thaliana and generating transgenic lines. We are also grateful to the contribution of Evelyn Schmid, who analyzed the expression of the TolB-like gene.
Funding
This work was financially supported by a grant of the Deutsche Forschungsgemeinschaft (GK1342).
References
- 1. Ngounou Wetie AG, Sokolowska I, Woods AG, Roy U, Loo JA, Darie CC. Investigation of stable and transient protein-protein interactions: past, present, and future. Proteomics 2013; 13:538-57; PMID:23193082; http://dx.doi.org/ 10.1002/pmic.201200328 [DOI] [PMC free article] [PubMed] [Google Scholar]
- 2. Rigaut G, Shevchenko A, Rutz B, Wilm M, Mann M, Seraphin B. A generic protein purification method for protein complex characterization and proteome exploration. Nat Biotechnol 1999; 17:1030-2; PMID:10504710; http://dx.doi.org/ 10.1038/13732 [DOI] [PubMed] [Google Scholar]
- 3. Wang C, Shang JX, Chen QX, Oses-Prieto JA, Bai MY, Yang Y, Yuan M, Zhang YL, Mu CC, Deng Z, et al. Identification of BZR1-interacting proteins as potential components of the brassinosteroid signaling pathway in Arabidopsis through tandem affinity purification. Mol Cell Proteomics 2013; 12:3653-65; PMID:24019147; http://dx.doi.org/ 10.1074/mcp.M113.029256 [DOI] [PMC free article] [PubMed] [Google Scholar]
- 4. Antoni R, Gonzalez-Guzman M, Rodriguez L, Peirats-Llobet M, Pizzio GA, Fernandez MA, De Winne N, De Jaeger G, Dietrich D, Bennett MJ, et al. PYRABACTIN RESISTANCE1-LIKE8 plays an important role for the regulation of abscisic acid signaling in root. Plant Physiol 2013; 161:931-41; PMID:23370718; http://dx.doi.org/ 10.1104/pp.112.208678 [DOI] [PMC free article] [PubMed] [Google Scholar]
- 5. Jakoby M, Weisshaar B, Droge-Laser W, Vicente-Carbajosa J, Tiedemann J, Kroj T, Parcy F. bZIP transcription factors in Arabidopsis. Trends Plant Sci 2002; 7:106-11; PMID:11906833; http://dx.doi.org/10.1016/S1360-1385(01)02223-3 [DOI] [PubMed] [Google Scholar]
- 6. Zander M, Chen S, Imkampe J, Thurow C, Gatz C. Repression of the Arabidopsis thaliana jasmonic acid/ethylene-induced defense pathway by TGA-interacting glutaredoxins depends on their C-terminal ALWL motif. Mol Plant 2012; PMID:22207719; http://dx.doi.org/10.1093/mp/ssr113 [DOI] [PubMed] [Google Scholar]
- 7. Murmu J, Bush MJ, Delong C, Li S, Xu M, Khan M, Malcolmson C, Fobert PR, Zachgo S, Hepworth SR. Arabidopsis basic leucine-zipper transcription factors TGA9 and TGA10 interact with floral glutaredoxins ROXY1 and ROXY2 and are redundantly required for anther development. Plant Physiol 2010; 154:1492-504; PMID:20805327; http://dx.doi.org/ 10.1104/pp.110.159111 [DOI] [PMC free article] [PubMed] [Google Scholar]
- 8. Niggeweg R, Thurow C, Weigel R, Pfitzner U, Gatz C. Tobacco TGA factors differ with respect to interactoion with NPR1 activation potential and DNA-binding properties. Plant Mol Biol 2000; 42:775-88; PMID:10809449; http://dx.doi.org/ 10.1023/A:1006319113205 [DOI] [PubMed] [Google Scholar]
- 9. Zhang Y, Fan W, Kinkema M, Li X, Dong X. Interaction of NPR1 with basic leucine zipper protein transcription factors that bind sequence required for salicylic acid induction of the PR-1 gene. Proc Natl Acad Sci USA 1999; 96:6523-8; PMID:10339621; http://dx.doi.org/ 10.1073/pnas.96.11.6523 [DOI] [PMC free article] [PubMed] [Google Scholar]
- 10. Zhou J, Trifa Y, Silva H, Pontier D, Lam E, Shah J, Klessig DF. NPR1 differentially interacts with members of the TGA/OBF family of transcription factors that bind an element of the PR-1 gene reguired for induction by salicylic acid. Mol Plant-Microbe Interact 2000; 13:191-202; PMID:10659709; http://dx.doi.org/ 10.1094/MPMI.2000.13.2.191 [DOI] [PubMed] [Google Scholar]
- 11. Kesarwani M, Yoo J, Dong X. Genetic interactions of TGA transcription factors in the regulation of pathogenesis-related genes and disease resistance in Arabidopsis. Plant Physiol 2007; 144:336-46; PMID:17369431; http://dx.doi.org/ 10.1104/pp.106.095299 [DOI] [PMC free article] [PubMed] [Google Scholar]
- 12. Fode B, Siemsen T, Thurow C, Weigel R, Gatz C. The Arabidopsis GRAS protein SCL14 interacts with class II TGA transcription factors and is essential for the activation of stress-inducible promoters. Plant Cell 2008; 20:3122-35; PMID:18984675; http://dx.doi.org/ 10.1105/tpc.108.058974 [DOI] [PMC free article] [PubMed] [Google Scholar]
- 13. Ndamukong I, Abdallat AA, Thurow C, Fode B, Zander M, Weigel R, Gatz C. SA-inducible Arabidopsis glutaredoxin interacts with TGA factors and suppresses JA-responsive PDF1.2 transcription. Plant J 2007; 50:128-39; PMID:17397508; http://dx.doi.org/ 10.1111/j.1365-313X.2007.03039.x [DOI] [PubMed] [Google Scholar]
- 14. Fan W, Dong X. In vivo interaction between NPR1 and transcription factor TGA2 leads to salicylic acid-mediated gene activation in Arabidopsis. Plant Cell 2002; 14:1377-89; PMID:12084833; http://dx.doi.org/ 10.1105/tpc.001628 [DOI] [PMC free article] [PubMed] [Google Scholar]
- 15. Tada Y, Spoel SH, Pajerowska-Mukhtar K, Mou Z, Song J, Wang C, Zuo J, Dong X. Plant immunity requires conformational changes of NPR1 via S-nitrosylation and thioredoxins. Science 2008; 321:952-6; PMID:18635760; http://dx.doi.org/ 10.1126/science.1156970 [DOI] [PMC free article] [PubMed] [Google Scholar]
- 16. Zhang Y, Tessaro MJ, Lassner M, Li X. Knockout analysis of Arabidopsis transcription factors TGA2, TGA5, and TGA6 reveals their redundant and essential roles in systemic acquired resistance. Plant Cell 2003; 15:2647-53; PMID:14576289; http://dx.doi.org/ 10.1105/tpc.014894 [DOI] [PMC free article] [PubMed] [Google Scholar]
- 17. Zander M, La Camera S, Lamotte O, Metraux JP, Gatz C. Arabidopsis thaliana class-II TGA transcription factors are essential activators of jasmonic acid/ethylene-induced defense responses. Plant J 2010; 61:200-10; PMID:19832945; http://dx.doi.org/ 10.1111/j.1365-313X.2009.04044.x [DOI] [PubMed] [Google Scholar]
- 18. Mueller S, Hilbert B, Dueckershoff K, Roitsch T, Krischke M, Mueller MJ, Berger S. General detoxification and stress responses are mediated by oxidized lipids through TGA transcription factors in Arabidopsis. Plant Cell 2008; 20:768-85; PMID:18334669; http://dx.doi.org/ 10.1105/tpc.107.054809 [DOI] [PMC free article] [PubMed] [Google Scholar]
- 19. Mueller MJ. Archetype signals in plants: the phytoprostanes. Curr Opin Plant Biol 2004; 7:441-8; PMID:15231268; http://dx.doi.org/ 10.1016/j.pbi.2004.04.001 [DOI] [PubMed] [Google Scholar]
- 20. Farmer EE, Davoine C. Reactive electrophile species. Curr Opin Plant Biol 2007; 10:380-6; PMID:17646124; http://dx.doi.org/ 10.1016/j.pbi.2007.04.019 [DOI] [PubMed] [Google Scholar]
- 21. Song WC, Funk CD, Brash AR. Molecular cloning of an allene oxide synthase: a cytochrome P450 specialized for the metabolism of fatty acid hydroperoxides. Proc Natl Acad Sci USA 1993; 90:8519-23; PMID:8378325; http://dx.doi.org/ 10.1073/pnas.90.18.8519 [DOI] [PMC free article] [PubMed] [Google Scholar]
- 22. Ziegler J, Stenzel I, Hause B, Maucher H, Hamberg M, Grimm R, Ganal M, Wasternack C. Molecular cloning of allene oxide cyclase. The enzyme establishing the stereochemistry of octadecanoids and jasmonates. J Biol Chem 2000; 275:19132-8; PMID:10764787; http://dx.doi.org/ 10.1074/jbc.M002133200 [DOI] [PubMed] [Google Scholar]
- 23. Dueckershoff K, Mueller S, Mueller MJ, Reinders J. Impact of cyclopentenone-oxylipins on the proteome of Arabidopsis thaliana. Biochim Biophys Acta 2008; 1784:1975-85; PMID:18848650; http://dx.doi.org/ 10.1016/j.bbapap.2008.09.003 [DOI] [PubMed] [Google Scholar]
- 24. Thurow C, Schiermeyer A, Krawczyk S, Butterbrodt T, Nickolov K, Gatz C. Tobacco bZIP transcription factor TGA2.2 and related factor TGA2.1 have distinct roles in plant defense responses and plant development. Plant J 2005; 44:100-13; PMID:16167899; http://dx.doi.org/ 10.1111/j.1365-313X.2005.02513.x [DOI] [PubMed] [Google Scholar]
- 25. Stotz HU, Mueller S, Zoeller M, Mueller MJ, Berger S. TGA transcription factors and jasmonate-independent COI1 signalling regulate specific plant responses to reactive oxylipins. J Exp Bot 2013; 64:963-75; PMID:23349138; http://dx.doi.org/ 10.1093/jxb/ers389 [DOI] [PMC free article] [PubMed] [Google Scholar]
- 26. Rana U, Kothinti R, Meeusen J, Tabatabai NM, Krezoski S, Petering DH. Zinc binding ligands and cellular zinc trafficking: apo-metallothionein, glutathione, TPEN, proteomic zinc, and Zn-Sp1. J Inorg Biochem 2008; 102:489-99; PMID:18171589; http://dx.doi.org/ 10.1016/j.jinorgbio.2007.10.030 [DOI] [PMC free article] [PubMed] [Google Scholar]
- 27. Clough SJ, Bent AF. Floral dip: a simplified method for Agrobacterium-mediated transformation of Arabidopsis thaliana. Plant J 1998; 16:735-43; PMID:10069079; http://dx.doi.org/ 10.1046/j.1365-313x.1998.00343.x [DOI] [PubMed] [Google Scholar]
- 28. Parchmann S, Gundlach H, Mueller MJ. Induction of 12-oxo-phytodienoic acid in wounded plants and elicited plant cell cultures. Plant Physiol 1997; 115:1057-64; PMID:9390438; http://dx.doi.org/ 10.1104/pp.115.3.1057 [DOI] [PMC free article] [PubMed] [Google Scholar]
- 29. Witte CP, Noel LD, Gielbert J, Parker JE, Romeis T. Rapid one-step protein purification from plant material using the eight-amino acid StrepII epitope. Plant Mol Biol 2004; 55:135-47; PMID:15604670; http://dx.doi.org/ 10.1007/s11103-004-0501-y [DOI] [PubMed] [Google Scholar]
- 30. Laemmli UK. Cleavage of structural proteins during the assembly of the head of bacteriophage T4. Nature 1970; 227:680-5; PMID:5432063; http://dx.doi.org/ 10.1038/227680a0 [DOI] [PubMed] [Google Scholar]
- 31. Rohila JS, Chen M, Cerny R, Fromm ME. Improved tandem affinity purification tag and methods for isolation of protein heterocomplexes from plants. Plant J 2004; 38:172-81; PMID:15053770; http://dx.doi.org/ 10.1111/j.1365-313X.2004.02031.x [DOI] [PubMed] [Google Scholar]
- 32. Rohila JS, Chen M, Chen S, Chen J, Cerny R, Dardick C, Canlas P, Xu X, Gribskov M, Kanrar S, et al. Protein-protein interactions of tandem affinity purification-tagged protein kinases in rice. Plant J 2006; 46:1-13; PMID:16553892; http://dx.doi.org/ 10.1111/j.1365-313X.2006.02671.x [DOI] [PubMed] [Google Scholar]
- 33. Schagger H. Tricine-SDS-PAGE. Nature Protocols 2006; 1:16-22; PMID:17406207; http://dx.doi.org/ 10.1038/nprot.2006.4 [DOI] [PubMed] [Google Scholar]
- 34. Shevchenko A, Wilm M, Vorm O, Mann M. Mass spectrometric sequencing of proteins silver-stained polyacrylamide gels. Anal Chem 1996; 68:850-8; PMID:8779443; http://dx.doi.org/ 10.1021/ac950914h [DOI] [PubMed] [Google Scholar]
- 35. Pfaffl MW, Horgan GW, Dempfle L. Relative expression software tool (REST) for group-wise comparison and statistical analysis of relative expression results in real-time PCR. Nucl Acid Res 2002; 30:e36; http://dx.doi.org/ 10.1093/nar/30.9.e36 [DOI] [PMC free article] [PubMed] [Google Scholar]
- 36. Mou Z, Fan W, Dong X. Inducers of plant systemic acquired resistance regulate NPR1 function through redox changes. Cell 2003; 113:935-44; PMID:12837250; http://dx.doi.org/ 10.1016/S0092-8674(03)00429-X [DOI] [PubMed] [Google Scholar]