Abstract
AIM: To study the expression of peroxisome proliferator activated receptor-γ (PPARγ) in the liver of rats with fatty liver disease (FLD) and to explore the role of PPARγ in the pathogenesis of FLD to provide the basis for using PPARγ ligand to treat patients with FLD.
METHODS: Forty Wistar rats were divided into 4 groups of ten rats each randomly: normal group (group A), alcohol group (group B), fat-rich diet group (group C), alcohol and fat-rich diet group (group D). The rats were sacrificed at the end of the 16th week from the feeding day. Alanine aminotransferase (ALT), tumor necrosis factor-alfa (TNFα) in serum and malondialdehyde (MDA) in liver homogenate were determined; livers were collected for observing pathologic changes by HE, Sudan IV, Masson stain under microscope. The morphologic results were analyzed by picture quantitative analysis technique. The changes of ultrastructure were also examined under electron microscope. The expression of PPARγ in liver was detected by immunoh-istochemistry and RT-PCR. The correlations between the expression of PPARγ and biochemical indexes, and liver histology were analyzed.
RESULTS: The steatosis, inflammation, necrosis and fibrosis were present in livers of different experimental groups, especially in livers of alcohol and fat-rich diet group. The content of immunodetectable PPARγ was decreased remarkably in the livers of model rats (group B-D); the level in alcohol and fat-rich diet group (3.43 ± 1.48) was significantly lower than that in normal group (18.34 ± 3.73), alcohol group (8.82 ± 2.52) and fat-rich diet group (11.73 ± 2.51) (all P < 0.01). The level of PPARγ mRNA was also lower in the livers of model rats (group B-D) than in livers of controls. The expression of PPARγ in rat liver correlated negatively with the degree of its inflammation, necrosis and fibrosis, as well as the level of serum TNFα and the content of MDA in liver homogenates, but not with steatosis or serum ALT.
CONCLUSION: Decreased expression of PPARγ may play an important role in the development of hepatocellular inflammation, necrosis and fibrosis of rats with FLD. Thus, activating PPARγ by its ligand can be anticipated to provide a therapy target for FLD.
INTRODUCTION
Fatty liver disease (FLD) includes alcoholic liver disease (ALD) caused by alcohol and non-alcoholic fatty liver disease (NAFLD) due to obesity, hypertriglyceridemia and other factors. The pathogenesis is not clear now. Some scholars put forward the tale of two or multiple “hits”[1]. The first hit is steatosis by ethanol or insulin resistance which offers substrates for lipid peroxidation. The second hit is alcoholic hepatitis or nonalcoholic steatohepatitis (NASH) caused by oxidative stress and lipid superoxidation. The release of the inflammation mediator, inflammation and necrosis can be found in hepatocytes[2-6]. Liver fibrosis or cirrhosis is the third hit because the synthesis of extracellular matrix exceeds the decomposition of it or inflammation is continuous. Why excess hepatocellular fat can induce inflammation or even fibrosis in the liver? The pathogenesis is not clarified up now. Peroxisome proliferator-activated receptor-gamma (PPARγ), is one member of the nuclear hormone receptor superfamily that can be activated by various ligands. Recent studies showed that this transcription factor associated not only with adipocyte differentiation, insulin resistance, sugar and lipid metabolism[7-10], but also with the regulation of inflammation, hepatocyte proliferation and the apoptosis in human liver cancer cells[11-17]. The role of PPARγ in FLD has not been well addressed and some studies even showed contrary results. The present study was designed to characterize PPARγ activity in liver of rats with FLD so to explore whether PPARγ ligand could be used as a potential therapeutic agent for FLD.
MATERIALS AND METHODS
Rat model of fatty liver disease
Forty female Wistar rats (from the Animal Center of Hebei Medical University) were divided into 4 groups of ten rats each randomly. Rats in normal group (group A) received standard diet and intragastric saline (1.5 mL/100 g body mass) twice daily. Rats in alcohol group (group B) were intragastrically fed twice a day initially with 400 mL/L ethanol (1.5 mL/100 g body weight) for 4 wk, with 500 mL/L ethanol for 4 wk and then with 60% ethanol for 8 wk on the basis of standard diet. Rats in fat-rich diet group (group C) were fed with high fat diet (standard diet with 10% lard and 2% cholesterin) and given intragastrically with saline twice a day. Rats in alcohol and fat-rich diet group (group D) had the same high fat diet as rats in group C and took the same ethanol as rats in group B.
Preparation of samples
Serum from rats fasted for 12 h was isolated and stored at -70 °C for alanine aminotransferase (ALT) and tumor necrosis factor alfa (TNFα) determination. Liver was homogenized in 10 volumes of 0.01 mol/L sucrose containing 10 mmol/L Tris -CI-, pH 7.4, and 0.1 mmol/L ethylenediaminotetraacetic acid and centrifuged at 3 000 r/mim for 10 min at 4 °C and the supernatant was stored at -70 °C for MDA assay. A small sample of liver was stored in liquid nitrogen for isolation of total RNA. The others were fixed in 40 g/L fomaldehyde for light microscopy or in 40 g/L paraformaldehyde for immunohistochemistry and in 40 g/L glutaraldehyde for electron microscopy.
Biochemical indexes
Serum ALT, TNFα were measured using an auto-biochemical analyzer (Olympus AU 2700) and radio-immuno- assay (Beijing Furui) respectively. MDA in liver homogenates was detected using TBA kit (Nanjing Jiancheng).
Liver histology
Livers were fixed in 40 g/L buffered formaldehyde, embedded in paraffin, sectioned, and stained with hematoxylin-eosin for routine examination and with Sudan IV for steatosis or with Masson for fibrosis. The steatosis and collagen were quantified as the percentage of positive area by multifunctional pathological image analyzer (Beijing Aerospace University). The activity of necro- inflammation was scored between 1 to 4 blindly by an independent pathologist. The ultrastructure of the livers was observed by HITACHI H7500 transmission electron microscope (TEM) after the samples underwent 40 g/L glutaraldehyde-osmic acid fixation, epoxy resin embedding and ultrathin section.
Immunohistochemistry
In brief, paraffin-embedded tissue specimens and controls were sectioned at a thickness of 4 μm, deparaffinized, and rehydrated. The slides were incubated with 30 mL/L hydrogen peroxide in methanol for 10 min to block endogeneous peroxidase activity and then washed twice in phosphate -buffered saline (PBS) for 5 min. Antigen in sections was retrieved by microwave. Sections were then blocked with 10% goat serum and incubated (12 h at 4 °C) with the primary antibody (mouse anti-rat monoclonal antibody of PPARγ, E-8, 1:100, Santa Cruz). After being washed twice for 15 min in PBS, sections were incubated (30 min at 37 °C) with the secondary antibody (goat anti -mouse IgG marked by biotin), with streptoavidin marked by horseradish peroxidase, and then with DAB (Beijing Zhongshan). Then, 0.01 mol/L PBS was substituted for primary antibody as the negative control. The positive cells presented brownish yellow. Quantitative analysis was done by a multifunctional pathological image analyzer. Ten high power fields were examined randomly per sample.
Reverse transcriptase-polymerase chain reaction
Total RNA was isolated from liver using a modification of the single -step guanidinium-phenol-chloroform method. cDNA was obtained by reverse transcription (Promega kit) and then subjected to PCR amplification with GAPDH as standard reference (452 bp). A 403 bp PPARγ gene fragment was amplified with the following primers: up 5’-TATCATAAATAAGCTT CAATCGGATG GTTC-3’ and down 5’-ACCACAGTCCATG CCATCAC-3’. The primers were designed according to the published sequences[18] and synthesized by Shanghai Biology Engineering Corporation. Thirty-two cycles of amplification were performed at 94 °C for 5 min, then at 94 °C for 30 s, at 57 °C for 45 s, and at 72 °C for 1 min, with a final extension at 72 °C for 5 min. The PCR reaction mixture was electrophoresed in 5% SDS-polyacrylamide gel, and observed by EB staining under UV light. The optical density of EB-stained DNA bands was analyzed by BIO-PROFIL picture analysis system and the ratio of PPARγ to GAPDH was calculated.
Statistical analysis
SAS8.0 package was used to process all data. Results were expressed as mean±SD. Student’s t-test was used for the comparison between two groups. Group means were compared by ANOVA followed by the Student-Newman-Keuls test if the former was significant. Differences were considered significant when P < 0.05. Linear regression analysis was used for relativity analysis.
RESULTS
Biochemistry
The biochemical features are outlined in Table 1. Serum ALT, TNFα and MDA in liver homogenates were elevated significantly, particularly in group D.
Table 1.
Biochemical features of rats with fatty liver disease
| Group | n1 | ALT (U/L) | TNFα (μg/L) | MDA (μmol/g) |
| A | 1 0 | 34 ± 9.02 | 1.36 ± 0.35 | 5.71 ± 0.25 |
| B | 9 | 119 ± 17.15a | 3.39 ± 0.42a | 7.26 ± 0.32a |
| C | 10 | 103 ± 17.24a | 3.02 ± 0.37a | 6.72 ± 0.31a |
| D | 9 | 125 ± 16.51a | 5.01 ± 0.52abd | 9.12 ± 0.42abd |
1One rat died in groups B, D respectively in the process of experiment..
P < 0.05 vs the normal control;
P < 0.01 vs the alcohol group;
P < 0.01 vs the fat-rich diet group.
Liver histology
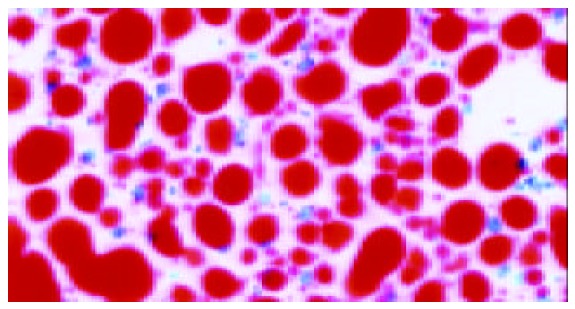
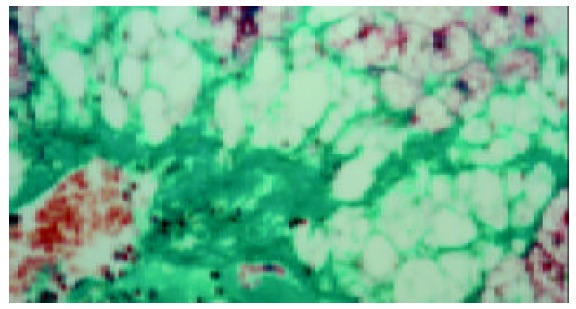
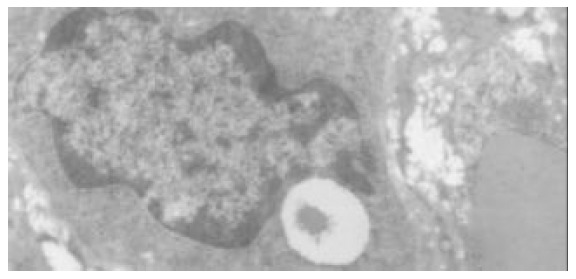
The quantitative evaluation of the liver histology of rats in each group is shown in Table 2. The livers of model rats (group B-D) were engorged with microvesicular and macrovesicular fat, particularly in alcohol and high-fat group (group D) (Figure 1). The hepatocytes of rats in alcohol group presented inflammation, and centrolobular (zone 3) cloudy swelling, ballooning degeneration, spotty necrosis with either pericellular fibrosis or Mallory body. The hepatic sinusoids became narrowed significantly. The infiltration of inflammatory cells, especially neutrophilic granulocytes could be seen in the portal areas, and there was fibrosis around the hepatic sinusoids. Focal necrosis or piecemeal necrosis (PN) even bridge necrosis (BN) in alcohol and fat-rich diet group could be found. Around these areas there were a large number of inflammatory cells. Perisinusoid fibrosis and central vein fibrosis could be seen (Figure 2) and the vein wall became thick even occluded. The portal area was enlarged, the fibrous tissue proliferated and extended to interlobular area. Under TEM, the nuclear membrane was tortuous, the nuclear chromatin agglutinated into blocks in hepatocytes of the model rats (groups B-D). The cytoplasm was loose and had more or less fat. The mitochondria swelled and proliferated and sometimes huge mitochondria could be seen. Some of the sinusoids were capillarized. Activated stellate cells and perisinusoid fibrosis could be observed distinctly (Figure 3).
Table 2.
Quantitative evaluation of liver histology of rats (%)
| Groups | n | Steatosis | Inflammation and necrosis | Collagen |
| A | 10 | 1.34 ± 0.33 | 0.67 ± 0.66 | 2.03 ± 0.87 |
| B | 9 | 12.79 ± 2.73a | 4.35 ± 0.56a | 11.85 ± 3.89a |
| C | 10 | 35.82 ± 8.52ab | 3.05 ± 0.72a | 7.90 ± 2.79ab |
| D | 9 | 37.97 ± 11.48ab | 5.71 ± 1.03ac | 19.02 ± 4.01abc |
P < 0.01 vs the normal control;
P < 0.05 vs the alcohol group;
P < 0.05 vs the fat-rich diet group.
Figure 1.

Swelling, diffusive steatosis of hepatocytes (SudanIV 40×).
Figure 2.

Central vein fibrosis (Masson 40 ×).
Figure 3.

Activated stellate cells and perisinusoid fibrosis (TEM × 8000).
Expression of PPARγ
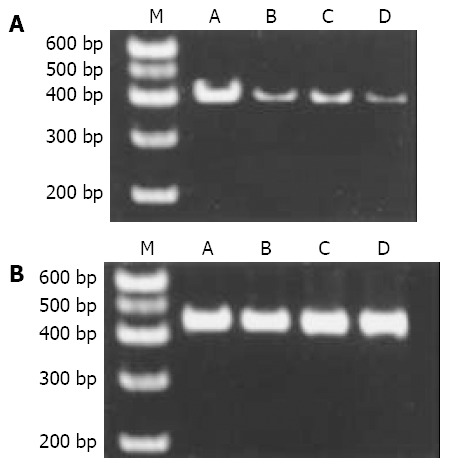
The level of PPARγ protein and mRNA in rat livers detected by immunohistochemistry and RT-PCR respectively is shown in Table 3. The levels of PPARγ expression were decreased significantly in model groups (groups B-D), especially in group D (Figure 4).
Table 3.
Level of PPARγ protein and mRNA in rat livers (%)
| Group | n | PPARγ protein | PPARγ mRNA |
| A | 1 0 | 18.34 ± 3.73 | 0.8097 ± 0.098 |
| B | 9 | 8.82 ± 2.52a | 0.2530 ± 0.072a |
| C | 1 0 | 11.73 ± 2.51a | 0.3647 ± 0.084a |
| D | 9 | 3.43 ± 1.48abd | 0.1226 ± 0.054abd |
P < 0.05 vs the normal control;
P < 0.01 vs the alcohol group;
P < 0.01 vs the fat-rich diet group.
Figure 4.

Expression of PPARγ mRNA and GAPDH mRNA in the liver of rats with FLD. A: Expression of PPARγ mRNA in the liver of rats with FLD; B: Expression of GAPDH mRNA in the liver of rats with FLD. From left to right M: PCR marker; lane A: normal control; lane B: alcohol group; lane C: fat-rich diet group. Lane D: alcohol and fat-rich diet group
Relationship between levels of PPARγ protein and biochemical and histological parameters
The correlation analysis showed that the expression of PPARγ protein in the liver of model rats (groups B-D) was associated negatively with the level of serum TNFα, the content of MDA in the liver, the degree of liver inflammation, necrosis, and fibrosis, but not associated with the degree of liver steatosis and the level of serum ALT (Table 4).
Table 4.
Correlation between levels of PPARγ protein and biochemical, histological parameters in model rats (r value)
| Groups | ALT | TNFα | MDA | Steatosis | Inflammation | Fibrosis |
| B | -0.263 | -0.745b | -0.560 a | -0.437 | -0.568b | -0.728a |
| C | -0.493 | -0.662a | -0.772b | -0.323 | -0.671a | -0.812b |
| D | -0.352 | -0.624b | -0.781b | -0.329 | -0.891b | -0.679b |
P < 0.05 vs the normal control;
P < 0.01 vs the alcohol group.
DISCUSSION
It is well known that PPARγ is one of the nuclear transcription factors activated by ligands and belongs to type II nuclear receptor superfamily. It includes 3 subtypes as PPARα, PPARδ and PPARγ. PPARα is expressed abundantly in liver associated with lipid deposition and certain amount of PPARγ could be found in liver possibly related to the inflammation[19-30]. The experiment in vitro proved that the activation of PPARγ could inhibit the secretion of cytokines and chemokines. For example, the activation of PPARγ could inhibit the secretion of IL-6, IL-1 and TNFα induced by lipopolysaccharide (LPS)[31]. Kon proved that pioglitazone (1 mg/kg body weight), the ligand of PPARγ could prevent liver from inflammation, necrosis and increase of serum TNFα caused by carbon tetrachloride. At the same time pioglitazone could inhibit the expression of α-SMA and type I precollagenin of primary cultured hepatic stellate cells (HSCs)[11,32]. The activation of HSC was the basis of liver fibrosis. Everett’s research also proved that activation of PPARγ could inhibit the activation of cultured HSC in vitro[19]. We speculated that decreased expression and dysfunction of PPARγ might correlate with the release of inflammatory mediator and fibrosis during the process of liver injury due to alcohol and high fat diet.
Our data showed that there were steatosis, inflammation and centrolobular ballooning degeneration, necrosis with fibrosis in the livers of rats fed with either alcohol or high fat diet, especially in the rats fed with both alcohol and high fat. The expression of PPARγ in the liver of rats with FLD (groups B-D) decreased significantly particularly in group D compared to the normal control (P < 0.05). The correlation analysis indicated that except for steatosis ,the expression of PPARγ correlated negatively with the levels of liver MDA, serum TNFα and the degree of inflammation and fibrosis in livers of rats with FLD. These suggested that the weaker the PPARγ expressed, the more severe the liver would be damaged. High-fat diet could deteriorate liver damage and promote liver fibrosis by increasing the lipid deposition, lipid peroxidation and inhibiting PPARγ expression in the liver. It proved that PPARγ played a very important role in the cascade reaction of lipid peroxidation - release of inflammation cytokines -damage of liver - liver fibrosis of rats with FLD. It might be one of the initiation factors. Therefore, the ligand of PPARγ might block the development of inflammation, necrosis and fibrosis of FLD and be potentially used for FLD treatment.
Footnotes
Edited by Zhu LH, Wang XL Proofread by Xu FM
References
- 1.Day CP, James OF. Steatohepatitis: a tale of two "hits"? Gastroenterology. 1998;114:842–845. doi: 10.1016/s0016-5085(98)70599-2. [DOI] [PubMed] [Google Scholar]
- 2.Chitturi S, George J. Interaction of iron, insulin resistance, and nonalcoholic steatohepatitis. Curr Gastroenterol Rep. 2003;5:18–25. doi: 10.1007/s11894-003-0005-y. [DOI] [PubMed] [Google Scholar]
- 3.Gao ZQ, Lu FE. Free fatty acid, insulin resistance and nonal-coholic steatohepatitis. Shijie Huaren Xiaohua Zazhi. 2003;11:1043–1045. [Google Scholar]
- 4.Fan JG. Steat ohepatitis studies. Shijie Huaren Xiaohua Zazhi. 2001;9:6–10. [Google Scholar]
- 5.Chitturi S, Abeygunasekera S, Farrell GC, Holmes-Walker J, Hui JM, Fung C, Karim R, Lin R, Samarasinghe D, Liddle C, et al. NASH and insulin resistance: Insulin hypersecretion and specific association with the insulin resistance syndrome. Hepatology. 2002;35:373–379. doi: 10.1053/jhep.2002.30692. [DOI] [PubMed] [Google Scholar]
- 6.Wu Q, Cheng J, Li L. Study on alcoholic fatty liver disease. Shijie Huaren Xiaohua Zazhi. 2002;10:1037–1038. [Google Scholar]
- 7.Bedoucha M, Atzpodien E, Boelsterli UA. Diabetic KKAy mice exhibit increased hepatic PPARgamma1 gene expression and develop hepatic steatosis upon chronic treatment with antidiabetic thiazolidinediones. J Hepatol. 2001;35:17–23. doi: 10.1016/s0168-8278(01)00066-6. [DOI] [PubMed] [Google Scholar]
- 8.Kersten S. Peroxisome proliferator activated receptors and obesity. Eur J Pharmacol. 2002;440:223–234. doi: 10.1016/s0014-2999(02)01431-0. [DOI] [PubMed] [Google Scholar]
- 9.Clarke SD, Thuillier P, Baillie RA, Sha X. Peroxisome proliferator-activated receptors: a family of lipid-activated transcription factors. Am J Clin Nutr. 1999;70:566–571. doi: 10.1093/ajcn/70.4.566. [DOI] [PubMed] [Google Scholar]
- 10.Kersten S, Mandard S, Escher P, Gonzalez FJ, Tafuri S, Desvergne B, Wahli W. The peroxisome proliferator-activated receptor alpha regulates amino acid metabolism. FASEB J. 2001;15:1971–1978. doi: 10.1096/fj.01-0147com. [DOI] [PubMed] [Google Scholar]
- 11.Kon K, Ikejima K, Hirose M, Yoshikawa M, Enomoto N, Kitamura T, Takei Y, Sato N. Pioglitazone prevents early-phase hepatic fibrogenesis caused by carbon tetrachloride. Biochem Biophys Res Commun. 2002;291:55–61. doi: 10.1006/bbrc.2002.6385. [DOI] [PubMed] [Google Scholar]
- 12.Marra F, Efsen E, Romanelli RG, Caligiuri A, Pastacaldi S, Batignani G, Bonacchi A, Caporale R, Laffi G, Pinzani M, et al. Ligands of peroxisome proliferator-activated receptor gamma modulate profibrogenic and proinflammatory actions in hepatic stellate cells. Gastroenterology. 2000;119:466–478. doi: 10.1053/gast.2000.9365. [DOI] [PubMed] [Google Scholar]
- 13.Li MY, Deng H, Zhao JM, Dai D, Tan XY. Peroxisome proliferator-activated receptor gamma ligands inhibit cell growth and induce apoptosis in human liver cancer BEL-7402 cells. World J Gastroenterol. 2003;9:1683–1688. doi: 10.3748/wjg.v9.i8.1683. [DOI] [PMC free article] [PubMed] [Google Scholar]
- 14.Li MY, Deng H, Zhao JM, Dai D, Tan XY. PPARgamma pathway activation results in apoptosis and COX-2 inhibition in HepG2 cells. World J Gastroenterol. 2003;9:1220–1226. doi: 10.3748/wjg.v9.i6.1220. [DOI] [PMC free article] [PubMed] [Google Scholar]
- 15.Kersten S, Desvergne B, Wahli W. Roles of PPARs in health and disease. Nature. 2000;405:421–424. doi: 10.1038/35013000. [DOI] [PubMed] [Google Scholar]
- 16.Rao MS, Peters JM, Gonzalez FJ, Reddy JK. Hepatic regeneration in peroxisome proliferator-activated receptor alpha-null mice after partial hepatectomy. Hepatol Res. 2002;22:52–57. doi: 10.1016/s1386-6346(01)00119-x. [DOI] [PubMed] [Google Scholar]
- 17.Yu S, Rao S, Reddy JK. Peroxisome proliferator-activated receptors, fatty acid oxidation, steatohepatitis and hepatocarcinogenesis. Curr Mol Med. 2003;3:561–572. doi: 10.2174/1566524033479537. [DOI] [PubMed] [Google Scholar]
- 18.Braissant O, Foufelle F, Scotto C, Dauça M, Wahli W. Differential expression of peroxisome proliferator-activated receptors (PPARs): tissue distribution of PPAR-alpha, -beta, and -gamma in the adult rat. Endocrinology. 1996;137:354–366. doi: 10.1210/endo.137.1.8536636. [DOI] [PubMed] [Google Scholar]
- 19.Everett L, Galli A, Crabb D. The role of hepatic peroxisome proliferator-activated receptors (PPARs) in health and disease. Liver. 2000;20:191–199. doi: 10.1034/j.1600-0676.2000.020003191.x. [DOI] [PubMed] [Google Scholar]
- 20.Reddy JK, Hashimoto T. Peroxisomal beta-oxidation and peroxisome proliferator-activated receptor alpha: an adaptive metabolic system. Annu Rev Nutr. 2001;21:193–230. doi: 10.1146/annurev.nutr.21.1.193. [DOI] [PubMed] [Google Scholar]
- 21.Qi C, Zhu Y, Reddy JK. Peroxisome proliferator-activated receptors, coactivators, and downstream targets. Cell Biochem Biophys. 2000;32 Spring:187–204. doi: 10.1385/cbb:32:1-3:187. [DOI] [PubMed] [Google Scholar]
- 22.Qi C, Zhu Y, Pan J, Usuda N, Maeda N, Yeldandi AV, Rao MS, Hashimoto T, Reddy JK. Absence of spontaneous peroxisome proliferation in enoyl-CoA Hydratase/L-3-hydroxyacyl-CoA dehydrogenase-deficient mouse liver. Further support for the role of fatty acyl CoA oxidase in PPARalpha ligand metabolism. J Biol Chem. 1999;274:15775–15780. doi: 10.1074/jbc.274.22.15775. [DOI] [PubMed] [Google Scholar]
- 23.Yu S, Matsusue K, Kashireddy P, Cao WQ, Yeldandi V, Yeldandi AV, Rao MS, Gonzalez FJ, Reddy JK. Adipocyte-specific gene expression and adipogenic steatosis in the mouse liver due to peroxisome proliferator-activated receptor gamma1 (PPARgamma1) overexpression. J Biol Chem. 2003;278:498–505. doi: 10.1074/jbc.M210062200. [DOI] [PubMed] [Google Scholar]
- 24.Hashimoto T, Cook WS, Qi C, Yeldandi AV, Reddy JK, Rao MS. Defect in peroxisome proliferator-activated receptor alpha-inducible fatty acid oxidation determines the severity of hepatic steatosis in response to fasting. J Biol Chem. 2000;275:28918–28928. doi: 10.1074/jbc.M910350199. [DOI] [PubMed] [Google Scholar]
- 25.Kersten S, Seydoux J, Peters JM, Gonzalez FJ, Desvergne B, Wahli W. Peroxisome proliferator-activated receptor alpha mediates the adaptive response to fasting. J Clin Invest. 1999;103:1489–1498. doi: 10.1172/JCI6223. [DOI] [PMC free article] [PubMed] [Google Scholar]
- 26.Reddy JK. Nonalcoholic steatosis and steatohepatitis. III. Peroxisomal beta-oxidation, PPAR alpha, and steatohepatitis. Am J Physiol Gastrointest Liver Physiol. 2001;281:G1333–G1339. doi: 10.1152/ajpgi.2001.281.6.G1333. [DOI] [PubMed] [Google Scholar]
- 27.Rao MS, Reddy JK. Peroxisomal beta-oxidation and steatohepatitis. Semin Liver Dis. 2001;21:43–55. doi: 10.1055/s-2001-12928. [DOI] [PubMed] [Google Scholar]
- 28.Fan CY, Pan J, Usuda N, Yeldandi AV, Rao MS, Reddy JK. Steatohepatitis, spontaneous peroxisome proliferation and liver tumors in mice lacking peroxisomal fatty acyl-CoA oxidase. Implications for peroxisome proliferator-activated receptor alpha natural ligand metabolism. J Biol Chem. 1998;273:15639–15645. doi: 10.1074/jbc.273.25.15639. [DOI] [PubMed] [Google Scholar]
- 29.Clarke SD. Nonalcoholic steatosis and steatohepatitis. I. Molecular mechanism for polyunsaturated fatty acid regulation of gene transcription. Am J Physiol Gastrointest Liver Physiol. 2001;281:G865–G869. doi: 10.1152/ajpgi.2001.281.4.G865. [DOI] [PubMed] [Google Scholar]
- 30.Chitturi S, Farrell GC. Etiopathogenesis of nonalcoholic steatohepatitis. Semin Liver Dis. 2001;21:27–41. doi: 10.1055/s-2001-12927. [DOI] [PubMed] [Google Scholar]
- 31.Reginato MJ, Krakow SL, Bailey ST, Lazar MA. Prostaglandins promote and block adipogenesis through opposing effects on peroxisome proliferator-activated receptor gamma. J Biol Chem. 1998;273:1855–1858. doi: 10.1074/jbc.273.4.1855. [DOI] [PubMed] [Google Scholar]
- 32.Miyahara T, Schrum L, Rippe R, Xiong S, Yee HF, Motomura K, Anania FA, Willson TM, Tsukamoto H. Peroxisome proliferator-activated receptors and hepatic stellate cell activation. J Biol Chem. 2000;275:35715–35722. doi: 10.1074/jbc.M006577200. [DOI] [PubMed] [Google Scholar]


