
Figure 1.
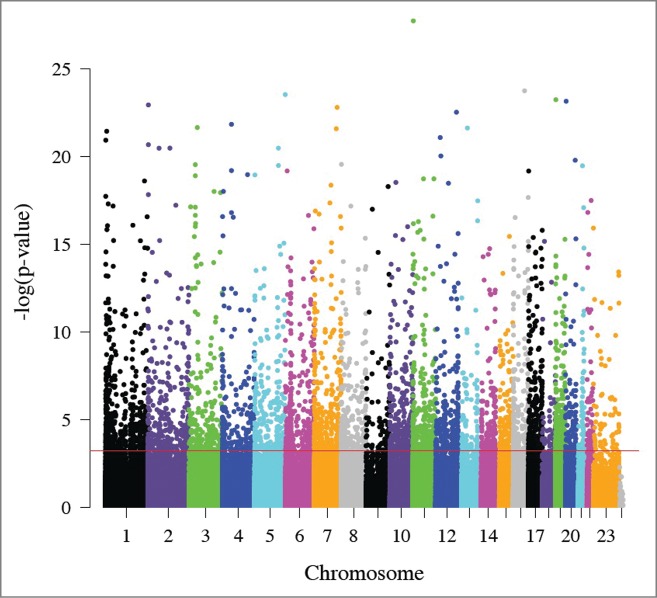
Manhattan plot of the relationship between maternal and fetal DNA methylation. The x-axis represents the position of each CpG site by chromosome. The y-axis represents the negative log10 of the P-value for the association between maternal and fetal methylation for each CpG site. The red line indicates experiment-wide significance based on a false discovery rate of 5% such that the 5,171 CpG sites above this line are significantly correlated in leukocytes from a mother and her fetus.