
Figure 4.
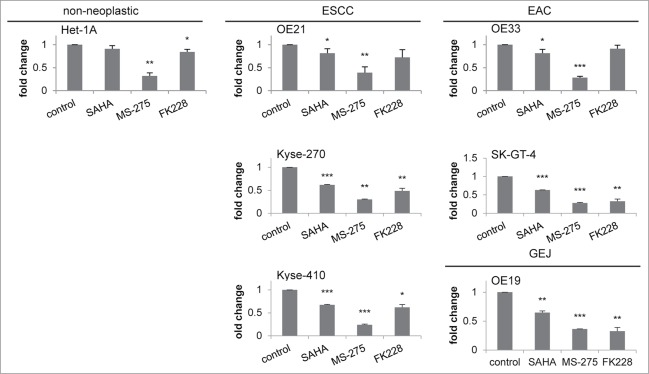
Downregulation of HDAC activity by HDACi. HDAC activity was measured 24 h post HDACi/AZA addition, showing similar downregulation of HDAC activity in all 7 cell lines. Inhibitor concentrations: SAHA = 0.1 μM, MS-275 = 0.5 μM and FK228 = 0.1 nM. Shown is the mean ± SEM of 3 independent experiments, performed in technical duplicates. Significance levels are represented as *: 0.05–0.01, **: ≤ 0.01–0.001 and ***: ≤ 0.001.