Abstract
Regulatory agencies have recently recommended a Quality by Design (QbD) approach for the manufacturing of therapeutic molecules. A QbD strategy requires deep understanding at the molecular level of the attributes that are crucial for safety and efficacy and for insuring that the desired quality of the purified protein drug product is met at the end of the manufacturing process. A mass spectrometry (MS)-based approach to simultaneously monitor the extensive array of product quality attributes (PQAs) present on therapeutic molecules has been developed. This multi-attribute method (MAM) uses a combination of high mass accuracy / high resolution MS data generated by Orbitrap technology and automated identification and relative quantification of PQAs with dedicated software (Pinpoint). The MAM has the potential to replace several conventional electrophoretic and chromatographic methods currently used in Quality Control to release therapeutic molecules. The MAM represents an optimized analytical solution to focus on the attributes of the therapeutic molecule essential for function and implement QbD principles across process development, manufacturing and drug disposition.
Keywords: monoclonal antibody, multi-attribute method (MAM), peptide map, product quality attributes, quality by design
Abbreviations
- IgG2
immunoglobulin G2 antibody isotype
- PTMs
post-translational modifications
- CQAs
critical quality attributes
- QbD
Quality by Design
- RP-HPLC
reverse phase, high performance liquid chromatography
- MS
mass spectrometry
- MS2
tandem MS or MS/MS
- MAM
multi-attribute method
- RCESDS
reduced capillary electrophoresis sodium dodecyl sulfate
- NGHC
non-glycosylated heavy chain
- A2G2F
asialo-, bi-galactosylated bi-antennary, core substituted with fucose
- A1G0
asialo-, agalacto-, mono-antennary
- M5
oligomannose 5
- A1G0F
asialo-, agalacto-, mono-antennary, core substituted with fucose
- A2G0
asialo-, agalacto-, bi-antennary
- M6
oligomannose 6
- A1G1F
asialo-, mono-galactosylated mono-antennary, core substituted with fucose
- A2G0F
asialo-, agalacto-, bi-antennary, core substituted with fucose
- A2G1
asialo-, mono-galactosylated bi-antennary
- M7
oligomannose 7
- A2G1F
asialo-, mono-galactosylated bi-antennary, core substituted with fucose
- A2G2
asialo-, bi-galactosylated bi-antennary
- M8
oligomannose 8
- M9
oligomannose 9
Introduction
The demand for new therapies, loss of revenue from patent expirations and growth of emerging markets have placed increasing pressure on manufacturing networks to be cost effective and highly productive.1,2 New processes, control strategies and quality systems that allow efficient product disposition are needed to enable optimal changeover of manufacturing batches. In addition, regulatory expectations have shifted to a quality by design (QbD) approach to specifications, filings and product understanding to better ensure patient safety and benefits when bringing new drugs to market.3-9 These QbD guidelines include development of a quality target product profile (QTPP) that identifies critical quality attributes (CQAs) and implementation of a control strategy to ensure the QTPP.10 The need for increased efficiencies in manufacturing with higher regulatory expectations for QbD require technological advancements that optimize product disposition speed while providing better product knowledge.
Application of highly resolving mass spectrometry (MS) techniques have resulted in better understanding at the molecular level of the attributes that are crucial for safety and efficacy of complex bio-therapeutic molecules, as well as elucidation of the mechanisms associated with degradation.11-14 A logical next step for the biopharmaceutical companies that have embraced QbD and CQA during process development would be the applications of these concepts for data-directed manufacturing and quality control associated with drug disposition. To achieve the premises of QbD, analytics that focus on product quality attributes are clearly needed.15,16 Ideally, such analytical tools would be universally applied to provide quantitative information and optimize the successive stages in the lifecycle of a protein drug, from clone selection and process development to quality control and drug disposition.
Complex glycoproteins, specifically monoclonal antibodies, are currently the most prevalent type of bio-therapeutic in development.17,18 Monoclonal antibodies, which offer high specificity and low side effects, are used to treat many types of cancer, autoimmunity/inflammatory diseases, infections, and metabolic disorders, yielding their impressive success as human medicines.18,19 In-depth characterization of these bio-therapeutics is essential before they can be used in clinical trials.11 A panel of separation techniques such as capillary electrophoresis (CE), ion exchange chromatography, reversed-phase high performance liquid chromatography (RP-HPLC), Size-exclusion chromatography (SEC) or hydrophobic-interaction chromatography (HIC) can be typically utilized on intact molecules to monitor consistency of the process and identify product variants and impurities.13,20,21 These electrophoretic and chromatographic methods, although classically used in quality control of biologics as release tests,22 are not directly able to monitor PQAs at the molecular level. Characterization and quantification of product attributes of glycoproteins is typically done during analytical development at the peptide or glycan level using successive steps of enzymatic digestion, chemical labeling, electrophoretic or chromatographic separation. When combined at the characterization stage to increasingly powerful mass spectrometry (MS) techniques, these methods provide detailed structural information on therapeutic glycoproteins and important insights on mechanism of action.13,23-26 However, although these methods have been successfully used for in-depth analysis of representative lots, they have been limited in their scope and not applied in a more deliberate approach for the systematic evaluation of the quality of the drug substance.
Our goal is to develop a resolving and automated analytical technique that would provide better quantitative information of PQAs than current conventional QC release methods and align with QbD principles by monitoring the quality build in the product all along the manufacturing process.
We present here a MS-based multi-attribute method for characterization and relative quantification of post-translational modifications on bio-therapeutic molecules. This peptide mapping method uses a combination of high mass accuracy / high resolution MS data generated by Orbitrap technology and automated identification and relative quantification of post-translational modifications with dedicated software (Pinpoint). The MAM can be used for clone screening, process development, comparability, and stability assessment. Discussion here will be focused on characterization and relative quantification of amino acid modifications and glycoform distribution of monoclonal antibodies.
Results
Analytical setup for automated detection and quantification of PQAs
The multi-attribute method (MAM) was developed to monitor and quantify multiple post-translational modifications (PTMs) of bio-therapeutic molecules. The method involved a peptide mapping method using a combination of high mass accuracy / high resolution MS data generated by Orbitrap technology (Thermo Scientific Exactive Plus mass spectrometer) and automated identification and relative quantification of post-translational modifications with dedicated software (Thermo Scientific Pinpoint). This study uses Pinpoint to target MS1 precursor ions by retention time, accurate mass and isotopic distribution. In-depth characterization of the molecules using MS2 is essential to build the Pinpoint workbooks. Pinpoint provides automated data processing and outputs the area for the MS1 precursor. Although orbitrap technology was used for this study, any high mass accuracy / high resolution MS instrument and automated data analysis software could be used for this method.
The workflow for the MAM involves characterizing a monoclonal antibody using MS2 and HILIC MS to identify the modifications on the antibody using an MS2 capable MS (Thermo Scientific Q-Exactive). Next a Pinpoint workbook is created for each of the modification that will be monitored. Once the Pinpoint workbook is created, the MS data only needs to be collected in MS1 mode or with an MS1 only MS (Thermo Scientific Exactive Plus). Initially, the PTMs on the anti-Streptavidin IgG2 antibody were characterized using data acquired on a Thermo Scientific Q-Exactive mass spectrometer. These data were searched with Thermo Scientific Proteome Discoverer (Sequest). The amino acid sequence for the heavy chain and the light chain of the anti-streptavidin IgG2 molecule are shown in Figure 1A. The primary sequence coverage for the light chain and heavy chain, of the anti-streptavidin IgG2 molecule, were 100% and 96.8%, respectively. The PTMs observed from our search results are listed in Figure 1B. A total of 13 glycans were observed by HILIC-MS analysis (Fig. 1C). The PTM list and glycan list were used to create the Pinpoint workbook for automated analysis of those PTMs. The PTMs selected for the pinpoint workbook were verified by manual inspection of the MS2 spectra (data not shown). The glycans monitored by the Pinpoint workbook were verified using HILIC-MS (data not shown). The peptide that carries the N-glycosylation consensus site, EEQFNSTFR, was entered into Pinpoint and all 13 of the detected glycans were added as individual modifications to the EEQFNSTFR peptide. All of the detectable charge states for each of glyco-peptides and 5 isotopes for each glyco-peptide were added to the Pinpoint workbook. The Pinpoint workbooks for other PQAs, including deamidations and oxidations were set up in a similar fashion.
Figure 1.
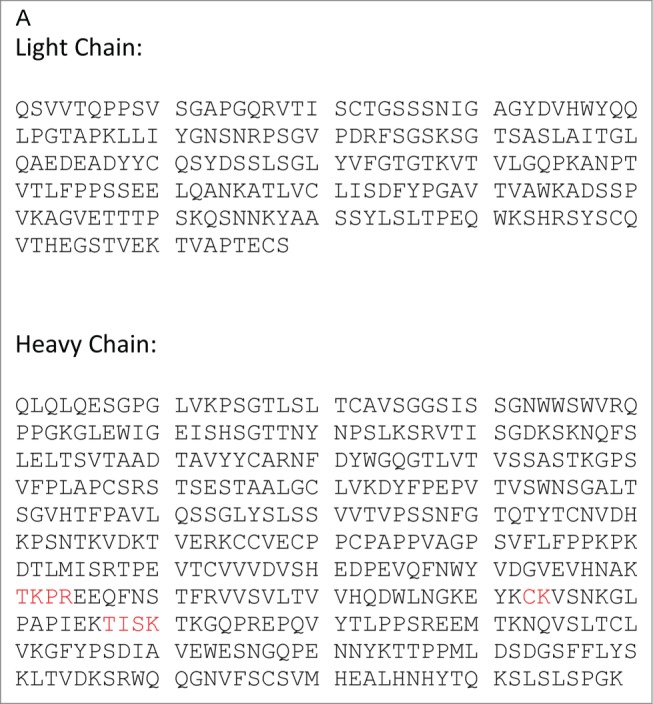
(A) Sequence of anti-streptavidin IgG2 (Peptides in red were not found in sequence coverage). (Continued on next page.)
Figure 1.
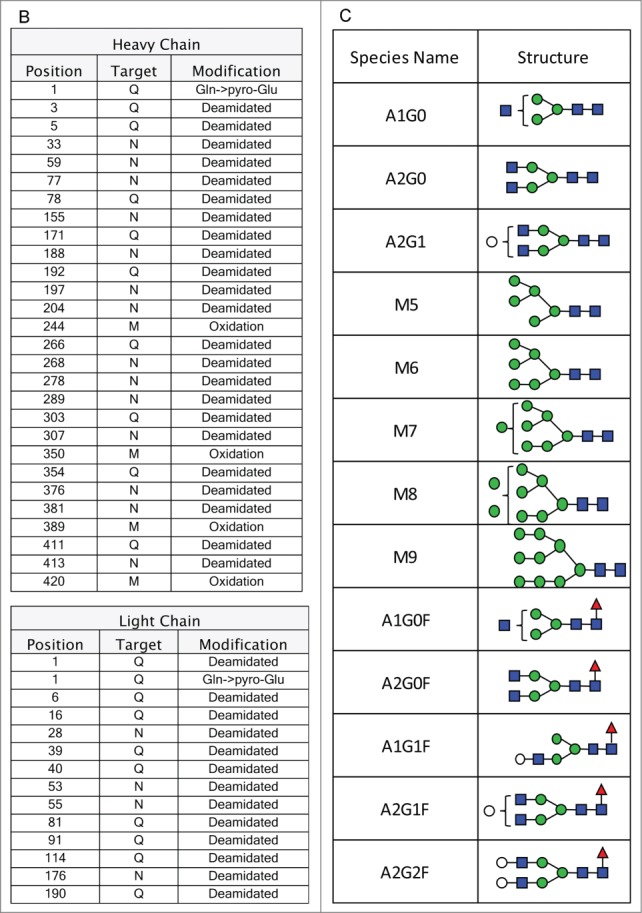
(Continued from previous page). (B) Amino acid modifications detected by Proteome Discoverer on the heavy and light chain of the anti-Streptavidin IgG2 molecule. (C) List of glycans observed by HILIC-MS analysis of the anti-Streptavidin IgG2 molecule.
Precision
Precision of the assay was considered by assessing repeatability and intermediate precision. Repeatability (intra-assay precision) for the monitored post-translational modifications was demonstrated utilizing duplicate injections of 5 independent digests of the anti-streptavidin IgG2 molecule. The raw data from the 10 injections were evaluated using the glycan specific Pinpoint workbook. All of the glycans detected by HILIC were detected, as glyco-peptides, by Pinpoint. In-source fragmentation can occur to the glyco-peptides monitored by the MAM.26 Each glyco-peptide was inspected manually to determine if in-source fragmentation had occurred. No significant in-source fragmentation was observed with the glyco-peptides monitored by the MAM (data not shown). To calculate the amount of each glyco-peptide, the areas for all of the glyco-peptides were summed. The area for each specific glyco-peptide was then divided by the summed area of all of the glyco-peptides to give the percent for each glyco-peptide (Fig. 2). The precision-repeatability measured for the detected glyco-peptides are in Figure 3A. The relative standard deviations for all of the measured glyco-peptides were less than 4%.
Figure 2.

Calculation of the relative abundance of each glycan.
Figure 3.
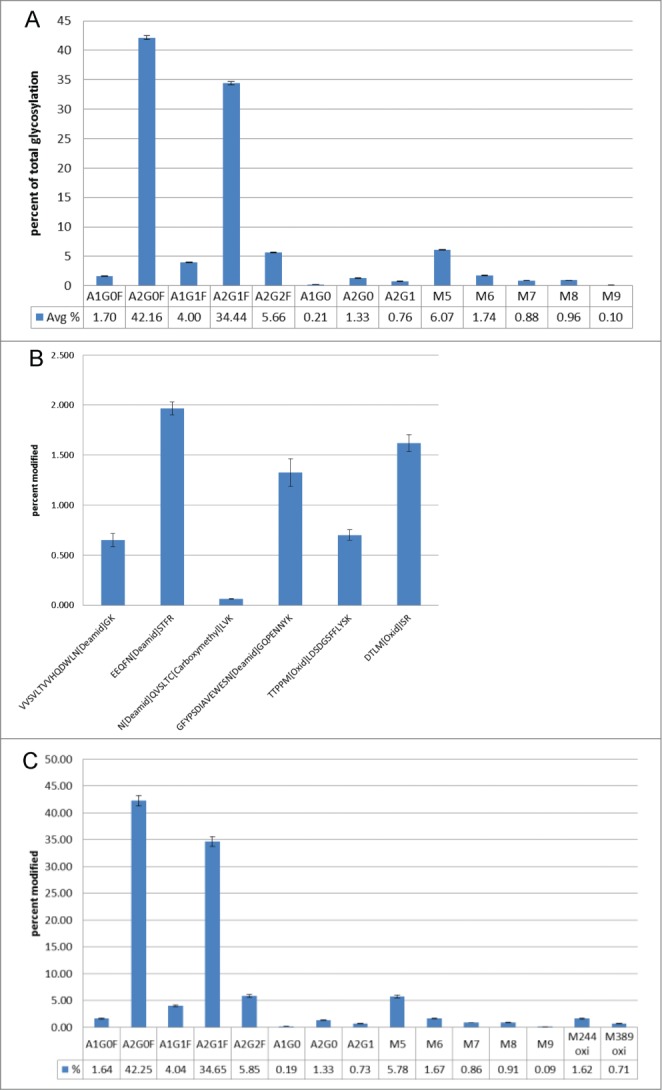
(A) Percent relative abundance of the glycans monitored with the Pinpoint workbook. Error bars display the standard deviation for each measured glycan over 10 injections. (B) Percent relative abundance of oxidations and deamidations. Error bars display the standard deviation for each measured modification over 10 injections. (C) Glycans and oxidations monitored by the MAM over a 6 month time frame. The error bars display the standard deviation for each modification from 3 independent sample preparations, prepared 3 times over 6 months.
The precision-repeatability was determined for other PTMs on the anti-streptavidin IgG2 molecule. Two oxidations and 4 deamidations were examined in the same 10 injections described above. The Pinpoint workbook for the oxidations and deamidations were set up in a similar fashion to the glyco-peptide workbook. The amount of each oxidation and deamidation detected was calculated by summing the area for the modified peptide and unmodified peptide and then dividing the area for the modified peptide by the summed area. The precision-repeatability for all of oxidations and deamidations monitored were less than 11% (Fig. 3B)
Intermediate precision (assay-to-assay variation) was demonstrated utilizing 3 sets of 3 independent preparations (duplicate injections) each over 6 months. The intermediate precision measured for the detected glyco-peptides are in Figure 3C. The relative standard deviation for all of the measured glyco-peptides was less than 13%. The intermediate precision of the monitored oxidations were also assessed and the precision variance was less than 9% (Fig. 3C). The precision repeatability and intermediate precision for the MAM has been demonstrated using different types of modifications including oxidations, deamidations and glycosylation. The MAM has shown excellent intermediate precision over many months and many injections. While deamidations, oxidations and glycosylation were the only modifications reported in this study, the MAM has also shown excellent precision repeatability and intermediate precision for other PTMs including isomerization, hydroxylation, and glycation (data not shown).
Comparison to traditional assays
The biotechnology industry has used traditional assays, including capillary electrophoresis (CE), ion exchange chromatography, reversed phase liquid chromatography (RP-HPLC), and normal phase (NP) or hydrophilic interaction chromatography (HILIC), to monitor modifications like glycosylation, clipping, deamidations and oxidations. The traditional assay for monitoring glycans is HILIC analysis. The glycans are released from the monoclonal antibody and labeled with 2AA before HILIC analysis. HILIC analysis was performed on our streptavidin IgG2 molecule. The glycans detected and the amounts of each glycan are listed in Figure 4. We compared the HILIC results to the results from the MAM. The MAM showed very good correlation with the glycan HILIC assay. The relative difference for the majority of the glycans was less than 10%.
Figure 4.
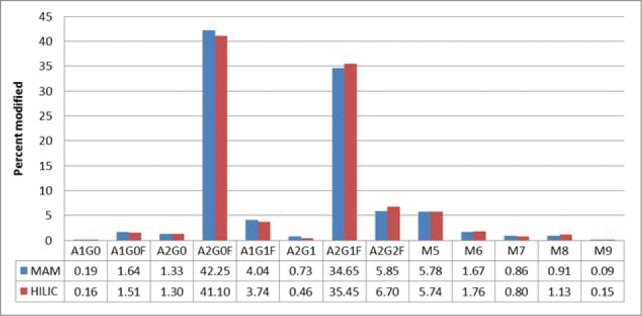
Traditional assay (HILIC) vs MAM glycan analysis.
For the MAM to be implemented as a Process Development tool, the MAM needs to be able to monitor changes in the PTMs. Mab1 was chosen for this experiment. The glycan profile for Mab1 was examined over multiple days of culture. To monitor changes in the glycans on the monoclonal antibody, we chose to examine A2G0F, A2G1F and A2G0 (Fig. 5). The amount of each of the glycans, which were chosen for monitoring by the MAM, showed changes by HILIC analysis through the days of culture. The amount of A2G0F started around 40%, but grew to over 70% when measured by the HILIC assay (Fig. 5A). The MAM was able to monitor the trend for A2G0F in a similar fashion to the glycan HILIC assay. A2G1F on Mab1, was measured, by HILIC, at about 40% on day 3, but decreased during the culture period (Fig. 5B). The amount of A2G1F at the end of the culture period was around 13%. The MAM displayed a similar downward trend for A2G1F. The glycan A2G0 was measured at about 1% on day 3 (Fig. 5C). The A2G0 glycan fluctuated during the days of culture. The A2G0 glycan reached a high around 9% before consistently showing 5.5% at the end of the culture period, by HILIC analysis. The fluctuations observed by HILIC analysis for A2G0 were also observed using the MAM. These data demonstrate that the MAM can monitor the glycan profile of a monoclonal antibody similarly to the traditional HILIC assay.
Figure 5.
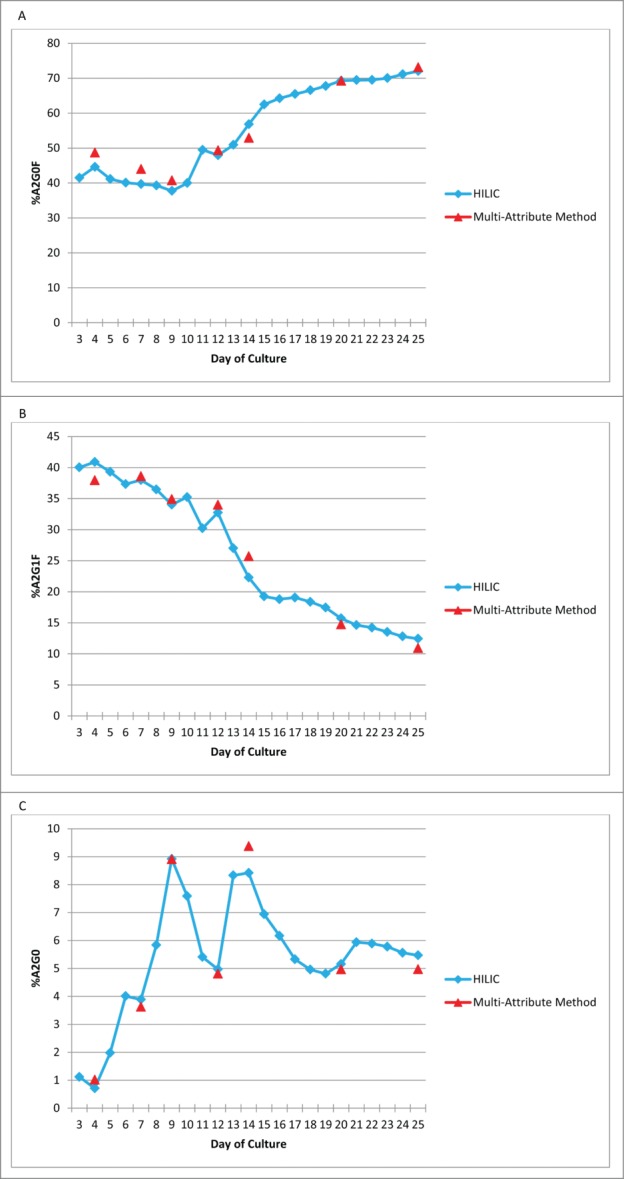
MAM can monitor Attribute trending in Mab1. (A) A2G0F. (B) A2G1F. (C) A2G0.
The traditional assays to measure attributes like clips and deamidations include capillary electrophoresis (CE) and ion exchange chromatography. CE and ion exchange chromatography are able to indicate when deamidation or clipping might be occurring, but these assays do not identify the site of the modification. Characterization of the peaks associated with CE and ion exchange chromatography is necessary to understand the type of PTM that might cause a peak in CE or ion exchange chromatography. The MAM can directly monitor PTMs on specific amino acids. The characterization of each antibody tested with the MAM identifies the site of the PTM being monitored by MS2 identification.
To demonstrate the MAM's ability to monitor deamidations, samples were taken from a bioreactor over 25 days of culture. Ion exchange chromatography (specifically cation exchange chromatography (CEX)) was used to monitor the charge variants for the antibody. One of the acidic peaks was characterized because it changed over the different days of culture (Fig. 6). After fractionation of the CEX peaks and peptide mapping of the acidic fraction, we determined that the acidic peak was impacted by deamidiation at a specific residue in the light chain of the antibody (data not shown). Purified antibody from day 4, 7, 9, 12, 14, 20, and 25 were analyzed using the MAM. The MAM was able to monitor the same light chain deamidation event. The light chain deamidation event detected by the MAM trended similarly to the acidic peak from the CEX trace. The offset observed in Figure 6 between the CEX acidic peak and the MAM reported deamidation is caused by the different methods for reporting values for the CEX acidic peak and the MAM reported deamidation. The changes in the CEX acidic peak are representing the total change in the acidic nature for the antibody over the days of culture. The MAM is directly monitoring a specific deamidation event on the antibody over the days of culture. The similar trend observed between the CEX acidic peak and the MAM monitored deamidation is observed because the deamidation monitored by the MAM is the major contributor for the acidic peak value in the CEX trace.
Figure 6.
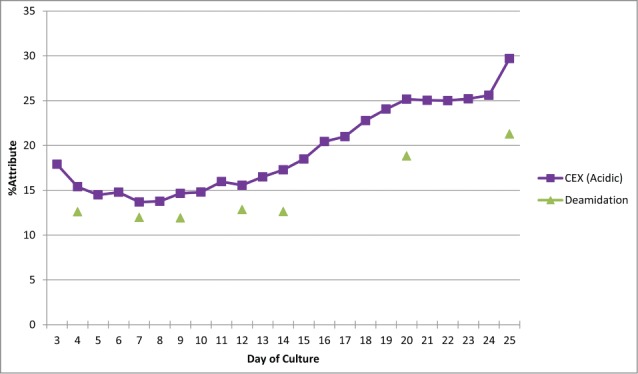
MAM method comparison to traditional CEX release assay using Mab1.
To show the MAM's ability to monitor clips, an experiment was designed to create specific fragments using the IdeS enzyme. Mab1 was fully digested with the IdeS enzyme. The digested antibody was mixed with intact Mab1 at levels of 100 (fully intact Mab1), 99, 95, 90, 50 and 0 (fully digested Mab1)% Mab1. The mixed samples were analyzed by rCE-SDS and the MAM. The protease digest induced clip peaks migrated between the light chain and the non-glycosylated heavy chain of the resulting electropherogram using rCE-SDS (data not shown). Figure 7 shows the expected amount of clipping to be detected from each mixture of the IdeS digested antibody and the fully intact antibody. Both the MAM and the rCE-SDS assay were able to monitor the clips introduced by the mixtures of the IdeS digested antibody with the intact antibody.
Figure 7.
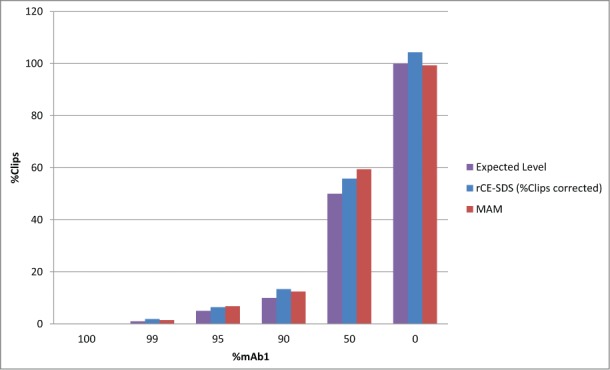
Analysis of IdeS protease digestion induced clips in Mab1 by rCE-SDS and MAM.
Discussion
Adopting a QbD approach in the manufacturing of biologics, as encouraged by regulatory agencies, requires a complete understanding of complex protein drugs at the molecular level.15,16,27 Toward this end, we developed a highly resolving and automated MS technique capable of providing a comprehensive view of the critical quality attributes present on bio-therapeutic molecules. Due to the increased performance of mass spectrometers, and the development of diverse fragmentation techniques and sophisticated data processing software programs, substantial advances have recently been made in the analysis of biologics by mass spectrometry.11,12,14 Detailed information can be obtained on the intimate structure of glycoproteins,26 the potential presence of sequence variants at extremely low levels.28,29 and minute amounts of process impurities.30 It is therefore possible to comprehensively describe a well-characterized drug substance on the analytical side of process development.
Our goal in this work was to expand the usefulness of this information by developing a MS-based method that can leverage all this detailed knowledge, once acquired, to access all the molecule's attributes in one single analysis and in fully automated mode. To this end, we built dedicated workbooks in Pinpoint that have the flexibility to compile all the information available on PTMs, chemical modifications and process impurities. Bearing in mind that this tool may ultimately be used by scientists who are not MS experts (e.g., those performing release testing in Quality Control), we chose to simplify the analysis by interrogating drug substance lots in MS1 mode only. This multi-attribute method presents the characteristics of a universal platform. The data presented in this study outlines a method that can be applied to a molecule in a Process Development lab through the release of the drug product from the Quality Control lab. The sensitivity of this characterization method provides a detailed map of the PTMs that are on a molecule. The creation of a workbook for monitoring multiple PTMs allows for precise and efficient monitoring of the PTMs in a fully automated way. The MAM will enable biopharmaceutical companies to better understand each modification on a molecule through the process of production, formulation, stability assessment and purification. Looking toward the future, the MAM method presents the features enabling process analytical technology applications,31,32 and should become an appropriate tool to advance real-time monitoring of CQAs. Improved characterization and monitoring of therapeutic molecules with our MAM will result in more efficient and better controlled processes and ultimately lead to safer and superior drug products.
Materials and Methods
Materials
Two antibodies, Mab 1 (IgG1) and anti-streptavidin IgG2 were produced and purified at Amgen and stored at < −70°C in a pH 5.2 acetate buffer until use.
Multi-attribute peptide mapping method
Reduction, alkylation, and trypsin digestion
Solutions used in the reduction, alkylation and trypsin digestion of the antibody samples were Tris pH 7.5 and pH 8.4 (Teknova), guanidine hydrochloride and trifluoroacetic acid solutions (TFA) (Thermo Scientific), hydrogen chloride (HCl), dithiothreitol (DTT) and sodium iodoacetate (IAA) (Sigma). Glacial acetic acid, sodium acetate, and sodium hydroxide were from J.T. Baker. Lyophilized trypsin was from Roche. Mass Spec grade water/ 0.1% formic acid and acetonitrile/ 0.1% formic acid were purchased from Fisher Scientific.
The antibody samples (100 ug of antibody) were denatured and reduced using (10 mM) DTT at pH 8.3 in a solution of 7.5 M guanidine at ambient temperature for 30 minutes followed by alkylation with (20 mM) IAA for 20 min. Reaction was quenched with (11 mM) DTT. The solution was desalted using a BioSpin-P6 column (Bio-Rad) and the concentration determined by absorption at 280 nm. Trypsin was added to ∼100 ug of reduced-alkylated antibody at a 1:10 enzyme: substrate ratio and the mixture was incubated at 37°C for 30 minutes. The pH of the digestion is ∼8.0. The digestion efficiency was examined by SDS- PAGE followed by Coomassie blue staining of the gel and determined to be complete (data not shown). After digestion, 10% TFA was added at a 1 : 10 ratio to quench the digestion. The sample concentration was calculated and the digested samples were prepared for analysis or stored at < −80°C.
Reversed-phase LC
Mobile phase A contained 0.1% formic acid in water and mobile phase B contained 0.1% formic acid in 100% acetonitrile. The following LC conditions were used: flow rate 0.25 mL/minute, column temperature 50°C during the separation and the auto-sampler was kept at 4°C. For separation analysis, a nominal load of 3 µg of the digest, based on final sample concentration, was injected onto a Zorbax C18 300-SB, 300 Å pore size, 1.8 µm particle, 2.1 mm x 150 mm column (Agilent). The gradient started at 1% B until 5 minutes, then increased gradually to 10% in 1 minute. Next, the gradient was ramped up from 10% B to 35% B in 70 minutes. The column was then washed with 80% B for 5 minutes followed by equilibration at 1% B for 15 minutes. Total run time per sample was 95 minutes.
Mass spectrometry
The tryptic peptides were separated and monitored by RP-HPLC coupled to MS (Thermo Scientific Exactive Plus or Q Exactive). The MS capillary temperature was maintained at 320°C with an S-lens RF level at 65. The MS spectra collection was performed at 140,000 resolution in positive polarity mode with an AGC target of 1E6, maximum ion time of 200 ms and a scan range of 300 to 1800 m/z between 5 to 70 minutes run time. Accurate mass measurement of the electrospray ionization was monitored using a lock mass of 391.2843 (diisooctyl phthalate).
Search parameters
The raw files from the Q Exactive mass spectrometer were searched using Proteome Discoverer (Thermo Scientific). The MS/MS spectra were searched against the antibody sequence, common contaminants, the CHO-K1 RefSeq protein database (ID GCF_000223135.1) and reversed decoys of all possible peptides. A precursor tolerance of 10 ppm and a fragment tolerance of 0.02 Da were used. Two missed cleavages were allowed and a minimum length of 6 amino acids was required for the identified peptides. Carboxymethylation (+58.005 Da) was added as a static modification to cysteine residues. Oxidations (+15.995 Da) at methionine residues, cyclization (−17.027 Da) of N-terminal residues and deamidations (+0.984 Da) at asparagine and glutamine residues were added as dynamic modifications. The search results were filtered for high confidence identifications (<1% FDR).
Pinpoint
Peptides were manually entered into the Pinpoint software (Thermo Scientific). Modifications, charge states and isotopic distributions were also added to the peptides in the Pinpoint workbook. A tolerance of 5 ppm was used for the analysis in Pinpoint.
Hydrophilic interaction chromatography (HILIC-glycan analysis)
The N-linked glycans were enzymatically released using PNGase F (New England BioLabs). Derivatization (Schiff's Base Formation and reduction) with 2-aminobenzoic acid (2-AA)(Sigma), allows for sensitive and quantitative fluorescent detection because glycans have no or low UV absorptivity. Using reductive amination chemistry, the free reducing end of the released glycan was labeled in a solution of 12 mg/mL 2-AA/0.2 M sodium cyanoborohydride (EMD)/0.8% (w/v) sodium acetate (J T Baker)/0.4% (w/v) boric acid (Alfa Aesar). The solution contained an excess of 2-AA to ensure a high labeling efficiency (>85%) while maintaining the structural integrity of the glycan. The solution containing the released glycan was applied to a Glycoclean S cartridge for removal of excess label and dried in a speed vac. Samples were reconstituted using HPLC grade water. Glycans were injected and bound to the column in high organic condition and eluted at a flow rate of 0.5 mL/min using an increasing gradient of aqueous ammonium formate buffer. The column was an Acquity UPLC BEH Glycan, 1.7 μm column (Waters) in-line with a fluorescence detector. Mobile phase A was a solution of 100 mM ammonium formate, pH 3.0 prepared using ammonium hydroxide (Sigma) and formic acid (EMD) and mobile phase B is 100 % acetonitrile. The gradient began at 78% acetonitrile and elution was accomplished using a gradient ramp to 0.5% acetonitrile in 27 minutes. Total runtime including column re-equilibration was 35 minutes.
Cation-exchange chromatography
Charge variants for the antibody were monitored using a 4.6 × 250 mm Agilent BioMab, NP5 column maintained at 41°C. The column was equilibrated with 100% Buffer A (20mM Sodium Phosphate, pH 6.9) at 0.8 mL/min for 15 min. Samples were prepared for injection by dilution to 2mg/mL in Buffer A followed by an injection load 170 µg. At sample injection, the initial conditions were held for 5 min, followed by a linear gradient from 0 to 18% Buffer B (20 mM sodium phosphate, 500 mM NaCl, pH 6.9) over 30 min. A column wash of 100% Buffer B at 0.8 mL/min for 5 min was performed. The column was then re-equilibrated for 15 min with the initial conditions (100% Buffer A, 0.8 mL/min). The column eluent was monitored at 280 nm.
Preparation of IdeS protease digestion induced clips in MAb1
Clip fragments were generated by digesting Mab1 into Fc/2 and Fab'2 (Mab1′) at a ratio of 60µg of protein to 60 units of the IdeS enzyme (fabRICATOR, Genovis, Lund, Sweden) in 50mM Sodium Phosphate, 150 mM NaCl, pH 6.6 with incubation in a 37°C water bath for 30 minutes. A secondary protease digestion of the resulting Mab1′ fragmented sample was carried out following the above tryptic map procedure with the resulting digest introduced to trypsin digested Mab1 at the peptide level resulting in the levels 100, 99, 95, 90, 50 and 0% Mab1. Each sample was analyzed using the LC-MS method summarized above. The following peptides were monitored using Pinpoint software: H20 (THTCPPCPAPELLGGPSVFLFPPKPK), H20 N-terminal Clip (THTCPPCPAPELLG), and H20 C-terminal Clip (GPSVFLFPPKPK). To calculate the amount of digestion induced clips present in each sample the area reported for the N-terminal clip and C-terminal clip were summed. Then the summed area of the clipped peptides was divided by the total summed area of the 3 peptides listed above resulting in the percent clips detected by MAM.
Monitoring of IdeS protease digestion induced clips in Mab1 by rCE-SDS
To show the MAM's ability to monitor clips, Mab1′ prepared as outlined in the previous section was introduced to intact Mab1 at levels of 100, 99, 95, 90, 50 and 0% Mab1 during preparation for analysis by rCE-SDS. The samples were diluted to 2.1 mg/mL with water and reduced with β-mercaptoethanol in SDS Sample Buffer (Beckman Coulter) at 70°C for 10 min. The reduced protein species were then injected onto a bare-fused silica capillary (50 μm ID × 20.2 cm effective length, Beckman Coulter) via electrokinetic injection at 5 kV for 20 seconds. Separation was performed over 30 min using SDS-MW Gel Buffer (Beckman Coulter) and an effective voltage of 15 kV. UV detection at 220 nm was collected using a photodiode array (PDA) detector of a Beckman Coulter ProteomeLab PA800 CE. The protease digest induced clip peaks migrated between the light chain and the non-glycosylated heavy chain of the resulting electropherogram. The value for %Clips by rCE-SDS was determined by calculating the peak area of this region as a percentage of the total areas of the peaks (LMW +light chain + Digest Induced Clips + NGHC + heavy chain +HMW). The value was then normalized to the calculated percent heavy chain of Mab1 reference standard.
Disclosure of Potential Conflicts of Interest
No potential conflicts of interest were disclosed.
Acknowledgments
We would like to thank Amanda Miller, Yuling Zhang, Wenzhou Li, Sabrina Benchaar, Quanzhou Luo – Amgen, Inc. and Scott Peterman, Amol Prakash, Ryo Komatsuzaki, Jennifer Sutton, Christoph Nickel – ThermoFisher Scientific for their critical feedback in the development of this method.
References
- 1.Gottschalk U, Brorson K, Shukla AA. Innovation in biomanufacturing: the only way forward. Pharm Bioprocessing 2013; 1:141-57; http://dx.doi.org/ 10.4155/pbp.13.17 [DOI] [Google Scholar]
- 2.McLaughlin J, Banerjee A. Biopharmaceutical manufacturing and flexible design: what does the future hold? Pharm Bioprocessing 2014; 2:215-7; http://dx.doi.org/ 10.4155/pbp.14.20 [DOI] [Google Scholar]
- 3.International Conference on Harmonisation of Technical Requirements for Registration of Pharmaceuticals for Human Use Quality Risk Management Q9. 2006. Available at: http://www.ich.org/products/guidelines/quality/article/quality-guidelines.html [DOI] [PMC free article] [PubMed] [Google Scholar]
- 4.International Conference on Harmonisation of Technical Requirements for Registration of Pharmaceuticals for Human Use Pharmaceutical Quality Systems (Q10). 2008. Available at: http://www.ich.org/products/guidelines/quality/article/quality-guidelines.html [DOI] [PMC free article] [PubMed] [Google Scholar]
- 5.International Conference on Harmonisation of Technical Requirements for Registration of Pharmaceuticals for Human Use Pharmaceutical Development Q8(R2). 2009. Available at: http://www.ich.org/products/guidelines/quality/article/quality-guidelines.html [DOI] [PMC free article] [PubMed] [Google Scholar]
- 6.Aksu B, Paradkar A, de Matas M, Ozer O, Guneri T, York P. Quality by design approach: application of artificial intelligence techniques of tablets manufactured by direct compression. AAPS PharmSciTech 2012; 13:1138-46; PMID:22956056; http://dx.doi.org/ 10.1208/s12249-012-9836-x [DOI] [PMC free article] [PubMed] [Google Scholar]
- 7.Kessel M. The problems with today's pharmaceutical business–an outsider's view. Nature Biotechnol 2011; 29:27-33; http://dx.doi.org/ 10.1038/nbt.1748 [DOI] [PubMed] [Google Scholar]
- 8.Aksu B, De Beer T, Folestad S, Ketolainen J, Linden H, Lopes JA, de Matas M, Oostra W, Rantanen J, Weimer M. Strategic funding priorities in the pharmaceutical sciences allied to Quality by Design (QbD) and Process Analytical Technology (PAT). Eur J Pharm Sci 2012; 47:402-5; PMID:22749874; http://dx.doi.org/ 10.1016/j.ejps.2012.06.009 [DOI] [PubMed] [Google Scholar]
- 9.Luciani F, Galluzzo S, Gaggioli A, Kruse NA, Venneugues P, Schneider CK, Pini C, Melchiorri D. Implementing quality by design for biotech products: Are regulators on track? mAbs 2015; 7:451-5; PMID:25853461; http://dx.doi.org/ 10.1080/19420862.2015.1023058 [DOI] [PMC free article] [PubMed] [Google Scholar]
- 10.Yu LX, Amidon G, Khan MA, Hoag SW, Polli J, Raju GK, Woodcock J. Understanding pharmaceutical quality by design. AAPS J 2014; 16:771-83; PMID:24854893; http://dx.doi.org/ 10.1208/s12248-014-9598-3 [DOI] [PMC free article] [PubMed] [Google Scholar]
- 11.Beck A, Wagner-Rousset E, Ayoub D, Van Dorsselaer A, Sanglier-Cianferani S. Characterization of therapeutic antibodies and related products. Anal Chem 2013; 85:715-36; PMID:23134362; http://dx.doi.org/ 10.1021/ac3032355 [DOI] [PubMed] [Google Scholar]
- 12.Kaltashov IA, Bobst CE, Abzalimov RR, Wang G, Baykal B, Wang S. Advances and challenges in analytical characterization of biotechnology products: mass spectrometry-based approaches to study properties and behavior of protein therapeutics. Biotechnol Adv 2012; 30:210-22; PMID:21619926; http://dx.doi.org/ 10.1016/j.biotechadv.2011.05.006 [DOI] [PMC free article] [PubMed] [Google Scholar]
- 13.Sandra K, Vandenheede I, Sandra P. Modern chromatographic and mass spectrometric techniques for protein biopharmaceutical characterization. J Chromatogr A 2014; 1335:81-103; PMID:24365115; http://dx.doi.org/ 10.1016/j.chroma.2013.11.057 [DOI] [PubMed] [Google Scholar]
- 14.Zhang Z. Large-scale identification and quantification of covalent modifications in therapeutic proteins. Anal Chem 2009; 81:8354-64; PMID:19764700; http://dx.doi.org/ 10.1021/ac901193n [DOI] [PubMed] [Google Scholar]
- 15.Kozlowski S, Nashabeh W, Schenerman M, Anderson H, Blumentals I, Ho K, Mahtre R, Rellahan B, Vinci V, McLeod L. QbD for Biologics: Learning from the Product Development and Realization (A-MAb) Case Study and the FDA OBP Pilot Program. BioProcess International 2012; 10:18-29; [Google Scholar]
- 16.Rathore AS, Winkle H. Quality by design for biopharmaceuticals. Nat Biotechnol 2009; 27:26-34; PMID:19131992; http://dx.doi.org/ 10.1038/nbt0109-26 [DOI] [PubMed] [Google Scholar]
- 17.Aggarwal RS. What's fueling the biotech engine-2012 to 2013. Nat Biotechnol 2014; 32:32-9; PMID:24406926; http://dx.doi.org/ 10.1038/nbt.2794 [DOI] [PubMed] [Google Scholar]
- 18.Walsh G. Biopharmaceutical benchmarks 2014. Nat Biotechnol 2014; 32:992-1000; PMID:25299917; http://dx.doi.org/ 10.1038/nbt.3040 [DOI] [PubMed] [Google Scholar]
- 19.Reichert JM. Antibodies to watch in 2014. mAbs 2014; 6:5-14; PMID:24284914; http://dx.doi.org/ 10.4161/mabs.27333 [DOI] [PMC free article] [PubMed] [Google Scholar]
- 20.Valliere-Douglass J, Wallace A, Balland A. Separation of populations of antibody variants by fine tuning of hydrophobic-interaction chromatography operating conditions. J Chromatogr A 2008; 1214:81-9; PMID:19012891; http://dx.doi.org/ 10.1016/j.chroma.2008.10.078 [DOI] [PubMed] [Google Scholar]
- 21.Zhao SS, Chen DD. Applications of capillary electrophoresis in characterizing recombinant protein therapeutics. Electrophoresis 2014; 35:96-108; PMID:24123141; http://dx.doi.org/ 10.1002/elps.201300372 [DOI] [PubMed] [Google Scholar]
- 22.Federici M, Lubiniecki A, Manikwar P, Volkin DB. Analytical lessons learned from selected therapeutic protein drug comparability studies. Biologicals 2013; 41:131-47; PMID:23146362; http://dx.doi.org/ 10.1016/j.biologicals.2012.10.001 [DOI] [PubMed] [Google Scholar]
- 23.Brady LJ, Velayudhan J, Visone DB, Daugherty KC, Bartron JL, Coon M, Cornwall C, Hinckley PJ, Connell-Crowley L. The criticality of high-resolution N-linked carbohydrate assays and detailed characterization of antibody effector function in the context of biosimilar development. mAbs 2015; 7(3):562-70; PMID:25898160; http://dx.doi.org/ 10.1080/19420862.2015.1016692 [DOI] [PMC free article] [PubMed] [Google Scholar]
- 24.Goetze AM, Liu YD, Zhang Z, Shah B, Lee E, Bondarenko PV, Flynn GC. High-mannose glycans on the Fc region of therapeutic IgG antibodies increase serum clearance in humans. Glycobiology 2011; 21:949-59; PMID:21421994; http://dx.doi.org/ 10.1093/glycob/cwr027 [DOI] [PubMed] [Google Scholar]
- 25.Jefferis R. Recombinant antibody therapeutics: the impact of glycosylation on mechanisms of action. Trends Pharmacol Sci 2009; 30:356-62; PMID:19552968; http://dx.doi.org/ 10.1016/j.tips.2009.04.007 [DOI] [PubMed] [Google Scholar]
- 26.Shah B, Jiang XG, Chen L, Zhang Z. LC-MS/MS peptide mapping with automated data processing for routine profiling of N-glycans in immunoglobulins. J Am Soc Mass Spectrom 2014; 25:999-1011; PMID:24664809; http://dx.doi.org/ 10.1007/s13361-014-0858-3 [DOI] [PubMed] [Google Scholar]
- 27.Arora T, Green R, Mercer J, Tsang P, Casais M, Feldman S, Look J, Lubinecky T, Mezzatesta J, Pluschke A, et al.. Quality by design for biotechnology products. Biopharm Int 2009; 22:26–36 [Google Scholar]
- 28.Brady LJ, Scott RA, Balland A. An optimized approach to the rapid assessment and detection of sequence variants in recombinant protein products. Anal Bioanal Chem 2015; 407:3851-60; PMID:25795027; http://dx.doi.org/ 10.1007/s00216-015-8618-1 [DOI] [PubMed] [Google Scholar]
- 29.Zhang Z, Shah B, Bondarenko PV. G/U and certain wobble position mismatches as possible main causes of amino acid misincorporations. Biochemistry 2013; 52:8165-76; PMID:24128183; http://dx.doi.org/ 10.1021/bi401002c [DOI] [PubMed] [Google Scholar]
- 30.Schenauer MR, Flynn GC, Goetze AM. Profiling the effects of process changes on residual host cell proteins in biotherapeutics by mass spectrometry. Biotechnol Prog 2013; 29:951-7; PMID:23696295; http://dx.doi.org/ 10.1002/btpr.1748 [DOI] [PubMed] [Google Scholar]
- 31.Pais DA, Carrondo MJ, Alves PM, Teixeira AP. Towards real-time monitoring of therapeutic protein quality in mammalian cell processes. Curr Opin Biotechnol 2014; 30C:161-7; PMID:25035940; http://dx.doi.org/ 10.1016/j.copbio.2014.06.019 [DOI] [PubMed] [Google Scholar]
- 32.Rathore A, Krull IS, Mendhe R. Analytical Tools for enabling process analytical technology (PAT) applications in biotechnology. LCGC North Am 2012; 30:52-63 [Google Scholar]


