Abstract
Therapeutic antibodies represent one of the fastest growing segments in the pharmaceutical market. They are used in a broad range of disease fields, such as autoimmune diseases, cancer, inflammation and infectious diseases. The growth of the segment has necessitated development of new analytical platforms for faster and better antibody selection and characterization. Early quality control and risk assessment of biophysical parameters help prevent failure in later stages of antibody development, and thus can reduce costs and save time. Critical parameters such as aggregation, conformational stability, colloidal stability and hydrophilicity, are measured during the early phase of antibody generation and guide the selection process of the best lead candidates in terms of technical developability. We report on the use of a novel instrument (ActiPix/Viscosizer) for measuring both the hydrodynamic radius and the absolute viscosity of antibodies based on Taylor dispersion analysis and UV area imaging. The looped microcapillary-based method combines low sample consumption, fast throughput and high precision compared to other conventional methods. From a random panel of 130 antibodies in the early selection process, we identified some with large hydrodynamic radius outside the normal distribution and others with non-Gaussian Taylor dispersion profiles. The antibodies with such abnormal properties were confirmed later in the selection process to show poor developability profiles. Moreover, combining these results with those of the viscosity measurements at high antibody concentrations allows screening, with limited amounts of materials, candidates with potential issues in pre-formulation development.
Keywords: monoclonal antibodies, hydrodynamic radius, viscosity, Taylor dispersion, UV array imaging detection, developability assessment
Abbreviations
- APS
active pixel sensor
- TDA
Taylor dispersion analysis
- CE
capillary electrophoresis
- DLS
dynamic light scattering
- dPBS
Dulbecco phosphate buffered saline
- hIgG
human immunoglobulin G
- mIgG
mouse immunoglobulin G
- mAb
monoclonal antibody
- Fab
fragment antigen-binding
- ID
internal diameter
- OD
outside diameter
- mPa.s
millipascal seconds
- Rh
hydrodynamic radius
- S-DAS
selection developability assessment
- SEC-LC
size-exclusion liquid chromatography
- SF
scaling factor
- STD
standard deviation
- CV
coefficient of variation
Introduction
Therapeutic monoclonal antibodies (mAbs) represent a fast-growing class of therapeutics, with at least 30 antibodies approved in the US and the EU and more pending registration.1 The development of these new biologics requires an effective discovery platform integrating aspects of both biology and developability to identify the best lead candidates for clinical development. Indeed, several important risk factors, such as aggregation, high viscosity, and low stability, need to be addressed during the early phase of antibody generation and guide the selection process of the best lead candidates in terms of technical developability and possible effects on safety and efficacy.2-4 In the early discovery phase, which typically involves evaluation of hundreds of candidates, the major biophysical characteristics usually screened are aggregation propensity and thermostability. At a later stage, other parameters important in formulation, such as viscosity, colloidal stability and self-interactions, are assessed for fewer candidates. New methods using less material and higher throughput have been described recently, allowing these assays to be performed early in the selection phase.5-10 A novel approach for the measurement of the hydrodynamic radius using nanoliters of solution has been described recently based on an instrument combining UV area imaging detection and a microcapillary loop.11-15 Moreover, the same instrumental combination allows measurement of the viscosity of protein solutions in a fast throughput. We report on the Rh and viscosity measurements of a panel of antibodies representative of candidates chosen during the early selection process, and we show the potential of this technique to help identifying mAbs with potential developability issues.
Results
Method validation and reliability of the instrument measurements
Over a 2-year period, the performances of the instrument were closely monitored by repeated injections of a reference mAb, a mouse IgG2a, at the beginning and at the end of each series of measurements. The inter-assay and intra-assay variations were 3.3% and 1.2%, respectively, (100 measurements), indicative of the high precision of the measurements and despite many capillary changes (Table 1). The average life-span of one capillary was between 50 to 200 injections depending on the quality of the samples injected. All measurements were done in triplicates. The reference antibody was stored in phosphate-buffered saline PBS at 4°C at a concentration of 1.5 mg/ml and was routinely monitored for aggregation level by size-exclusion liquid chromatography (SEC-LC) to confirm its purity of more than 98%. The average Rh of this antibody was 5.57 nm.
Table 1.
Performance summary of the reference mouse IgG2a
| Rh (nm) | 5.57 |
| STD (nm) | 0.18 |
| Inter-CV (%) | 3.3 |
| Intra-CV (%) | 1.2 |
| No. of injections | 300 |
| No. of capillary changes | 16 |
The reference mIgG2a at 1.5 mg/mL was injected in triplicates at the beginning and the end of each series of measurements.
Comparison between dynamic light scattering and Taylor dispersion analysis
The Rh of a panel of 27 mAbs was measured by Taylor dispersion analysis (TDA) and compared to that measured by dynamic light scattering (DLS). The amount of soluble aggregates present in the antibody preparation varied between 0.1 and 11.6% as measured by SEC-LC. As shown in Figure 1, there was no significant differences between both methods as confirmed by t-test (P = 0.4). The average Rh measured by TDA was 5.77 nm (STD = 0.28) and by DLS 5.79 nm (STD = 0.39).
Figure 1.
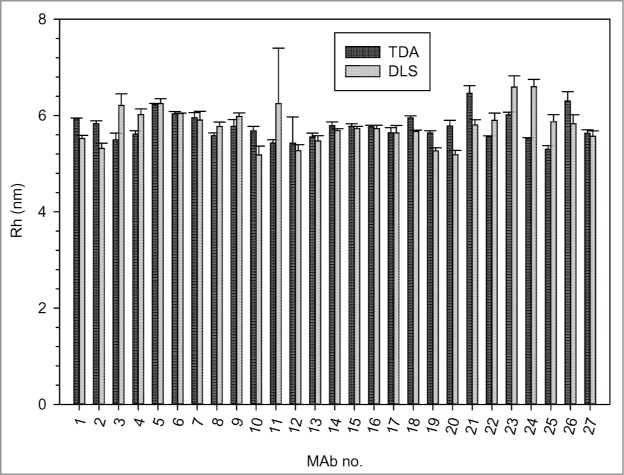
Comparison between the Rh measured by TDA and by DLS of a panel of 27 mAbs.
Correlation between Rh and molecular mass
The Rh of IgGs, antibody fragments and a tetravalent bispecific IgG-like molecule16 were measured by TDA and the results plotted against their molecular masses measured by mass spectrometry. As shown in Figure 2, there was a good linear correlation between both measurements. No significant differences were found between mAbs from mouse or human origin, or between aglycosylated and wild type hIgG1. Moreover, accurate Rh measurements down to 0.2 nm were obtained by TDA using small peptides (results not shown).
Figure 2.
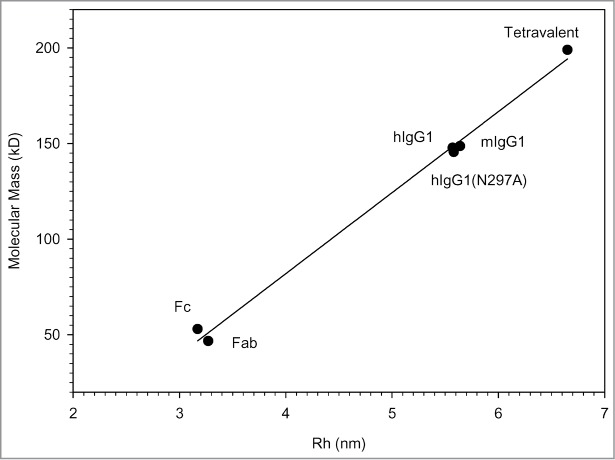
Linear correlation between the Rh measured by TDA and the molecular mass measured by mass spectrometry (r2 = 0.99).
Rh distribution of a random panel of mAbs
We measured the Rh of a random panel of 130 mAbs formulated in PBS buffer at low protein concentration (1.5 mg/ml) to minimize any viscosity effect, but keep a good UV signal-to-noise ratio. The panel contained 106 human mAbs generated by phage display technology17 and 24 mouse mAbs derived from hybridoma cells. The Rh of 20 mAbs (15%) could not be determined by TDA due to the poor fitting of the UV peaks. Indeed, the UV chromatograms showed significant peak tailing, precluding any fit to a Gaussian curve (Fig. S1). These antibodies had low amounts of aggregates (<10%) as evidenced by SEC-LC, ruling out that aggregation precluded the peak fitting. DLS analysis showed that most Rh values were in the normal range, but some with high polydispersity (Table S1). However, 16 of 20 showed strong peak tailing, when run on the SEC-LC, indicative of interactions with the media of the column and also very likely with the capillary wall. These interactions could not be reversed by changing the buffer composition or the pH. Moreover, dynamic coating of the capillary using Tween-20 (0.01- 0.1%), BSA (up to 0.01 mg/ml) or SDS (0.01–0.3 mM) showed no improvements. The histogram distribution and scatter plot analysis of the Rh of the remaining 110 mAbs are shown in Figure 3. The average Rh was 5.77 nm (STD = 0.49). The normality test for the whole antibody population failed (P < 0.001) due to a few outliers with an Rh above 6.3 nm. One of them with the Rh of 9.1 nm was shown to be a stable dimer by SEC-MALS analysis.
Figure 3.
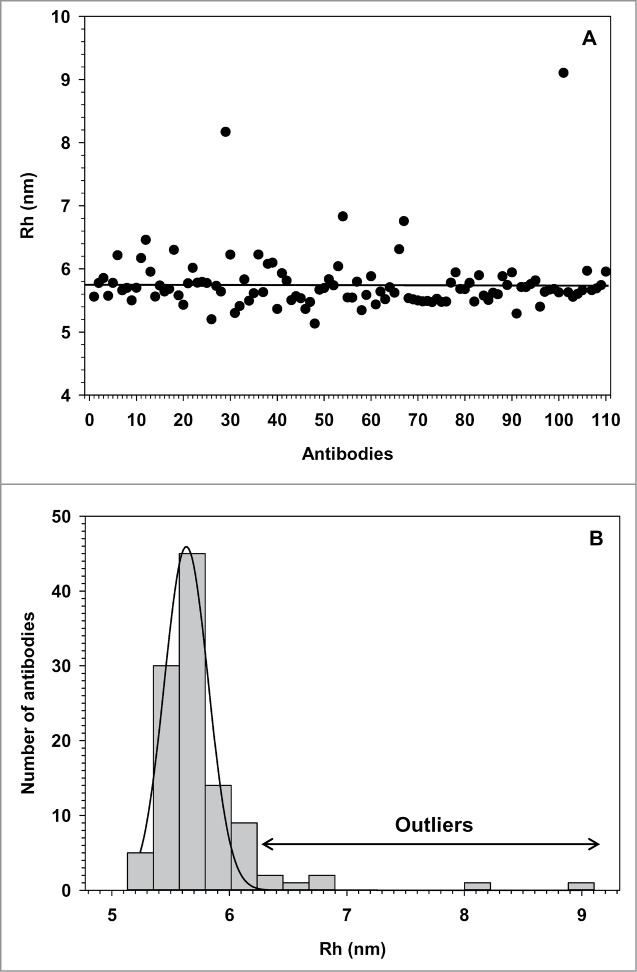
Rh distribution of a random panel of 110 mAbs. (A) Scatter plot representation of the Rh vs. mAb. The black line corresponds to the average Rh of 5.77 nm. (B) Frequency histogram of the Rh measured at 1.5 mg/ml in PBS. The black line represents the normality fitting.
Viscosity distribution
The loop capillary with dual windows combined with the high sensitivity of the array detector allows the precise measurement of the specific and absolute viscosity of the protein solutions. The inter-assay variation measured with our reference antibody at 1.5 mg/ml was 3.1% (n = 23). The viscosity distribution of the same panel of antibodies at low concentration in PBS is shown in Figure 4. The average viscosity was 0.93 mPa.s (STD = 0.046), compared to the viscosity of 0.9 mPa.s for the PBS buffer at 25°C. Three mAbs showed a viscosity more than 2 STD above the average. The scatter plot of the viscosity versus Rh values for each MAbs shows clearly the few outliers with either higher viscosity or Rh. The Rh of the mAbs described above were re-calculated using the measured viscosity instead of that of the vehicle, and 4 out of the 7 outliers had an Rh in the normal range.
Figure 4.
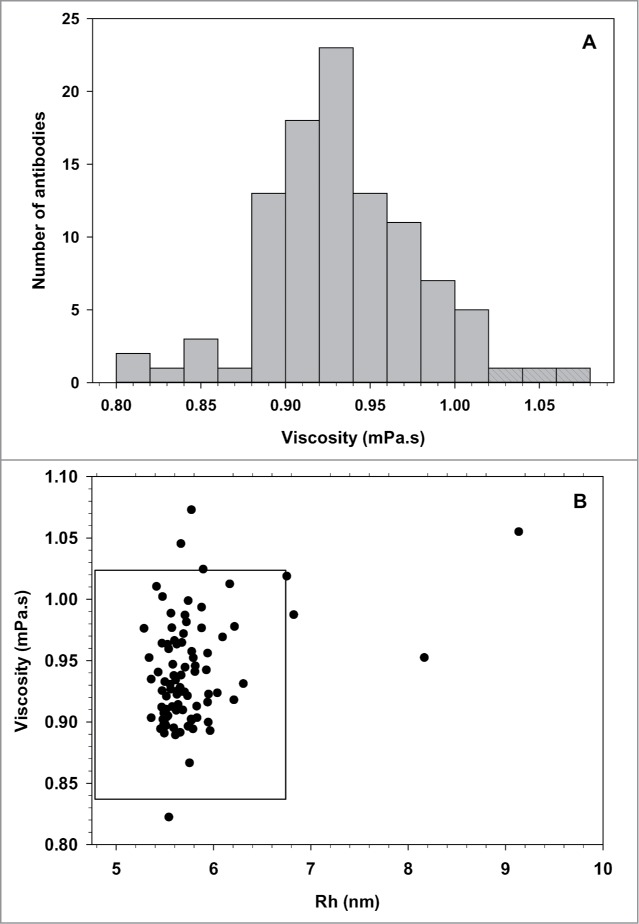
Viscosity distribution of a random panel of 100 mAbs. (A) Frequency histogram of the absolute viscosity ( measured at 1.5 mg/ml in PBS at 25°C. Shaded bars represent mAbs with a viscosity above the average +2 STD. (B) Scatter plot representation of the viscosity versus Rh. MAbs outside the black box have values 2 STD beyond the average viscosity (0.93 mPa.s) or average Rh (5.77 nm).
Viscosity measurement and antibody concentration
Figure 5 shows the viscosity measured in function of antibody concentration for 5 antibodies with known viscosity measured by rheometry. At higher concentrations, the viscosity increases exponentially. The 2 MAbs with high viscosity can be already sorted out from those with lower viscosity at concentration as low as 25 mg/ml (Fig. 5 insert), allowing the selection of the best candidates with a low amount of material.
Figure 5.
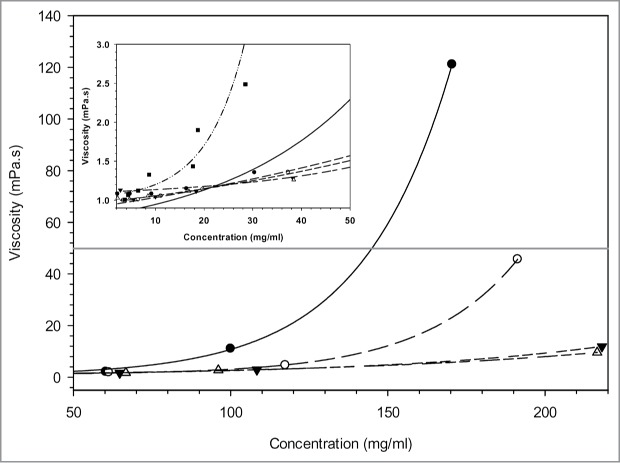
The viscosity profiles of 5 mAb solutions were determined at different protein concentrations. The black line represents the 50 mPa.s empirical threshold for subcutaneous injection.
Discussion
The unique combination of UV area imaging and Taylor dispersion analysis in a microcapillary loop allows accurate measurements of the hydrodynamic radius of proteins with very low sample volumes. The method was originally based on a manual injection device and was replaced later by an automated system, coupling the autosampler of a CE instrument to the UV array detector as described by Chapman and Goodall.11 Additional studies showed that the TDA-based method allows the accurate determination of the Rh of proteins subjected to various stress conditions such as thermal challenge, but also the evaluation of detailed process-related batch-to-batch variability.12-15 By comparing TDA with DLS, Hawe et al.12 showed that TDA allows the accurate determination of the hydrodynamic radius of peptides and proteins over a wide concentration range, with little interference from excipients present in the sample.
By performing multiple injections of a reference antibody, we confirmed the high precision of the Rh measurements and the advantage of UV area imaging compared to light scattering-based methods, the former being less prone to buffer interferences. The average Rh of a panel of monomeric IgG molecules measured by TDA correlated well with that obtained by DLS and to those previously published for human IgGs using photon correlation spectroscopy.18-19 Moreover we showed a linear correlation between the Rh of various antibody formats and fragments. On the other hand, we could not confirm any significant differences between the Rh of N-glycosylated and several aglycosylated mAbs carrying the Asn297 → Ala mutation, as shown previously by SEC analysis on deglycosylated antibodies.20 Likewise, there were no differences observed between the Rh of mouse and human IgGs. From a panel of 110 mAbs, only 7 showed an Rh outside the normal distribution. However, when taking in account the absolute viscosity of the antibody solution instead of that of water, we found that 4 of them had their Rh back into the normal range, leaving only 3 antibodies with confirmed higher Rh, pinpointing the importance of including the absolute viscosity measurement in the Rh calculation. Whether the larger Rh measured for the 3 mAbs is due to expanded conformation would need further investigation. The 15% of antibodies showing abnormal TDA with poor data fitting also showed other developability issues, such as strong interaction with the column media during SEC-LC that resulted in peak tailing. They were all discarded at some stage of the preclinical selection process, suggesting that TDA measurement is a good indicator of potential problematic antibodies, using a very limited amount of material.
The same instrument was used to measure the specific and absolute viscosity of the mAb panel. In comparison to other CE-based methods measuring viscosity,21-22 the dual capillary window combined with the APS detector gave high precision measurements of t0 and thus of Δt, providing accurate viscosity measurements. Despite the low concentration of the antibody solutions, some differences in viscosities were observed and influenced the Rh calculation by TDA. At higher antibody concentrations, viscosity increases exponentially as a result of the increase of protein-protein interactions, which have been shown to be dependent on the nature of the antibody.23-30 For some therapeutic candidates, this will lead to serious issues, when formulating them for subcutaneous injection at concentration above 100 mg/ml. Indeed, an antibody solution with a viscosity above 50 mPa.s is usually considered unsuitable for injection and requires extensive formulation studies, including the use of various additives to lower the viscosity.31 Moreover, optimal injection conditions, in terms of injection force, flow rate and needle characteristics tend to call for even lower viscosity thresholds of around 15 mPa.s.32 Based on our results, the lowest antibody concentration to perform predictive formulation analysis using the Viscosizer would be 25 mg/ml, considerably reducing the amount of material needed for such studies. Taken together, our results show that the ActiPic/Viscosizer system represents a valuable and complementary method to identify early candidates with potential developability issues.
Materials & Methods
The dPBS pH 7.3 was purchased from Lonza (BE17-512Q), L-Tyrosine from Merck (K35116671 610), the fused-silica capillaries from Biotaq Inc. (BT075365). All mAbs and derivatives were prepared in our internal antibody production facility by transient expression in mammalian HEK-293 cells and purified by standard Protein-A affinity chromatography. They were tested under comparable buffer and concentrations conditions, namely in dPBS pH 7.3 at 1.5 mg/ml. The antibody concentration was measured by UV absorbance at 280 nm using a nanodrop device and the mAb specific extinction coefficient. L-Tyrosine solution was prepared in dPBS to a final concentration of 0.025 mg/ml.
Rh measurement by Taylor dispersion analysis
TDA was performed on the ActiPix D100 nano-sizing system originally developed by Paraytec Ltd, and now licensed to Malvern Instruments (Viscosizer 200). The sample (63.3 nl) at a concentration of 1.5 mg/ml is injected by application of a pressure (140 mBar) into fused silica capillary (ID:OD dimensions of 75:360 μm) under a linear flow of buffer (2.4 mm/s) and controlled temperature set at 25°C using a CE injection system (Prince Technologies). The sample is detected twice along the loop forming capillary passing through the UV area imaging detector as described previously.11
UV absorbance of the protein is recorded during the first and second passages through the APS detector, giving 2 peaks. As a sample plug travels along a capillary, the peak begins to broaden along the flow direction due to the Taylor dispersion and counteracted by transverse diffusion. The analysis of peak broadening was done using the Actipix D100 software (version 1.5). A Gaussian fit was applied to the 2 UV peaks and only fits with a R2 > 0.999 were considered for the Rh calculation. The analysis of band broadening allows the calculation of the average hydrodynamic radius (Rh) by the equation:
kB is the Boltzmann constant, T, the temperature (Kelvin), η, the absolute viscosity of the solution, r, the capillary radius, τ2, the variance and t, the center point of the peak (Fig. 6). The detector head is placed inside the CE, for controlled temperature. The viscosity of water was used for the measurement (ηH2O = 0.89 mPa.s), assuming that the low concentration of the antibody brings no additional viscosity effect. The capillary was cleaned between samples by injecting 0.5 M of sodium hydroxide during 5 min at a linear flow rate of 34.1 mm/s, and re-equilibrated in dPBS buffer during 15 min at the same flow rate. UV absorbance was measured at 214 nm. The analysis time was approximately 11 min per injection. Each sample was measured in triplicates.
Figure 6.
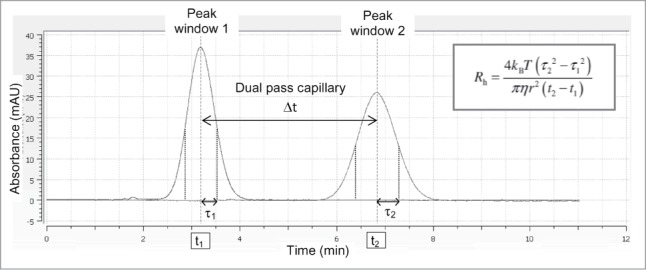
Rh determination of proteins by the ActiPix/Viscosizer system. The protein sample is injected into a capillary loop at a constant pressure. UV absorbance at 214 nm is recorded during the first and second passages through the APS detector, respectively. The analysis of peak broadening, time (t) and diffusion (τ), due to Taylor dispersion allows the calculation of the Rh.
Viscosity measurement
According to Poiseuille's law, the flow rate of a fluid through a capillary under constant pressure is related to the capillary length, internal diameter and the viscosity. Using the ActiPix/Viscosizer system under constant temperature (25°C) and pressure (2500 mBa), the specific viscosity of a sample can be determined from a simple Δt measurement, the time needed by the sample to pass from window one to window 2. The specific viscosity ηsp can be calculated by the equation:
Where and , are the times needed by the marker and the sample to pass from window 1 to window 2, respectively, and SF is the scaling factor.
The total capillary length was 130 cm (L), the length to the first window being 40 cm (l1) and that of the second window being 84.7 cm (l2). The is measured by a 2 min injection of a tyrosine solution at a concentration of 0.025 mg/ml. At this low concentration, the viscosity of the tyrosine corresponds to the viscosity of the buffer itself (ηdPBS pH7.3, 25°C = 0.9 mPa.s) and represents the shortest time to go from the first to the second window. The capillary is then re-equilibrated by injection of dPBS at pH7.3 for 2 min. The is finally measured by injection of the sample at the 1.5 mg/ml concentration into the capillary at a constant pressure during 2 min (Fig. 7). Finally, between each sample, a cleaning of the capillary is done by injecting dPBS buffer during 4 min followed by 0.5 M sodium hydroxide during 2 min and re-equilibration in dPBS buffer during 8 min at the same flow rate. The entire procedure (equilibration, viscosity measurement, cleaning) takes around 20 min at a flow rate of 42.6 mm/s.
Figure 7.
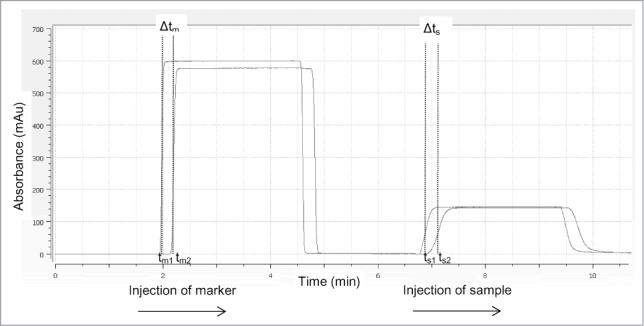
Protein viscosity measured by the ActiPix/Viscosizer system. Example of a UV chromatogram during viscosity measurement. A dilute solution of the tyrosine marker is continuously injected into the pre equilibrated capillary for 2 min. The Δtm (tm2-tm1) is determined by passage through the dual window of the APS detector. The capillary is then re-equilibrated and the Δts (ts2 –ts1) is measured by injection of the protein sample into the capillary.
Rh determination with absolute viscosity correction
From the specific viscosity (ηsp), the relative viscosity (ηr) can be retrieved. Knowing the viscosity of the buffer (η0,dPBS pH7.3 = 0.9 mPa.s) allows the determination of the absolute viscosity of the sample (ηc).
As the viscosity is an important parameter in the Rh measurement, the Rh obtained above can be corrected with the newly calculated viscosity (ηc).
Rh measurement by DLS
DLS was measured with an Avid Nano's W130i system using quartz ultra-micro cuvettes. Antibodies were diluted in dPBS buffer (η25°C: 0.906 mPA.s) to a final concentration of 1.5 mg/ml. Light scattering was detected at 660 nm with a fixed detection angle of 90° and data were collected in automatic mode at 25°C using a solvent refractive index of 1.333. A correlation function was done from the average of 10 measurements. The mean Rh was determined using i-Size Software (Version 3.0). DLS of each antibody was measured at least 3 times. DLS measurements showing a polydispersity >30% were considered as not reliable.
Aggregation measurement by SEC-LC
The aggregation level of all mAbs analyzed by TDA was measured by SEC-LC on an Agilent 1290 Infinity system equipped with a Superdex 200, 10/300 SEC column (GE Healthcare 17–5175–01). The sample (50 μl) was loaded on the column equilibrated with dPBS at pH 7.3. The flow rate was 0.5 ml/min and the protein absorbance was measured at 230 nm. The percentage of aggregates was calculated from the peak area at different retention times. A comparable SEC column coupled to a multi-angle light scattering detector (MALS) was used to confirm the nature of the soluble aggregates.
Mass determination by mass spectrometry
Intact masses of antibodies and related molecules were determined by liquid chromatography-mass spectrometry using a Waters Acquity UPLC system coupled to a Waters Q-TOF Premier Mass Spectrometer. Around 5 μg of antibody was injected at a flow rate of 0.4 ml/min onto a MassPrep micro-desalting cartridge (Waters, 186002785) heated at 80°C, and eluted with a water/acetonitrile gradient (2–90%) containing 0.1% formic acid.
Disclosure of Potential Conflicts of Interest
AL and JMS are employees of Novartis Pharma AG.
Acknowledgments
We thank Xavier Leber and Brendan Kerins for technical help, Jocelyne Fiaux for the concentrated antibody solutions and helpful discussions, Patrick Schindler for the mass spectrometry analysis, and Thomas Pietzonka for his support throughout this work. Our special thanks go to Alex Chapman from Paraytec Ltd for introducing us to the ActiPix D100- nanosizing instrument, François Maystre from Instrumat AG, and Andrew Jones and Mike Williams from Malvern for sharing their technical expertise in the viscosity measurements.
Supplemental Material
Supplemental data for this article can be accessed on the publisher's website.
Author Contributions
JMS and AL designed research; AL performed experiments; JMS and AL analyzed data and wrote the manuscript.
References
- 1. Reichert JM. Antibodies to watch in 2014. MAbs 2014; 6:5-14; PMID:24284914; http://dx.doi.org/ 10.4161/mabs.27333 [DOI] [PMC free article] [PubMed] [Google Scholar]
- 2. Yang X, Xu W, Dukleska S, Benchaar S, Mengisen S, Antochshuk V, Cheung J, Mann L, Babadjanova Z, Rowand J, et al. . Developability studies before initiation of process development: improving manufacturability of monoclonal antibodies. MAbs 2013; 5:787-94; PMID:23883920; http://dx.doi.org/ 10.4161/mabs.25269 [DOI] [PMC free article] [PubMed] [Google Scholar]
- 3. Razinkov V, Treuheit MJ, Becker GW. Methods of high throughput biophysical characterization in biopharmaceutical development. Curr Drug Discov Technol 2013; 10:59-70; PMID:22725690 [DOI] [PubMed] [Google Scholar]
- 4. Eon-Duval A, Broly H, Gleixner R. Quality attributes of recombinant therapeutic proteins: an assessment of impact on safety and efficacy as part of a quality by design development approach. Biotechnol Prog 2012; 28:608-22; PMID:22473974; http://dx.doi.org/ 10.1002/btpr.1548 [DOI] [PubMed] [Google Scholar]
- 5. He F, Woods CE, Becker GW, Narhi LO, Razinkov V. High-throughput assessment of thermal and colloidal stability parameters for monoclonal antibody formulations. J Pharm Sci 2011; 100:5126-41; PMID:21789772; http://dx.doi.org/ 10.1002/jps.22712 [DOI] [PubMed] [Google Scholar]
- 6. He F, Becker GW, Litowski JR, Narhi LO, Brems DN, Razinkov V. High-throughput dynamic light scattering method for measuring viscosity of concentrated protein solutions. Anal Biochem 2010; 399:141-3; PMID:19995543; http://dx.doi.org/ 10.1016/j.ab.2009.12.003 [DOI] [PubMed] [Google Scholar]
- 7. Liu Y, Caffry I, Wu J, Geng SB, Jain T, Sun T, Reid F, Cao Y, Estep P, Yu Y, et al. . High-throughput screening for developability during early-stage antibody discovery using self-interaction nanoparticle spectroscopy. MAbs 2014; 6:483-92; PMID:24492294; http://dx.doi.org/ 10.4161/mabs.27431 [DOI] [PMC free article] [PubMed] [Google Scholar]
- 8. Sule SV, Dickinson CD, Lu J, Chow CK, Tessier PM. Rapid analysis of antibody self-association in complex mixtures using immunogold conjugates. Mol Pharm 2013; 10:1322-31; PMID:23383873; http://dx.doi.org/ 10.1021/mp300524x [DOI] [PubMed] [Google Scholar]
- 9. Sule SV, Sukumar M, Weiss WF, Marcelino-Cruz AM, Sample T, Tessier PM. High-throughput analysis of concentration-dependent antibody self-association. Biophys J 2011; 101:1749-57; PMID:21961601; http://dx.doi.org/ 10.1016/j.bpj.2011.08.036 [DOI] [PMC free article] [PubMed] [Google Scholar]
- 10. Sun T, Reid F, Liu Y, Cao Y, Estep P, Nauman C, Xu Y. High throughput detection of antibody self-interaction by bio-layer interferometry. MAbs 2013; 5: 838-41; PMID:23995620; http://dx.doi.org/ 10.4161/mabs.26186 [DOI] [PMC free article] [PubMed] [Google Scholar]
- 11. Chapman AJS, Goodall DM. A novel approach to measurement of hydrodynamic radius for a standard protein using UV area imaging detection. Chromatogr Today 2008; 1: 22-4; [Google Scholar]
- 12. Hawe A, Hulse WL, Jiskoot W, Forbes RT. Taylor dispersion analysis compared to dynamic light scattering for the size analysis of therapeutic peptides and proteins and their aggregates. Pharm Res 2011; 28:2302-10; PMID:21560019; http://dx.doi.org/ 10.1007/s11095-011-0460-3 [DOI] [PMC free article] [PubMed] [Google Scholar]
- 13. Hulse WL, Forbes RT. A nanolitre method to determine the hydrodynamic radius of proteins and small molecules by Taylor dispersion analysis. Int J Pharm 2011; 411:64-8; PMID:21440611; http://dx.doi.org/ 10.1016/j.ijpharm.2011.03.040 [DOI] [PubMed] [Google Scholar]
- 14. Hulse W, Forbes RT. A Taylor dispersion analysis method for the sizing of therapeutic proteins and their aggregates using nanolitre sample quantities. Int J Pharm 2011; 416:394-7; PMID:21745555; http://dx.doi.org/ 10.1016/j.ijpharm.2011.06.045 [DOI] [PubMed] [Google Scholar]
- 15. Hulse WL, Gray J, Forbes RT. Evaluating the inter and intra batch variability of protein aggregation behaviour using Taylor dispersion analysis and dynamic light scattering. Int J Pharm 2013; 453:351-7; PMID:23751342; http://dx.doi.org/ 10.1016/j.ijpharm.2013.05.062 [DOI] [PubMed] [Google Scholar]
- 16. Lu D, Zhu Z. Construction and production of an IgG-like tetravalent bispecific antibody for enhanced therapeutic efficacy. Methods Mol Biol 2009; 525:377-404; PMID:19252849; http://dx.doi.org/ 10.1007/978-1-59745-554-1_20 [DOI] [PubMed] [Google Scholar]
- 17. Ponsel D, Neugebauer J, Ladetzki-Baehs K, Tissot K. High affinity, developability and functional size: the holy grail of combinatorial antibody library generation. Molecules 2011; 16: 3675-700; PMID:21540796; http://dx.doi.org/ 10.3390/molecules16053675 [DOI] [PMC free article] [PubMed] [Google Scholar]
- 18. Jøssang T, Feder J, Rosenqvist E. Photon correlation spectroscopy of human IgG. J Protein Chem 1988; 7:165-71; PMID:3255367; http://dx.doi.org/ 10.1007/BF01025246 [DOI] [PubMed] [Google Scholar]
- 19. Gun’ko VM, Klyueva AV, Levchuk YN, Lebodac R. Photon correlation spectroscopy investigations of proteins. Adv Colloid Interface Sci 2003; 105: 201-328; PMID:12969646; http://dx.doi.org/ 10.1016/S0001-8686(03)00091-5 [DOI] [PubMed] [Google Scholar]
- 20. Zheng K, Bantog C, Bayer R. The impact of glycosylation on monoclonal antibody conformation and stability. MAbs 2011; 3:568-76; PMID:22123061; http://dx.doi.org/ 10.4161/mabs.3.6.17922 [DOI] [PMC free article] [PubMed] [Google Scholar]
- 21. Michael S., Bello MS, Rezzonico R, Righetti PG. Capillary electrophoresis instrumentation as a bench-top viscometer. J Chromatogr A 1994; 659: 199-204 [Google Scholar]
- 22. Allmendinger A, Dieu LH, Fischer S, Mueller R, Mahler HC, Huwyler J. High-throughput viscosity measurement using capillary electrophoresis instrumentation and its application to protein formulation. J Pharm Biomed Anal 2014; 99:51-58; PMID:25077704; http://dx.doi.org/ 10.1016/j.jpba.2014.07.005 [DOI] [PubMed] [Google Scholar]
- 23. Saluja A, Kalonia DS. Nature and consequences of protein-protein interactions in high protein concentration solutions. Int J Pharm 2008; 358:1-15; PMID:18485634; http://dx.doi.org/ 10.1016/j.ijpharm.2008.03.041 [DOI] [PubMed] [Google Scholar]
- 24. Yadav S, Laue TM, Kalonia DS, Singh SN, Shire SJ. The influence of charge distribution on self-association and viscosity behavior of monoclonal antibody solutions. Mol Pharm 2012; 9:791-802; PMID:22352470; http://dx.doi.org/ 10.1021/mp200566k [DOI] [PubMed] [Google Scholar]
- 25. Shire SJ, Shahrokh Z, Liu J. Challenges in the development of high protein concentration formulations. J Pharm Sci 2004; 93:1390-402; PMID:15124199; http://dx.doi.org/ 10.1002/jps.20079 [DOI] [PubMed] [Google Scholar]
- 26. Kanai S, Liu J, Patapoff TW, Shire SJ. Reversible self-association of a concentrated monoclonal antibody solution mediated by Fab-Fab interaction that impacts solution viscosity. J Pharm Sci 2008; 97:4219-27; PMID:18240303; http://dx.doi.org/ 10.1002/jps.21322 [DOI] [PubMed] [Google Scholar]
- 27. Singh SN, Yadav S, Shire SJ, Kalonia DS. (2014) Dipole-dipole interaction in antibody solutions: correlation with viscosity behavior at high concentration. Pharm Res. 2014; PMID:24639233; http://dx.doi.org/ 10.1007/s11095-014-1352-0 [DOI] [PubMed] [Google Scholar]
- 28. Schmit JD, He F, Mishra S, Ketchem RR, Woods CE, Kerwin BA. Entanglement model of antibody viscosity. J Phys Chem B 2014; 118:5044-9; PMID:24758234; http://dx.doi.org/ 10.1021/jp5081115 [DOI] [PubMed] [Google Scholar]
- 29. Connolly BD, Petry C, Yadav S, Demeule B, Ciaccio N, Moore JM, Shire SJ, Gokarn YR. Weak interactions govern the viscosity of concentrated antibody solutions: high-throughput analysis using the diffusion interaction parameter. Biophys J 2012; 103:69-78; PMID:22828333; http://dx.doi.org/ 10.1016/j.bpj.2012.04.047 [DOI] [PMC free article] [PubMed] [Google Scholar]
- 30. Li L, Kumar S, Buck PM, Burns C, Lavoie J, Singh SK, Warne NW, Nichols P, Luksha N, Boardman D. Concentration dependent viscosity of monoclonal antibody solutions: explaining experimental behavior in terms of molecular properties. Pharm Res 2014; 31:3161-78; PMID:24906598; http://dx.doi.org/ 10.1007/s11095-014-1409-0 [DOI] [PubMed] [Google Scholar]
- 31. Du W, Klibanov AM. Hydrophobic salts markedly diminish viscosity of concentrated protein solutions. Biotechnol Bioeng 2011; 108:632-6; PMID:21246510; http://dx.doi.org/ 10.1002/bit.22983 [DOI] [PubMed] [Google Scholar]
- 32. Burckbuchler V, Mekhloufi G, Giteau AP, Grossiord JL, Huille S, Agnely F. Rheological and syringeability properties of highly concentrated human polyclonal immunoglobulin solutions. Eur J Pharm Biopharm 2010; 76:351-6; PMID:20719247; http://dx.doi.org/ 10.1016/j.ejpb.2010.08.002 [DOI] [PubMed] [Google Scholar]
Associated Data
This section collects any data citations, data availability statements, or supplementary materials included in this article.


