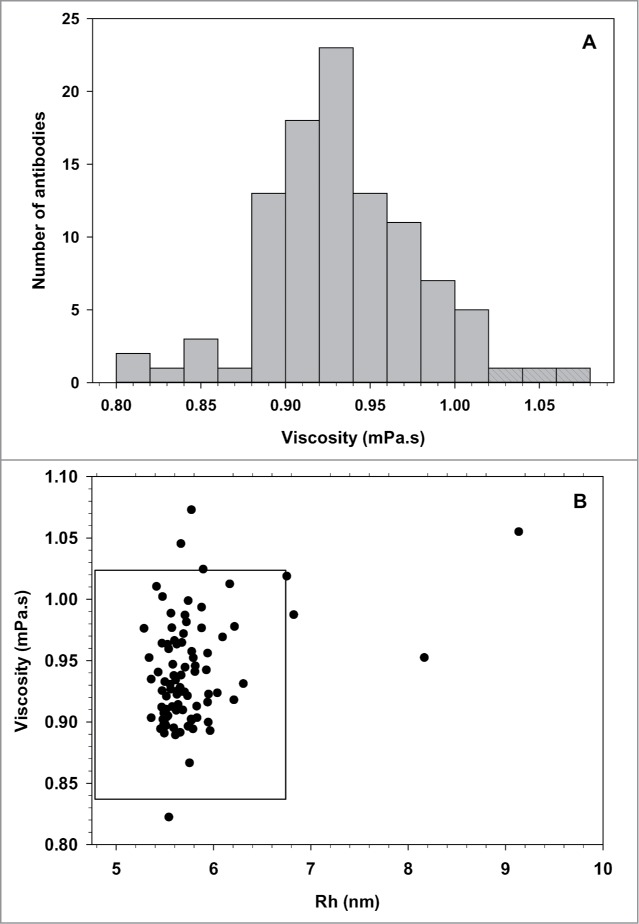
Figure 4.

Viscosity distribution of a random panel of 100 mAbs. (A) Frequency histogram of the absolute viscosity ( measured at 1.5 mg/ml in PBS at 25°C. Shaded bars represent mAbs with a viscosity above the average +2 STD. (B) Scatter plot representation of the viscosity versus Rh. MAbs outside the black box have values 2 STD beyond the average viscosity (0.93 mPa.s) or average Rh (5.77 nm).
