

Abstract
Objectives:
The changes in patient-reported measures of obstructive sleep apnea (OSA) burden are largely discordant with the change in apnea-hypopnea index (AHI) and other polysomnography measures before and after treatment. For patients treated with continuous positive airway pressure (CPAP), some investigators have theorized that this discordance is due in part to the variability in CPAP use. We aim to test the hypothesis that patient-reported outcomes of CPAP treatment have stronger correlations with AHI when it is corrected for mean nightly CPAP use.
Methods:
This was a cross-sectional study of 459 adults treated with CPAP for OSA. Five patient-reported measures of OSA burden were collected at baseline and after 6 months of CPAP therapy. The correlations between the change in each patient-reported measure and the change in AHI as well as mean nightly AHI (corrected for CPAP use with a weighted average formula) were measured after 6 months of treatment. The same analysis was repeated for 4 additional polysomnography measures, including apnea index, arousal index, lowest oxyhemoglobin saturation, and desaturation index.
Results:
The change in AHI was weakly but significantly correlated with change in 2 of the 5 clinical measures. The change in mean nightly AHI demonstrated statistically significant correlations with 4 out of 5 clinical measures, though each with coefficients less than 0.3. Similar results were seen for apnea index, arousal index, lowest oxyhemoglobin saturation, and desaturation index.
Conclusions:
Correction for CPAP use yielded overall small but significant improvements in the correlations between patient-reported measures of sleep apnea burden and polysomnography measures after 6 months of treatment.
Citation:
Kirkham EM, Heckbert SR, Weaver EM. Relationship between clinical and polysomnography measures corrected for CPAP use. J Clin Sleep Med 2015;11(11):1305–1312.
Keywords: sleep apnea, apnea-hypopnea index, symptom, sleepiness, quality of life, CPAP, outcome
The changes in patient-reported measures of the clinical burden of obstructive sleep apnea (OSA) before and after treatment are largely discordant with apnea-hypopnea index (AHI) before and after treatment.1–3 Some investigators have theorized that the discordance between AHI and patient-reported measures is due in part to the variability in CPAP use. CPAP use has a documented dose-response effect on patient-reported outcome measures.4,5 For example, those who use their CPAP less than 4 hours per night do not have an appreciable change in daytime sleepiness as measured by the Epworth Sleepiness Scale; however, those who use their CPAP more than 5 hours per night do report significant improvement in sleepiness symptoms.4,5
To address this discordance in CPAP-treated patients, some researchers have suggested formulas for calculating a mean nightly AHI weighted by the proportion of sleep time that the CPAP is used.6,7 For example, if a patient who sleeps 8 hours per night has an improvement in AHI from 25/h to 5/h on CPAP and uses CPAP 4 hours per night on 5 nights per week (and none on 2 nights per week), then after applying the weighted average formula, the mean nightly AHI would be 18/h. This mean nightly AHI incorporates untreated and partially treated sleep time not reflected in the in-laboratory AHI while CPAP is on.
BRIEF SUMMARY
Current Knowledge/Study Rationale: For patients treated with continuous positive airway pressure (CPAP), some investigators have theorized that the discordance between patient-centered outcomes and polysomnography outcomes are due in part to the variability in CPAP use. We aim to test the hypothesis that patient-reported outcomes of CPAP treatment have stronger correlations with AHI when it is corrected for mean nightly CPAP use.
Study Impact: While the correlations between polysomnography measures and patient-reported outcomes improve after correcting AHI for CPAP use, the correlations remain weak. The use of weighted average formulas strengthen AHI as a surrogate measure and should be used whenever measuring AHI outcomes with CPAP, but patient-centered outcomes such as symptoms and quality of life should also be measured directly.
This study aimed to test whether the changes in five patient-reported outcome measures after six months of CPAP treatment correlated better with the improvement in AHI on CPAP when it was corrected for the amount of time the CPAP was used than with the improvement in AHI on CPAP without correction for CPAP use. We hypothesized that there would be a weak correlation (< 0.3) between the change in each of the patient-reported outcome measures and the change in AHI on CPAP treatment. We hypothesized that the change in each of the patient-reported outcome measures would have a significantly stronger correlation with the change in mean nightly AHI on CPAP treatment.
METHODS
Study Design
This was an observational cross-sectional study of adult participants recruited between July 2004 and October 2008 to the Seattle Sleep Cohort at the University of Washington Sleep Center at Harborview Medical Center, Seattle, Washington.
Subjects
Subjects included all patients aged 18 years or older who presented to the sleep laboratory for overnight polysomnography for suspected OSA, had the linguistic and cognitive ability to answer questionnaires, consented to participate, completed both baseline and titration polysomnography, were prescribed CPAP at a titrated pressure (i.e., successful titration) and followed up after 6 months of CPAP treatment with CPAP data recorded. Subjects were treated for OSA and any concurrent sleep disorders by sleep medicine providers in the sleep center during the follow up period per their usual care. Some patients were managed with adjustment of CPAP levels and settings per the clinical judgment of the providers to optimize OSA treatment during the follow up period. Subjects were excluded for prior diagnosis of OSA, worse AHI on CPAP (e.g., CPAP-induced central apnea), other upper airway obstructive disease, or neurologic, neuromuscular, or pulmonary disease. Patients with either full-night or split-night polysomnography were included in the study. The University of Washington institutional review board approved this study.
Data Collection
Baseline data were collected in person in the sleep laboratory on the night of the first diagnostic polysomnography, and follow-up data were collected in person in the Sleep Disorders Clinic or by mail at 6 months. Consenting participants were administered the Epworth Sleepiness Scale, Sleep Apnea Quality of Life Index, Pittsburgh Sleep Quality Index, and the Short Form–36 (SF-36) by trained research assistants in a standardized fashion. The Epworth Sleepiness Scale is an 8-question measure of daytime sleep propensity widely used in the clinical setting.8 It is scored from 0 to 24, with a higher score indicating worse daytime sleep propensity. The Sleep Apnea Quality of Life Index is an OSA-specific quality of life index with a total score from 1 (poor quality of life) to 7 (excellent quality of life),9 and it takes into account adverse effects of treatment. The Pittsburgh Sleep Quality Index is a sleep-specific quality of life index scored on 0 to 21 scale, with a score ≥ 5 indicating a “poor” sleeper.10 The SF-36 is a generic health status instrument with 2 mutually exclusive component summary scores, Physical Health and Mental Health. Each component score is calculated from normalized aggregate scores, where 50 ± 10 represents the normalized score and standard deviation of the general U.S. 1998 population norms11–13; a lower score indicates worse health status than the 1998 norms. Patients also completed a demographic questionnaire at baseline. Body mass index (BMI) was calculated from height and weight measurements made on the night of the diagnostic polysomnography and at follow-up.
All patients underwent overnight, monitored, in-laboratory polysomnography, from which AHI, apnea index, oxyhemoglobin desaturation index, arousal index, and the lowest oxy-hemoglobin saturation were extracted. All polysomnography tests included recordings of sleep state parameters (4-lead electroencephalogram, bilateral electro-oculogram, and submental and bilateral leg electromyogram), breathing (nasal pressure transducer and oronasal thermistor, as well as thoracic and abdominal excursion by strain gauge), pulse oximetry, electrocardiogram, and infrared video. All studies were manually scored in standard fashion by trained technicians and confirmed by board-certified sleep physicians. Apnea was defined as an 80% to 100% reduction in airflow lasting ≥ 10 seconds. Hypopnea was defined as a 30% to 80% reduction in airflow lasting ≥ 10 seconds. The definition of a hypopnea changed following the publication of the 2007 American Academy of Sleep Medicine (AASM) guidelines. The alternative definition of hypopnea (30% to 90% reduction in airflow lasting ≥ 10 sec, associated with an arterial desaturation ≥ 3% from baseline or a cortical arousal) was implemented at the University of Washington sleep lab in January of 2008. Since this change occurred near the end of data collection for this study, we included those who had polysomnography prior to January 1, 2008 in the primary analysis, and conducted a separate analysis in the group of subjects who were recruited after January 1, 2008. AHI was defined as the number of apneas and hypopneas per hour of sleep. Apnea index was defined as the number of apneas per hour of sleep. Oxyhemoglobin desaturation index was defined as the number of desaturations ≥ 3% from baseline per hour of sleep. Arousal index was the number of cortical arousals per hour of sleep.
All subjects included in this study were prescribed CPAP machines containing data cards that collected nightly data on the amount of time the CPAP was used with pressure on. At the 6-month follow up, data from the preceding 4 weeks of treatment were downloaded and averaged to obtain the number of nights per week and number of hours per night that the CPAP was used.
Analysis
The use-corrected mean nightly AHI (AHImean) was calculated using the following equation proposed by Ravesloot & de Vries6:
 |
where nightsON and nightsOFF are the number of nights in a week the CPAP is used and not used, respectively; sleep hoursON and sleep hoursOFF are the number of sleep hours per night the CPAP is used and not used, respectively; sleep hoursTOTAL is the number of hours slept in a typical night as reported by subjects on the follow-up Pittsburgh Sleep Quality Index; AHION is the AHI measured on titration polysomnography at the prescribed CPAP pressure (in our sample, subjects spent an average of 139 ± 79 minutes at the prescribed pressure during their titration polysomnography); and AHIOFF is the baseline AHI measured on the diagnostic polysomnography. The uncorrected change in AHI was calculated by subtracting AHION from AHIOFF. The change in mean nightly AHI was calculated by subtracting AHImean from AHIOFF. The formula was also applied to calculate a use-corrected apnea index, arousal index, and desaturation index.
Statistical analysis was conducted with Stata/SE 12 software (StataCorp LP, College Station, Texas). The descriptive summaries are reported as range and mean ± standard deviation for continuous variables, whereas frequencies are reported for categorical variables. Associations between baseline patient-reported instrument scores (Epworth Sleepiness Scale, Sleep Apnea Quality of Life Index, Pittsburgh Sleep Quality Index, SF-36 Mental Health Component, and SF-36 Physical Health Component) and the AHI at baseline (AHIOFF) were tested using Spearman correlation coefficients. Spearman correlation was also used to test the association between the change in each of the patient-reported instrument scores and both change in AHI and change in mean nightly AHI. The sample size provides > 80% power to detect a correlation ≥ 0.15. Steiger's Z-test was used to test for statistically significant differences between the correlation coefficients found between each of the 5 patient-reported outcome measures and change in AHI versus change in mean nightly AHI.14
Multivariable linear regression using robust standard errors to account for non-normality of data was used to examine the association between the change in each of the 5 patient-reported instrument scores and change in AHI as well as change in mean nightly AHI while adjusting for age, sex, BMI, and baseline Epworth Sleepiness Scale score. Baseline Epworth Sleepiness Scale score was included in the model to control for possible bias by indication for CPAP treatment. For example, a patient referred for OSA-related medical comorbidities rather than daytime symptoms may not be expected to have an improvement in patient-reported outcome measures after treatment. The resulting β coefficient is the improvement in instrument score associated with a one-unit improvement in AHI among those of the same age and sex, and with the same BMI and baseline Epworth Sleepiness Scale score. A p value < 0.05 was considered statistically significant for all statistical tests.
For subjects who use their CPAP 100% of their total sleep time, the mean nightly AHI formula simplifies to the AHI on CPAP, and therefore the change in mean nightly AHI is the same as the change in AHI for these subjects. Conversely, in low adherence subjects, there is a large difference between the change in AHI and change in mean nightly AHI. Therefore, in the highest adherent group we would expect the smallest difference between the associations between patient-reported measures and the change in AHI versus the change in mean nightly AHI, whereas in the lowest adherent group we would expect the largest difference between these associations. To test the hypothesis that there would be smaller changes in these associations in the highest adherent group than in the lowest adherent group, we performed a linear regression analysis adjusting for age, sex, BMI, and baseline ESS score stratified by the highest and lowest levels of CPAP use, with strata defined as using CPAP ≥ 80% and ≤ 20% of total sleep time.
All analyses were repeated for the sample recruited after the change in AASM guidelines implemented in the sleep lab in January 2008. In addition, as an exploratory analysis, each test above was repeated for the 4 additional polysomnography measures, including apnea index, oxyhemoglobin desaturation index, arousal index, and lowest oxyhemoglobin saturation, where mean nightly scores for each were calculated as for mean nightly AHI above.
RESULTS
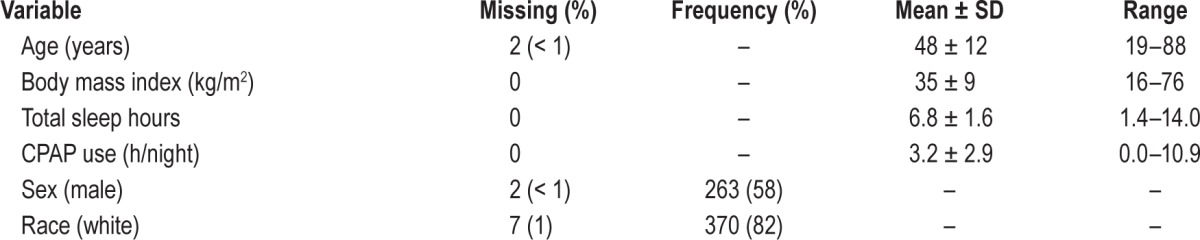
Of the 1,452 subjects who consented to participate, 558 had complete data available for analysis (Figure 1). Eighty-three subjects had a paradoxical worsening of their AHI on CPAP (e.g., induced central apneas) and were excluded from the analysis. Of the 558 with complete data, 459 underwent diagnostic polysomnography and successful CPAP titration with the pre-2007 AASM guidelines and comprised the sample used for the primary analysis. The study sample was middle-aged, obese, and predominantly male and white (Table 1). The health status of the parent cohort from which the sample was derived has been described previously.15 On average, the cohort had < 1 serious and < 3 functional medical comorbidities as measured by the Charlson Comorbidity Index (0.7 ± 1.4) and the Functional Comorbidity Index (2.4 ± 1.7), respectively. The sample had a wide range of CPAP use and amount of self-reported nightly sleep (Table 1).
Figure 1. Description of cohort.
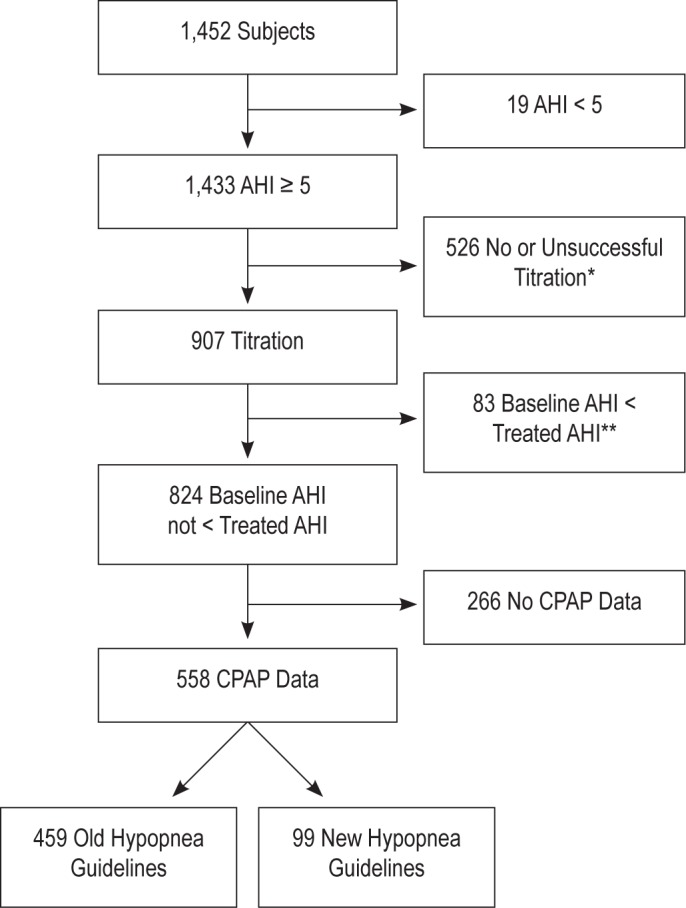
*No titration indicates subject did not have a titration polysomnography. Unsuccessful titration means the CPAP pressure prescribed was not tested during the titration polysomnography (e.g., CPAP pressure was empirically set beyond the pressure range tested during the polysomnography). **These subjects had paradoxical worsening of their AHI on CPAP, thought to be due to induced central apneas.
Table 1.
Sample characteristics (n = 459).
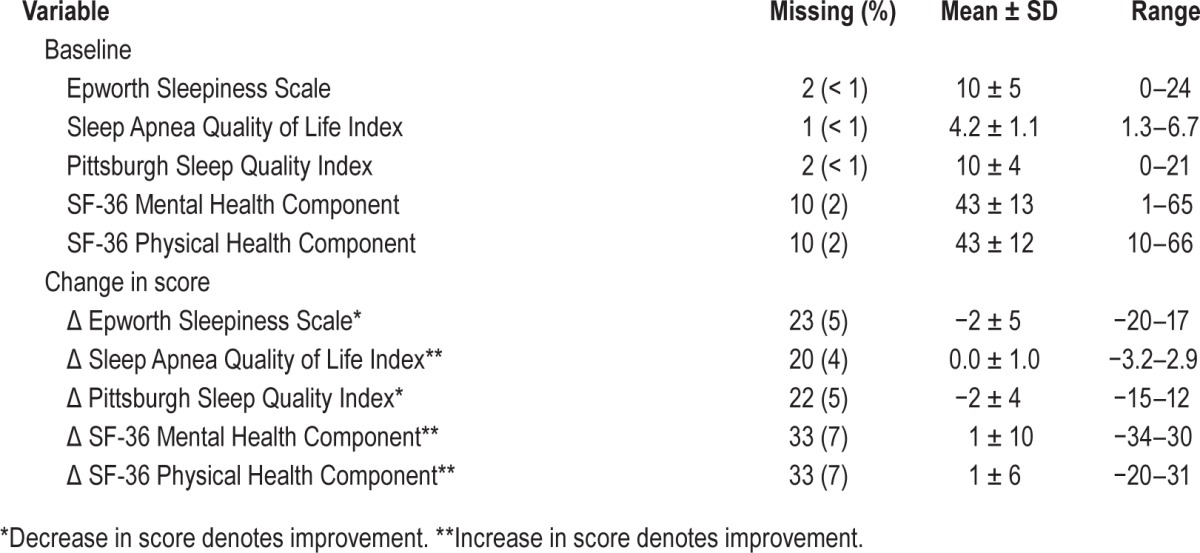
On average, the sample had severe baseline OSA, which improved to mild-moderate OSA while on prescribed CPAP. The improvement in AHI while using prescribed CPAP was approximately twice the improvement in mean nightly AHI (Table 2). The sample had borderline excessive sleep propensity, moderate OSA-specific quality of life, poor sleep quality, and deficits in health status as measured on the patient-reported instruments. On average, the sample experienced modest improvements in all instrument scores after CPAP treatment, aside from the SAQLI, for which there was no change from baseline (Table 3). The final sample was not significantly different from those excluded with regard to age, sex, race, or any of the baseline patient-reported instrument scores. However, the study sample had a higher BMI (35 ± 9 vs. 33 ± 9, p < 0.001) and baseline AHI (64 ± 33 vs. 50 ± 32, p < 0.001) than those who were excluded. There was no significant correlation between baseline AHI and improvement in any of the clinical measures (all correlations < 0.14), nor was there a strong correlation between percent of sleep time that the CPAP was used and change in any clinical measure (all correlations < 0.25).
Table 2.
Summary of polysomnography measures.
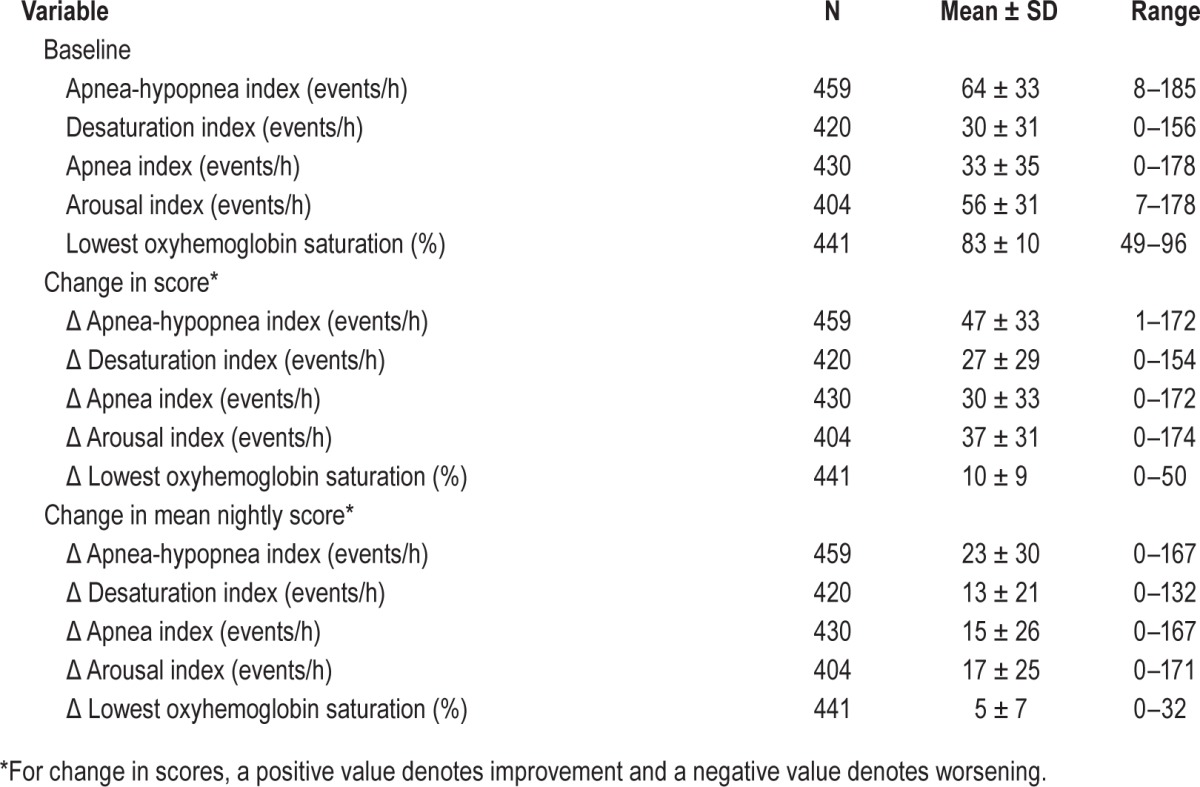
Table 3.
Summary of clinical outcome measures (n = 459).
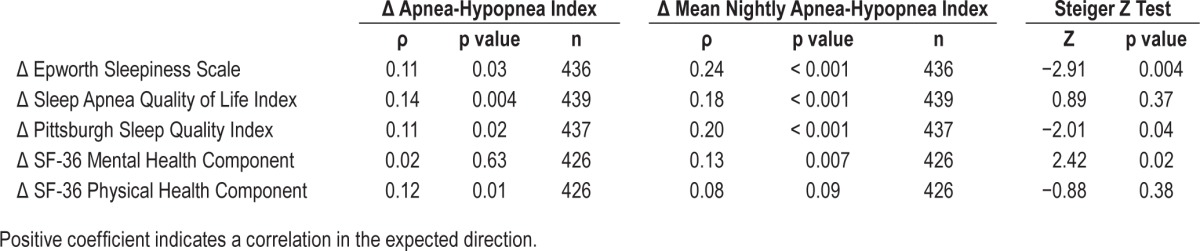
The correlations between baseline patient-reported questionnaire scores and baseline AHI (AHIOFF) ranged from 0.05 to 0.17, and 3 of the 5 were statistically significantly different from zero (Table 4). When the correlations between the change in patient-reported outcome scores and the improvement in AHI on CPAP were measured without correcting for CPAP use (AHION − AHIOFF), all correlation coefficients were weak (< 0.3), though most were statistically significantly different from zero (Table 5). When the improvement in AHI on CPAP was corrected for CPAP use, the correlations between the change in patient-reported outcome scores and the improvement in mean nightly AHI (AHImean − AHIOFF) increased and the p values decreased for all of the patient-reported measures, except for the SF-36 Physical Component score, which was no longer significant (Table 5). Steiger Z test demonstrated that the improvements in correlation after adjustment for CPAP use were statistically significant for 3 of the 5 patient-centered measures (Table 5). The results did not differ between subgroups defined as sleepy (baseline ESS > 10) and not sleepy (baseline ESS ≤ 10, data not shown).
Table 4.
Correlation between baseline patient reported-outcome measures and baseline apnea-hypopnea index.
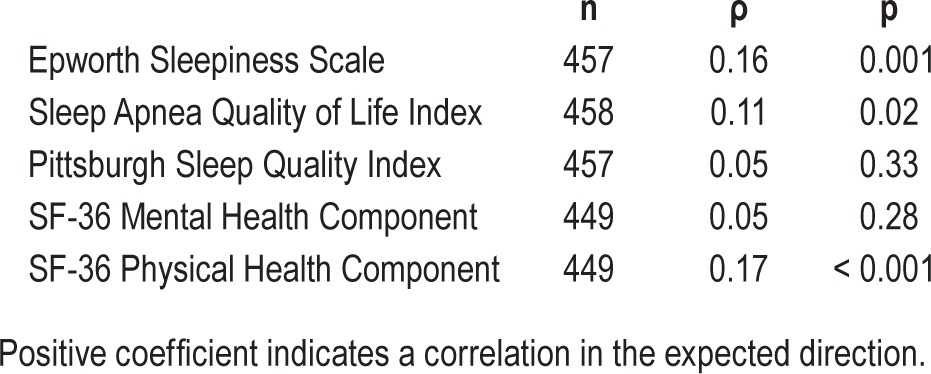
Table 5.
Correlation between change in patient-reported outcome measures and both change in apnea-hypopnea index and change in mean nightly apnea-hypopnea index after six months of continuous positive airway pressure treatment.
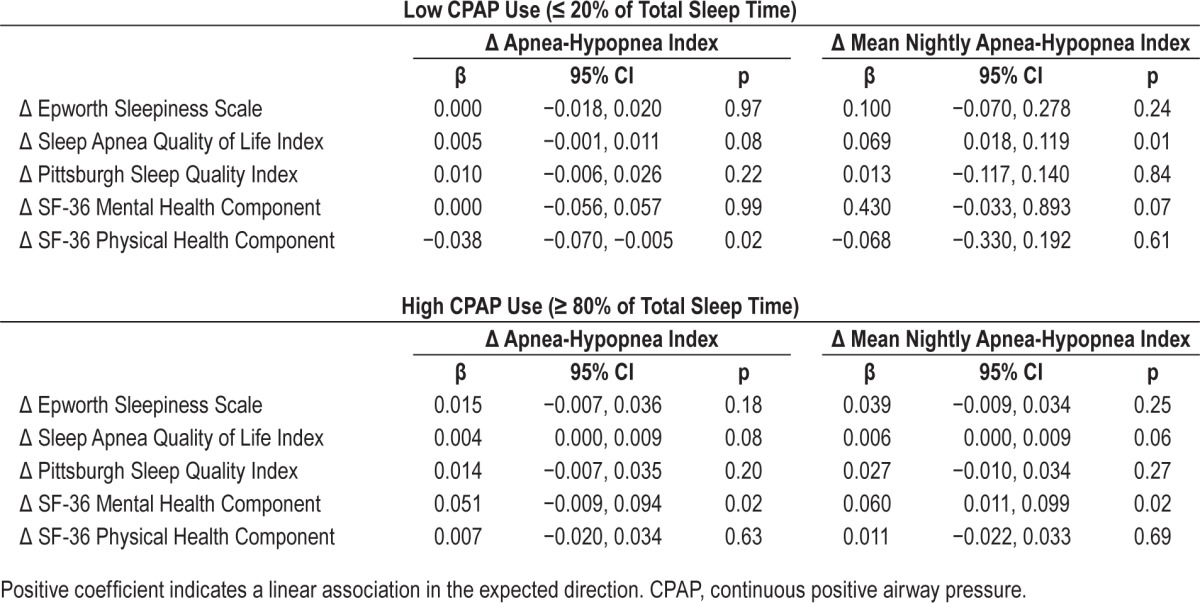
Similar associations were found with multiple linear regression adjusting for age, sex, BMI, and baseline Epworth score (Table 6). Similar correlations were found between change in the patient-reported measures and the apnea index, lowest oxy-hemoglobin saturation, arousal index, and desaturation index. The correlations between the change in each of the 5 clinical measures and the change in the additional polysomnography measures were weak (Spearman rho: 0.00–0.14), and the correlations improved after correcting the polysomnography measures for CPAP use (Spearman rho: 0.02–0.25). However, the correlations overall were weak, similar to the pattern seen for AHI. Adjusted linear regression analysis for the additional polysomnography measures showed a similar pattern as that seen for the unadjusted analysis (data not shown). In the analysis stratified by CPAP adherence, we found a larger improvement in association in the lowest adherence group than in the high adherence group for all but the SF36 physical component score (Table 7).
Table 6.
Linear regression analysis of the association between change in patient-reported outcome measures and both change in apnea-hypopnea index and change in mean nightly apnea-hypopnea index after six months of continuous positive airway pressure treatment, adjusted for age, sex, body mass index, and baseline Epworth Sleepiness Scale score.
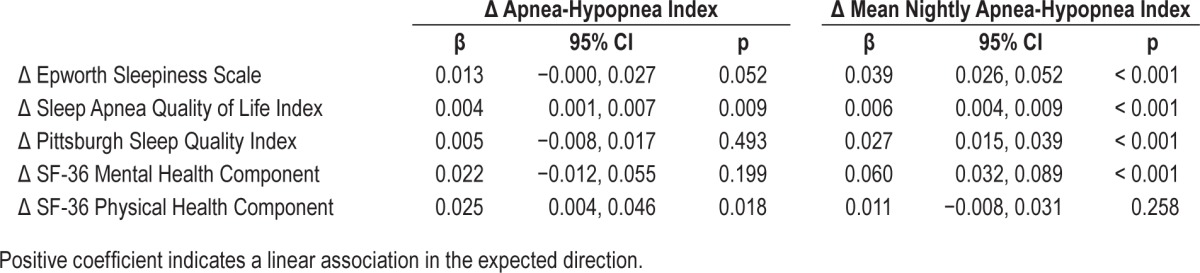
Table 7.
Linear regression analysis of the association between change in patient-reported outcome measures and both change in apnea-hypopnea index and change in mean nightly apnea-hypopnea index after six months of CPAP treatment, adjusted for age, sex, body mass index, and baseline Epworth Sleepiness Scale score stratified by CPAP use (low versus high).
The analysis was repeated for the 99 subjects who were recruited after the initiation of the updated AASM guidelines in October 2007. Though the magnitude of the correlations differed, the overall trend was the same, with the change in patient-reported outcome measures demonstrating consistently stronger correlations with the change in mean nightly AHI (i.e., corrected for CPAP use) than with the change in AHI (results not shown). A similar pattern of results was found for the 4 additional polysomnography measures (results not shown).
DISCUSSION
Our results demonstrate that correlations between changes in patient-reported outcome measures and polysomnography measures with CPAP treatment improve when the change in polysomnography measures are corrected for CPAP use, suggesting that the discordance seen in previous studies may be due at least in part to individual CPAP adherence.
A similar lack of correlation between patient-reported measures and polysomnography measures is seen after OSA surgery, which does not depend on patient adherence.3,16 If the correlations are poor in patients who have undergone a treatment that does not rely on adherence, one might wonder why we would expect adherence to affect the correlations. We believe the answer lies in one inherent difference between CPAP and surgery: CPAP is titrated to normalize polysomnography measures while surgery is targeted to reduce anatomic obstruction, not to normalize the polysomnography measures specifically. Therefore, we would expect that the amount of time the CPAP is used would more directly affect the correlations between polysomnography measures and patient-reported measures after CPAP treatment.
On the surface, this analysis might appear to be prone to numerous confounding variables. However, this cross-sectional analysis compares one set of correlations to another within the same sample, and therefore each subject serves as his or her own control. Between-subjects variability in CPAP machine and/or settings used, titration parameters, weight gain, medical comorbidities and medications do not affect comparison of correlations, as the only parameter changed in the comparative analysis is an adjustment for CPAP use. The analysis did account for other potential sources of bias, such as hypopnea scoring definitions, symptomatic versus medical indication for CPAP, and choice of polysomnography parameter studied.
This study does have several limitations. The weighted average method of correcting for CPAP adherence assumes a linear relationship between the amount of time CPAP is used and the benefit received. This linear relationship has not been established definitively but is suggested as a reasonable approximation for both short-term clinical outcomes and long-term health consequences.5,17,18 In addition, the corrected AHI calculation relies on self-report of total sleep time, which may be prone to inaccuracy. For example, people with insomnia tend to underestimate their average nightly sleep time on the PSQI.19 This inaccuracy may be due to the sleep-state misperception common in this population, which has not been reported in the OSA population. However, if we assumed that the subjects in this study also underestimated their total sleep time, then it would tend to underestimate the difference between the corrected and uncorrected AHI and the difference in their correlations with the patient-reported outcome measures. In other words, an underestimation of sleep time would tend to introduce a conservative bias in our analysis.
We also acknowledge that the AHI on CPAP at home may not always reflect the in-laboratory AHI at prescribed pressure, and this may have resulted in a conservative estimate of the difference between corrected and uncorrected AHI. One way to incorporate the AHI on CPAP into the formula would be to use the residual AHI measured by the CPAP machine as the “AHION.” However, we did not have those data available at the time of data collection. In addition, the AHI measured by CPAP machine is done by various proprietary methods that differ from polysomnography, and they can be prone to inaccuracy as well.
Complete data were not available for all subjects, leaving results subject to potential selection bias. The analyzed sample had higher BMI and more severe OSA than the unanalyzed sample, although both samples were obese and had severe OSA. Despite those differences, the analyzed sample appeared similar to those not analyzed with respect to age, gender, race, and baseline patient-reported outcome scores. It is unclear how an individual's baseline polysomnography measures would affect the correlation between the improvement in polysomnography measures on CPAP and change in outcome measures, so the potential selection bias is unclear. Our study sample was similar to the general United States OSA population with regard to age, gender, and BMI.20,21 However, the 82% white sample in this study may limit the generalizability of these results to other racial groups.
Despite these limitations, our findings have implications for studies of the effectiveness of CPAP therapy utilizing AHI and other polysomnography measures as outcome measures. Measurement of AHI is done under idealized conditions with the CPAP on, so AHI and other polysomnography measures are by definition efficacy measures. In contrast, patient-centered outcomes measures are clinical measures of sleep over time under real-world conditions, whether or not the patient is using their CPAP full time. These types of clinical measures are by definition effectiveness measures. While we might expect these two different measures of OSA burden to correlate well with one another, it is often not the case.1,2,5,18 This study demonstrates that this discordance in outcome in CPAP patients is due in part to the variability in CPAP use. Correcting the AHI for use so that it better reflects real-life conditions resulted in a stronger correlation with clinical effectiveness measures. Therefore, the use of the weighted average formula may be considered to improve measurement accuracy by reflecting real world effectiveness rather than idealized in-laboratory efficacy.
The corrected AHI will be particularly useful when comparing AHI outcomes of CPAP to other treatments that have a different adherence profile (e.g., oral appliances) or that do not depend on adherence (e.g., surgery). Future work may include examining the impact of this correction on the relationship between AHI and other polysomnography measures and long-term health consequences of OSA.
It is important to note that, while the use-corrected correlations were stronger than the uncorrected correlations between polysomnography measures and patient-reported measures, they were still weak across all patient-reported measures. Our results suggest that at best 6% of the variance in the change in the five patient-reported measure scores could be explained by the variance in the change in AHI alone (i.e., highest coefficient of determination, r2, was 0.06 for the Epworth Sleepiness Scale). This finding suggests that, even when the AHI and other polysomnography measures are corrected for CPAP use, they are not a comprehensive measure of OSA burden. This finding is not new.3 However, it deserves emphasis because patients seek treatment for improvement in symptoms and other clinical outcomes, yet clinical standards have evolved to focus more on surrogate physiologic outcomes like AHI and other polysomnography measures.22 AHI is an important surrogate measure of future cardiovascular disease and death23–27; however, it is important to consider both short-term patient-centered outcomes and long-term health consequences when evaluating treatments for OSA. The former are best measured directly while the latter are more practically measured by surrogates such as AHI or oxyhemoglobin desaturation index.
The apparent paradox in which an objective measure of disease severity does not correlate well with the patient-reported experience is not unique to OSA. The same is true for objective and subjective measures of nasal breathing28 and sinusitis.29 Similarly, objective pulmonary function tests do not correlate with symptoms in asthma patients,30 and objective cardiac function tests do not correlate with quality of life in angina patients.31
In conclusion, the correlations between polysomnography outcomes and patient-reported outcomes in CPAP patients improve after correcting the polysomnography outcome measures for CPAP use. Nevertheless, even with correction for CPAP use, the polysomnography measures correlate poorly with patient-reported measures of OSA burden and outcome. While AHI and other polysomnography measures have value for diagnosing and monitoring OSA, they do not capture the full complexity of OSA disease burden or outcome. The use of weighted average formulas strengthen AHI and other polysomnography measures as surrogate measures and should be used whenever measuring polysomnography outcomes with CPAP and other adherence-dependent therapies, but patient-centered outcomes like symptoms and quality of life should also be measured directly.
DISCLOSURE STATEMENT
Financial Support for this study was provided by the National Institutes of Health T32 DC000018 (EMK), NIH K23 HL068849 (EMW), and the Triological Research Career Development Award (EMW). Dr. Weaver is partially supported by resources from the Veterans Affairs Puget Sound Health Care System, Seattle, Washington. This study was conducted at the University of Washington Sleep Center, Seattle, WA. The authors have indicated no financial conflicts of interest.
ACKNOWLEDGMENTS
The authors acknowledge Kathryn T. James, PA-C, MPH and the research assistants of the Sleep Apnea Research Group and staff at the University of Washington Sleep Center at Harborview Medical Center, who were invaluable in data collection and coordination for this study. We acknowledge Vishesh Kapur, MD, MPH, for critical and thoughtful review of the manuscript.
REFERENCES
- 1.Barnes M, Houston D, Worsnop CJ, et al. A randomized controlled trial of continuous positive airway pressure in mild obstructive sleep apnea. Am J Respir Crit Care Med. 2002;165:773–80. doi: 10.1164/ajrccm.165.6.2003166. [DOI] [PubMed] [Google Scholar]
- 2.Weaver EM, Kapur V, Yueh B. Polysomnography vs self-reported measures in patients with sleep apnea. Arch Otolaryngol Head Neck Surg. 2004;130:453–8. doi: 10.1001/archotol.130.4.453. [DOI] [PubMed] [Google Scholar]
- 3.Weaver EM, Woodson BT, Steward DL. Polysomnography indexes are discordant with quality of life, symptoms, and reaction times in sleep apnea patients. Otolaryngol Head Neck Surg. 2005;132:255–62. doi: 10.1016/j.otohns.2004.11.001. [DOI] [PubMed] [Google Scholar]
- 4.Weaver T, Maislin G, Dinges D, et al. Relationship between hours of CPAP use and achieving normal levels of sleepiness and daily functioning. Sleep. 2007;30:711–9. doi: 10.1093/sleep/30.6.711. [DOI] [PMC free article] [PubMed] [Google Scholar]
- 5.Antic N, Catcheside P, Buchan C, et al. The effect of CPAP in normalizing daytime sleepiness, quality of life, and neurocognitive function in patients with moderate to severe OSA. Sleep. 2011;34:111–19. doi: 10.1093/sleep/34.1.111. [DOI] [PMC free article] [PubMed] [Google Scholar]
- 6.Ravesloot MJ, de Vries N. Reliable calculation of the efficacy of non-surgical and surgical treatment of obstructive sleep apnea revisited. Sleep. 2011;34:105–10. doi: 10.1093/sleep/34.1.105. [DOI] [PMC free article] [PubMed] [Google Scholar]
- 7.Stuck BA, Leitzbach S, Maurer JT. Effects of continuous positive airway pressure on apnea-hypopnea index in obstructive sleep apnea based on long-term compliance. Sleep Breath. 2012;16:467–71. doi: 10.1007/s11325-011-0527-8. [DOI] [PubMed] [Google Scholar]
- 8.Johns MW. A new method for measuring daytime sleepiness: the Epworth sleepiness scale. Sleep. 1991;14:540–5. doi: 10.1093/sleep/14.6.540. [DOI] [PubMed] [Google Scholar]
- 9.Flemons WW, Reimer MA. Development of a disease-specific health-related quality of life questionnaire for sleep apnea. Am J Respir Crit Care Med. 1998;158:494–503. doi: 10.1164/ajrccm.158.2.9712036. [DOI] [PubMed] [Google Scholar]
- 10.Buysse DJ, Reynolds CF, Monk TH, Berman SR, Kupfer DJ. The Pittsburgh Sleep Quality Index: a new instrument for psychiatric practice and research. Psychiatry Res. 1989;28:193–213. doi: 10.1016/0165-1781(89)90047-4. [DOI] [PubMed] [Google Scholar]
- 11.Ware J, Sherbourne C. The MOS 36-item short-form health survey (SF-36). I. Conceptual framework and item selection. Med Care. 1992;30:473–83. [PubMed] [Google Scholar]
- 12.Ware J, Snow K, Kosinski M, Gandek B. Boston: New England Medical Ctr; 1993. SF-36 Health Survey: manual & interpretation guide. [Google Scholar]
- 13.Ware J, Gandek B. Overview of the SF-36 Health Survey and the International Quality of Life Assessment (IQOLA) Project. J Clin Epidemiol. 1998;51:903–12. doi: 10.1016/s0895-4356(98)00081-x. [DOI] [PubMed] [Google Scholar]
- 14.Meng X-l, Rosenthal R, Rubin DB. Comparing correlated correlation coefficients. Psychol Bull. 1992;111:172–5. [Google Scholar]
- 15.Levine CG, Weaver EM. Functional comorbidity index in sleep apnea. Otolaryngol Head Neck Surg. 2014;150:494–500. doi: 10.1177/0194599813518164. [DOI] [PMC free article] [PubMed] [Google Scholar]
- 16.Sundaram S, Bridgman S, Lim J, Lasserson T. Surgery for obstructive sleep apnoea. Cochrane Database Syst Rev. 2005;4:CD001004. doi: 10.1002/14651858.CD001004.pub2. [DOI] [PubMed] [Google Scholar]
- 17.Campos-Rodriguez F, Peña-Griñan N, Reyes-Nuñez N, et al. Mortality in obstructive sleep apnea-hypopnea patients treated with positive airway pressure. Chest. 2005;128:624–33. doi: 10.1378/chest.128.2.624. [DOI] [PubMed] [Google Scholar]
- 18.Weaver T, Maislin G, Dinges D, Bloxham T, George C, Greenberg H. Relationship between hours of CPAP use and achieving normal levels of sleepiness and daily functioning. Sleep. 2007;30:711–19. doi: 10.1093/sleep/30.6.711. [DOI] [PMC free article] [PubMed] [Google Scholar]
- 19.Backhaus J, Junghanns K, Broocks A, Riemann D, Hohagen F. Test-retest reliability and validity of the Pittsburgh Sleep Quality Index in primary insomnia. J Psychosom Res. 2002;53:737–40. doi: 10.1016/s0022-3999(02)00330-6. [DOI] [PubMed] [Google Scholar]
- 20.Lee W, Nagubadi S, Kryger MH, Mokhlesi B. Epidemiology of obstructive sleep apnea: a population-based perspective. Expert Rev Respir Med. 2008;2:349–64. doi: 10.1586/17476348.2.3.349. [DOI] [PMC free article] [PubMed] [Google Scholar]
- 21.Kendzerska T, Gershon AS, Hawker G, Leung RS, Tomlinson G. Obstructive sleep apnea and risk of cardiovascular events and all-cause mortality: a decade-long historical cohort study. PLoS Med. 2014;11:e1001599. doi: 10.1371/journal.pmed.1001599. [DOI] [PMC free article] [PubMed] [Google Scholar]
- 22.Aurora R, Casey K, Kristo D, et al. Practice parameters for the surgical modifications of the upper airway for obstructive sleep apnea in adults. Sleep. 2010;33:1408–13. doi: 10.1093/sleep/33.10.1408. [DOI] [PMC free article] [PubMed] [Google Scholar]
- 23.Nieto FJ, Young TB, Lind BK, et al. Association of sleep-disordered breathing, sleep apnea, and hypertension in a large community-based study. Sleep Heart Health Study. JAMA. 2000;283:1829–36. doi: 10.1001/jama.283.14.1829. [DOI] [PubMed] [Google Scholar]
- 24.Peppard PE, Young T, Palta M, Skatrud J. Prospective study of the association between sleep-disordered breathing and hypertension. N Engl J Med. 2000;342:1378–84. doi: 10.1056/NEJM200005113421901. [DOI] [PubMed] [Google Scholar]
- 25.Kraiczi H, Yuksel P, Caidahl K, Samuelsson A, Hedner J. Blood pressure, cardiac structure and severity of obstructive sleep apnea in a sleep clinic population. J Hypertens. 2001;19:2071–78. doi: 10.1097/00004872-200111000-00019. [DOI] [PubMed] [Google Scholar]
- 26.Marin JM, Carrizo SJ, Vicente E, Agusti AG. Long-term cardiovascular outcomes in men with obstructive sleep apnoea-hypopnoea with or without treatment with continuous positive airway pressure: an observational study. Lancet. 2005;365:1046–53. doi: 10.1016/S0140-6736(05)71141-7. [DOI] [PubMed] [Google Scholar]
- 27.Young T, Finn L, Peppard PE, et al. Sleep disordered breathing and mortality: eighteen-year follow-up of the Wisconsin sleep cohort. Sleep. 2008;31:1071–8. [PMC free article] [PubMed] [Google Scholar]
- 28.Lam DJ, James KT, Weaver EM. Comparison of anatomic, physiological, and subjective measures of the nasal airway. Am J Rhinol. 2006;20:463–70. doi: 10.2500/ajr.2006.20.2940. [DOI] [PubMed] [Google Scholar]
- 29.Stewart MG, Sicard MW, Piccirillo JF, Diaz-Marchan P. Severity staging in chronic sinusitis: are CT scan findings related to patient symptoms. Am J Rhinol. 1999;13:161–7. doi: 10.2500/105065899781389704. [DOI] [PubMed] [Google Scholar]
- 30.Brand P, Duiverman E, Waalkens H, van Essen-Zandvliet E, Kerrebijn K. Peak flow variation in childhood asthma: correlation with symptoms, airways obstruction, and hyperresponsiveness during long-term treatment with inhaled corticosteroids. Dutch CNSLD Study Group. Thorax. 1995;54:103–7. doi: 10.1136/thx.54.2.103. [DOI] [PMC free article] [PubMed] [Google Scholar]
- 31.Wiklund I, Comerford M, Dimenas E. The relationship between exercise tolerance and quality of life in angina pectoris. Clin Cardiol. 1991;19:204–8. doi: 10.1002/clc.4960140306. [DOI] [PubMed] [Google Scholar]