

Abstract
N-type voltage-gated calcium (CaV2.2) channels are expressed in neurons and targeted to the plasma membrane of presynaptic terminals, facilitating neurotransmitter release. Here, we find that the adaptor protein complex-1 (AP-1) mediates trafficking of CaV2.2 from the trans-Golgi network to the cell surface. Examination of splice variants of CaV2.2, containing either exon 37a (selectively expressed in nociceptors) or 37b in the proximal C terminus, reveal that canonical AP-1 binding motifs, YxxΦ and [DE]xxxL[LI], present only in exon 37a, enhance intracellular trafficking of exon 37a-containing CaV2.2 to the axons and plasma membrane of rat DRG neurons. Finally, we identify differential effects of dopamine-2 receptor (D2R) and its agonist-induced activation on trafficking of CaV2.2 isoforms. D2R slowed the endocytosis of CaV2.2 containing exon 37b, but not exon 37a, and activation by the agonist quinpirole reversed the effect of the D2R. Our work thus reveals key mechanisms involved in the trafficking of N-type calcium channels.
SIGNIFICANCE STATEMENT CaV2.2 channels are important for neurotransmitter release, but how they are trafficked is still poorly understood. Here, we describe a novel mechanism for trafficking of CaV2.2 from the trans-Golgi network to the cell surface which is mediated by the adaptor protein AP-1. Alternative splicing of exon 37 produces CaV2.2-exon 37a, selectively expressed in nociceptors, or CaV2.2-exon 37b, which is the major splice isoform. Our study reveals that canonical AP-1 binding motifs (YxxΦ and [DE]xxxL[LI]), present in exon 37a, but not 37b, enhance intracellular trafficking of exon 37a-containing CaV2.2 to axons and plasma membrane of DRG neurons. Interaction of APs with CaV2.2 channels may also be key underlying mechanisms for differential effects of the dopamine D2 receptor on trafficking of CaV2.2 splice variants.
Keywords: adaptor protein, calcium channel, dopamine receptor, electrophysiology, G-protein-coupled receptor, trafficking
Introduction
N-type voltage gated calcium channels (CaV2.2) are expressed predominantly in central and peripheral neurons (Nowycky et al., 1985; Dubel et al., 1992; Westenbroek et al., 1998). At presynaptic terminals, CaV2.2 channels are recruited to the active zone where they are activated upon the arrival of action potentials, triggering influx of Ca2+ through the pore-forming α1 subunit and causing neurotransmitter release (Reynolds et al., 1986; Hirning et al., 1988; Hibino et al., 2002; Maximov and Bezprozvanny, 2002; Han et al., 2011; Kaeser et al., 2011). Neurons are morphologically complex cells that are highly polarized for their specialized functions, and several studies have elucidated how CaV2.2 channels are targeted to the plasma membrane where they are required. The association of CaV2 channels with auxiliary subunits, β and α2δ, is thought to be important not only for the biophysical properties, but also for correct intracellular trafficking of the channels (De Waard et al., 1994; Gurnett et al., 1996; Dolphin, 2012; Cassidy et al., 2014). Furthermore, interaction of CaV2.2 with G-protein-coupled receptors (GPCRs) is also reported to influence the cell surface expression of CaV2.2 (Altier et al., 2006; Kisilevsky and Zamponi, 2008; Kisilevsky et al., 2008; Evans et al., 2010). However, the precise mechanisms of CaV2.2 trafficking between intracellular organelles and the plasma membrane are poorly understood.
Posttranscriptional modification such as alternative splicing provides CaV2.2 with further functional variation, which fine-tunes neuronal excitability. To elucidate how CaV2.2 channels are trafficked to the plasma membrane in neurons, we investigated whether there are differences in trafficking between two CaV2.2 alternative splice variants of exon 37 in the proximal C terminus of CaV2.2, which is alternatively spliced in a mutually exclusive manner to give rise to CaV2.2 channels that contain either exon 37a (e37a) or exon 37b (e37b; Fig. 1A; Lipscombe et al., 2002; Bell et al., 2004). This introduces a relatively restricted change in the amino acid sequence, but nevertheless, CaV2.2e37a has a larger whole-cell current compared to CaV2.2e37b (Bell et al., 2004; Castiglioni et al., 2006; Raingo et al., 2007; Marangoudakis et al., 2012). Expression of exon 37a-containing CaV2.2 channels is enriched in small dorsal root ganglion (DRG) neurons, including nociceptors (Bell et al., 2004; Castiglioni et al., 2006; Altier et al., 2007). We noted that the exon 37a sequence introduces two canonical adaptor protein (AP) motifs that are absent from exon 37b. Together with several lines of evidence that the C terminus of CaV channels is important in channel targeting (Bourinet et al., 1999; Gao et al., 2000; Kepplinger et al., 2000; Krovetz et al., 2000; Hall et al., 2013), we hypothesized that CaV2.2 channels containing e37a may be more readily trafficked to the plasma membrane compared to CaV2.2e37b channels by virtue of these motifs.
Figure 1.
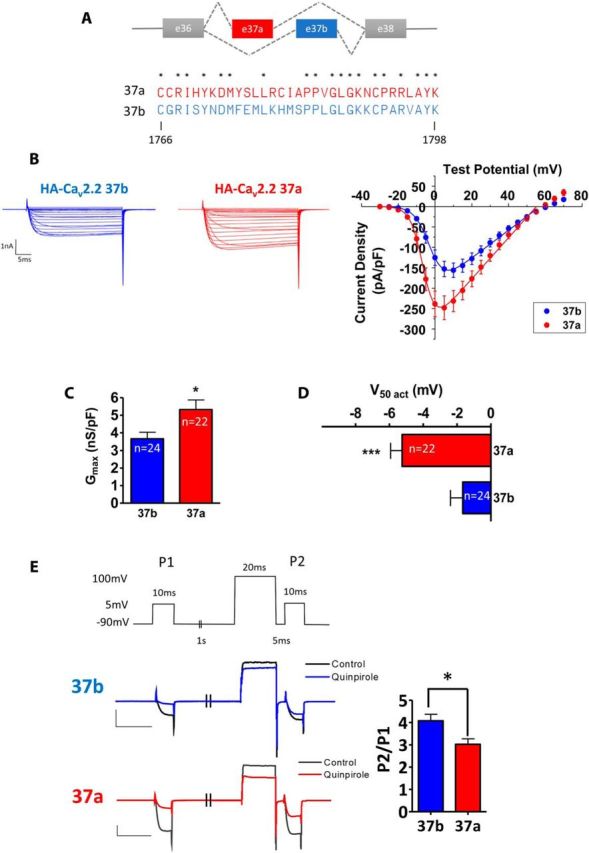
Alternative splicing in CaV2.2 exon 37 and electrophysiological properties of CaV2.2e37a and e37b. A, Mutually exclusive alternative splicing in CaV2.2 exon 37 and an alignment of exon 37a and 37b amino acid sequences. B, Representative whole-cell current recordings (left) and mean current–voltage relationship (right) for CaV2.2e37a and CaV2.2e37b in tsA-201 cells with α2δ-1 and β1b [peak current density (pA/pF), e37a (red), −245.0 ± 29.1 (+5 mV, n = 22); e37b (blue), −156.0 ± 17.7 (+10 mV, n = 24)]. C, The Gmax of e37a was significantly larger than that of e37b (p = 0.0189). D, V50,act of e37a was significantly hyperpolarized compared with e37b (p = 0.0009). E, D2 receptor-mediated inhibition of CaV2.2e37 isoforms. Whole-cell current was recorded before and after 300 nm quinpirole treatment. The voltage-clamp protocol is shown on the top. The exemplary current traces of CaV2.2e37b (black, control; blue, 300 nm Quin) and CaV2.2e37a (gray, control; red, 300 nm Quin) are also shown. The relative current expressed as P2/P1 was significantly smaller for CaV2.2e37a (n = 19) compared to CaV2.2e37b (n = 22) in the presence of 300 nm Quin (p = 0.0101), showing that the inhibition of CaV2.2e37a is more voltage-independent. n, Number of cells. *p < 0.05; ***p < 0.001 (Student's unpaired t test).
To demonstrate whether alternative splicing regulates trafficking of CaV2.2, we took advantage of our recently developed functional exofacially tagged CaV2.2 channels (Cassidy et al., 2014) to visualize their cellular localization in both Neuro2a (N2a) cells and DRG neurons. We used electrophysiological, immunocytochemical, and live-cell labeling approaches to demonstrate that CaV2.2 channels containing e37a are trafficked more readily than those with e37b to the plasma membrane and to the processes of DRG neurons, as a result of enhanced forward trafficking from the Golgi apparatus to the plasma membrane. We also reveal that this trafficking pathway is indeed dependent on specific motifs in e37a that mediate interaction with AP-1, which is involved in clathrin-mediated protein sorting (Bonifacino and Traub, 2003). Furthermore, we also present evidence that the dopamine-2 receptor (D2R) has a stabilizing effect on CaV2.2e37b channels, leading to increased cell surface expression, but not on CaV2.2e37a channels, and this effect on endocytosis is reversed by D2R activation. Our data suggest that D2R activation-mediated internalization of CaV2.2 involves interaction between AP-2 and the AP binding motifs in the proximal C terminus of CaV2.2. Together, we provide evidence for involvement of the AP-family in CaV2.2 trafficking, which is modulated by alternative splicing.
Materials and Methods
Constructs.
The following cDNA plasmids were used: CaV2.2 (D14157), β1b (X61396, from T. P. Snutch, University of British Columbia, Vancouver, Canada), α2δ-1 (M86621), and D2R (NM_012547). All the cDNAs were subcloned into pMT2 expression vectors for tsA-201 transfection, and into pcDNA3.0 or pRK5 expression vectors for N2a and DRG transfection. Hemagglutinin (HA)- and bungarotoxin-binding site (BBS)-tagged CaV2.2 were generated as described previously (Cassidy et al., 2014). Green fluorescent protein (GFP)-HA-tagged CaV2.2 was generated by subcloning HA-CaV2.2 into the N terminus of GFP-CaV2.2 (Raghib et al., 2001) by restriction digest. CaV2.2e37a AP binding motif mutants were generated using the primers shown in Table 1 at the following locations: Y1775A (Y/A), L1777A (L/A), L1777A/L1778A (LL/AA), and Y1775A/L1777A/L1778A (YSLL/ASAA). AP-1a shRNA with mCerulean in pSUPER vector was a gift from M. A. Cousin (University of Edinburgh, Edinburgh, UK) (Cheung and Cousin, 2012). The scrambled AP-1 shRNA was generated from the primers containing BglII and HindIII sites (Table 1). The PCR product was subcloned into pSUPER expression vector. AP-1 σ1A WT and V98S in pcDNA3.1 vectors were gifts from J. S. Bonifacino (NIH, Bethesda, MD) (Jain et al., 2015). AP-2 μ2 WT and F176A/D178S in pcDNA3.1 vectors were gifts from M. S. Robinson (Cambridge University, Cambridge, UK) (Motley et al., 2006). All constructs were verified by DNA sequencing.
Table 1.
Primers used in generating CaV2.2e37a AP-binding mutants and scrambled AP-1 shRNA
| Primers | Sequence (5′ to 3′) |
|---|---|
| a1B-Kpn21-F | CACAATAACTTCCGGACGTTTCTGCAG |
| LA-F | GGATATGTACAGTGCGTTGCGTTGTATTGC |
| LA-R | GCAATACAACGCAACGCACTGTACATATCC |
| LLAA-F | GGATATGTACAGTGCGGCGCGTTGTATTGC |
| LLAA-R | GCAATACAACGCGCCGCACTGTACATATCC |
| YA-F | AGGATATGGCCAGTTTGTTGCGTTG |
| YA-R | CAACGCAACAAACTGGCCATATCCT |
| YALLAA-F | AGGATATGGCCAGTGCGGCGCGTTGTATTGC |
| YALLAA-R | GCAATACAACGCGCCGCACTGGCCATATCCT |
| AP-1a_Scrambled-A | GATCCCCGAGACCTTAAGATCCTATTTTCAAGAGAAATAGGATCTTAAGGTCTCTTTTTA |
| AP-1a_Scrambled-B | AGCTTAAAAAGAGACCTTAAGATCCTATTTCTCTTGAAAATAGGATCTTAAGGTCTCGGG |
The forward (F) and reverse (R) primers used in generating the constructs described in Materials and Methods are shown here.
Cell culture and transfection.
tsA-201 cells were cultured in DMEM supplemented with 10% fetal bovine serum (FBS), 1 unit/ml penicillin, 1 μg/ml streptomycin, and 1% GlutaMAX (Invitrogen). tsA-201 cells were transfected using Fugene 6 (Promega) according to the manufacturer's protocol. Mouse neuroblastoma N2a cells were cultured in 50% DMEM and 50% Opti-MEM supplemented with 5% FBS, 1 unit/ml penicillin, 1 μg/ml streptomycin, and 1% GlutaMAX. N2a cells were transfected using PolyJet (SignaGen Laboratories) according to the manufacturer's protocol. Transfected cells were plated onto coverslips or glass-bottomed dishes (MatTek) coated with poly-l-lysine and cultured in a 5% CO2 incubator at 37°C. Postnatal day 10 DRG neurons were isolated from male Sprague Dawley rats and transfected with Amaxa Nucleofector (Lonza) according to the manufacturer's protocol. Transfected neurons were plated on the coverslips coated with poly-l-lysine and cultured in DMEM/F-12 supplemented with 10% FBS, 1 units/ml penicillin, 1 μg/ml streptomycin, 1% GlutaMAX, and 100 ng/ml NGF in a 5% CO2 incubator at 37°C. Pertussis toxin (PTX) treatment involved 16 h incubation with 500 ng/ml PTX before the experiment.
Western blotting.
After 40–48 h expression, cells were harvested in PBS containing Complete Protease Inhibitor Cocktail (PI; Roche; 1 tablet/50 ml). The cells were lysed in cell lysis buffer [50 mm Tris, pH 7.4, 50 mm NaCl, PI, 1% IGEPAL CA-630 (octylphenoxypolyethoxyethanol), 25 mm N-ethylmaleimide] by sonication and were then left on ice for 45 min. The cell lysate was clarified by centrifugation at 14,000 × g for 20 min. Protein samples were denatured by heating at 55°C for 15 min with reducing Laemmli sample buffer (2% SDS, 2% glycerol, 0.02% bromophenol blue, 50 mm Tris HCl, pH 6.8, 20 mm DTT). Proteins were separated on a 3–8% Tris-acetate gel (Invitrogen) and transferred onto a polyvinylidene fluoride membrane. The membrane was blocked in Tris-buffered saline solution (10 mm Tris, pH7.4, 500 mm NaCl, 0.5% IGEPAL CA-630) with 3% BSA and was then incubated with the primary antibody (1:1000) overnight at 4°C. The secondary antibody conjugated with horseradish peroxide (HRP; 1:3000) was incubated with the membrane at room temperature for 1 h. The proteins were detected using ECL Plus Western blotting detection reagents (GE Healthcare) according to the manufacturer's protocol and scanned using the fluorescent detection mode on a Typhoon 9410 (GE Healthcare). Primary antibodies used were rabbit anti-CaV2.2 II–III loop (Raghib et al., 2001) and mouse anti-GAPDH. Secondary antibodies used were goat anti-rabbit-HRP and goat anti-mouse-HRP (Invitrogen).
Immunocytochemistry.
After 40–72 h expression, cells were fixed with 4% paraformaldehyde (PFA) in PBS, pH7.4, at room temperature for 10 min. For labeling the HA epitope on the cell surface in nonpermeabilized conditions, the cells were incubated with primary antibody with 2.5% BSA and 10% goat serum in PBS at room temperature for 1 h for N2a cells, or overnight at 4°C for DRG neurons. The secondary antibody was added with 2.5% BSA and 10% goat serum in PBS and incubated for 1 h at room temperature. In experiments in which the D2R was activated, 100 nm quinpirole (Quin; Sigma-Aldrich) was added to N2a cells in Krebs–Ringer solution with HEPES [KRH; containing (in mm) 125 NaCl, 5 KCl, 1.1 MgCl2, 1.2 KH2PO4, 2 CaCl2, 6 glucose, 25 HEPES, and 1 NaHCO3] at 37°C for 30 min. PTX (500 ng/ml; Invitrogen) was added to the cells in the culture media overnight. To label intracellular proteins, the cells were permeabilized with 0.2% Triton X-100 in PBS for 10 min. The primary and secondary antibodies in 2.5% BSA and 10% goat serum were added to the cells as above. Cell nuclei were stained with 0.5 μm DAPI (4′,6′-diamidino-2-phenylindole) in PBS for 10 min. The coverslips were mounted onto glass slides using Vectashield mounting medium (Vector Laboratories). Primary antibodies used were rabbit anti-CaV2.2 (Raghib et al., 2001), rat anti-HA (Roche; 1:500) or mouse anti-Myc 9E10 (Santa Cruz Biotechnology; 1:100). Secondary antibodies (1:500) used were Alexa Fluor 594 anti-rabbit, Alexa Fluor 594 anti-rat, Alexa Fluor 647 anti-mouse (Invitrogen), or FITC anti-rat (Sigma-Aldrich).
Endocytosis and forward trafficking assay.
After 40 h expression, N2a cells in glass-bottomed dishes were washed twice with KRH. For the endocytosis assay, cells were incubated with 10 μg/ml α-bungarotoxin Alexa Fluor 488 conjugate (BTX488; Invitrogen) at 17°C for 30 min. The unbound BTX488 was removed by washing with KRH, and the labeled cells were returned to 37°C for the kinetic assay. Endocytosis was stopped by fixing the cells with cold 4% PFA in PBS at the specified time. For endocytosis experiments in which the D2R was activated, 100 nm Quin was added to the cells in KRH buffer after the BTX488 labeling stage. For the forward trafficking assay, the cells were incubated with 10 μg/ml unlabeled α-bungarotoxin (BTX; Invitrogen) at 17°C for 30 min. The unbound BTX was washed off with KRH, and the cells were then incubated with 10 μg/ml BTX488 in KRH at 37°C. To stop the reaction, cells were washed twice with cold KRH and then fixed with 4% PFA in PBS at specified times for the kinetic assay. Brefeldin A [BFA; 200 ng/ml (0.71 μm); Sigma-Aldrich] in 0.4% DMSO was added to the cells in FBS-free N2a cell culture medium for 4 h before the experiment, and during the experiment in KRH buffer. The cells were then permeabilized, and intracellular CaV2.2 and nuclei were labeled as described above. The 13 mm coverslips were mounted onto dishes using Vectashield mounting medium.
Confocal microscopy and image analysis.
All images were acquired using an LSM 780 Meta scanning confocal microscope (Zeiss) equipped with a Plan-Apochromat 63×/1.4 numerical aperture (NA) or 40×/1.3 NA differential interference contrast (DIC)II oil-immersion objective lens in 16-bit mode (Cassidy et al., 2014). The laser powers, gains, and acquisition settings were kept constant for images that were used subsequently for quantification. For cell surface expression analysis, images were taken with 0.7 μm optical sections. For neurite expression analysis, images were taken with 0.9 μm optical sections in Z-stack and presented as maximum projections. Confocal images were imported and analyzed in ImageJ (NIH). The membrane fluorescence was quantified using the freehand brush tool with a selection width of 0.66 μm and tracing the membrane region manually to acquire the fluorescence density, which is independent of cell circumference. Neurite fluorescence intensity was quantified using the freehand brush tool with a selection with of 2 μm and manually tracing the entire neurites using mCherry expression as a marker. Intracellular and whole-cell fluorescence densities were quantified using freehand selection, omitting the signal intensity from the nuclei. The background fluorescence density in each channel was also taken from the same image and subtracted from the signal density. For the endocytosis and forward trafficking assays, the normalized membrane fluorescent intensities were fitted to a single exponential. The forward trafficking rates were derived from the reciprocal of the time constant (τ) of the single exponential (1/τ).
Electrophysiology.
After 40 h expression, cells were replated in cell culture medium at a 1 in 3 or 5 dilution, depending on their confluency. Transfected cells were identified by coexpression of CD8, which was detected with CD8 Dynabeads (Invitrogen). Whole-cell currents were recorded in voltage-clamp mode in following solutions: intracellular (electrode) solution (in mm), 140 Cs-aspartate, 5 EGTA, 2 MgCl2, 0.1 CaCl2, 2 K2ATP, 20 HEPES, pH 7.2, 310 mOsm; extracellular solution (in mm), 1 BaCl2, 3 KCl, 1 NaHCO3, 1 MgCl2, 10 HEPES, 4 d-glucose, 160 tetraethylammonium bromide, pH 7.4, 320 mOsm. The borosilicate glass electrode resistance was between 1.5 and 4 MΩ. Cell capacitance and series resistance were compensated to 80%. Whole-cell currents were recorded with an Axopatch-200B amplifier using pClamp 9 or 10 (Molecular Devices). The cells were held at −90 mV, and 50 ms pulses were applied in +5 mV steps between −30 and +70 mV. For D2R activation, Quin was applied by local application through a perfusion system. To correct for the leak current, a P/8 leak subtraction protocol was applied. Recordings were filtered at 5 kHz (low-pass four-pole Bessel filter) in the amplifier. The digital low-pass eight-pole Bessel filter with a 1 kHz, 3 dB cutoff was applied in Clampfit 10.9 (Molecular Devices) before the current amplitudes were determined. Average peak currents were taken between 8 and 13 ms after the test potentials were applied and normalized to the cell capacitance to obtain the current density. Current–voltage (I–V) relationships were fitted to the following modified Boltzmann equation to give V50 activation (V50,act), conductance (Gmax), and reversal potential (Vrev) using Origin 7: I = Gmax(V − Vrev)/1 + e−(V−V50,act)/k.
Statistical analysis.
Immunocytochemistry and trafficking experiments with N2a cells were repeated with n = 3–5 transfections, and ∼30 to 50 cells were analyzed for each experiment. All data were presented as pooled in the result graphs except for the trafficking rates and time constants, which are averages of separate experiments. Statistical analysis was performed using either Student's unpaired t test or one-way ANOVA with Bonferroni's post hoc test as appropriate in GraphPad Prism. All the data are expressed as mean ± SEM.
Results
Exofacially tagged CaV2.2 channels containing e37a conduct a larger whole-cell current than those containing e37b
To compare the localization of CaV2.2 isoforms containing e37a or e37b (Fig. 1A), both channels were exofacially tagged with HA or BBS tags as described previously (Cassidy et al., 2014). First, to demonstrate that the exofacial tag does not affect the function of the CaV2.2 splice variant channels, whole-cell Ba2+ currents were recorded from tsA-201 cells transiently expressing HA-tagged CaV2.2e37a and CaV2.2e37b, together with the auxiliary subunits α2δ-1 and β1b. The average whole-cell current density of CaV2.2e37a was significantly larger than that of CaV2.2e37b at test potentials between −25 and 15 mV (Fig. 1B), and the average whole-cell conductance (Gmax) for CaV2.2e37a currents was ∼1.5-fold greater than that for Cav2.2e37b currents (Fig. 1C). Furthermore, Cav2.2e37a channels were activated at a more hyperpolarized potential than those containing e37b (Fig. 1D). These properties of CaV2.2e37a and e37b currents are in agreement with the previous reports in expression systems (Bell et al., 2004; Castiglioni et al., 2006; Raingo et al., 2007) and in transgenic mice (Andrade et al., 2010).
Moreover, these tagged CaV2.2 isoforms also exhibited differential voltage-dependence upon G-protein-coupled receptor (GPCR) activation, in a similar manner to that reported previously (Raingo et al., 2007; Andrade et al., 2010). Using a double pulse protocol, in the presence of the D2R, CaV2.2e37a and CaV2.2e37b currents [in the first test pulse (P1)] were inhibited by a D2R-specific agonist, quinpirole. When a large depolarizing pulse was applied just before the second test pulse (P2) in the presence of Quin, Cav2.2e37a exhibited significantly smaller relative currents (P2/P1), compared to CaV2.2e37b (Fig. 1E). This voltage-independent inhibition of CaV2.2e37a by D2R activation largely agrees with previous findings with GABAB and μ-opioid receptor activation in expression systems and in transgenic mice (Raingo et al., 2007; Andrade et al., 2010). These results demonstrate that the CaV2.2e37 isoforms containing exofacial tags function as predicted by previous studies.
CaV2.2e37a channels are preferentially expressed at the cell membrane
To investigate whether the increased current exhibited by CaV2.2e37a results from an effect on trafficking, mediating altered cellular localization of the CaV2.2e37 isoforms, we added GFP to the N terminus of the CaV2.2 splice variants containing the exofacial HA tag (Fig. 2A). The advantage of these constructs is that expression of the channel at the plasma membrane can be detected by immunostaining for the cell surface HA epitope in nonpermeabilizing conditions after fixation and the total channel localization determined by GFP simultaneously. These tagged CaV2.2 isoforms were transiently expressed in neuronal cell line N2a in the presence of α2δ-1 and β1b (Fig. 2A). This revealed a larger plasma membrane expression level of Cav2.2e37a compared to Cav2.2e37b, without altering the whole-cell expression level of the channels (Fig. 2B). GFP at the N terminus did not alter this cellular localization pattern, as the same observation was made from cells expressing the HA-tagged CaV2.2 isoforms, in which the intracellular channels were immunolabeled with anti-CaV2.2 II–III loop antibody, after permeabilization (Fig. 2C). This confirmed that CaV2.2 channels containing e37a are preferentially localized in the plasma membrane and that the increase in the cell surface expression is not due to the overall increase in the protein expression level.
Figure 2.

CaV2.2e37a exhibits a greater cell surface expression compared to CaV2.2e37b. A, Top, A schematic diagram showing GFP-HA-tagged CaV2.2, which contains GFP at the N terminus and HAgHA in an extracellular loop. Bottom, Confocal images of N2a cells expressing GFP-HA-CaV2.2e37a and e37b with α2δ-1 and β1b. Scale bar, 20 μm. B, Normalized cell surface (left) and total (right) CaV2.2 of GFP-HA-CaV2.2e37 isoforms. Cell surface HA and total GFP fluorescence intensities were quantified and normalized to the average intensity value of CaV2.2e37b from each experiment. Cell surface expression of GFP-HA-CaV2.2e37a was significantly greater than that of e37b (p = 0.0174). C, Cell surface (left) and total (right) CaV2.2 levels for HA-CaV2.2 isoforms, expressed in arbitrary units. Cell surface expression of HA-CaV2.2e37a was significantly greater than that of e37b (p = 0.0050), and the GFP at the N terminus did not affect the trafficking patterns for CaV2.2e37 isoforms. n, Number of cells. *p < 0.05; **p < 0.01 (Student's unpaired t test).
Preferential expression of CaV2.2e37a at the cell membrane was also exhibited in the cell bodies of isolated cultured DRG neurons expressing the HA-tagged GFP-CaV2.2 isoforms (Fig. 3A,B). The amount of tagged CaV2.2e37a channels in the neurites of these DRG neurons was also significantly higher than for CaV2.2e37b, without altering the level of an expression marker mCherry that was cotransfected to visualize the entire field of neurites (Fig. 3C,D). CaV2.2e37a channels were also expressed significantly further away from the soma in these neurites, compared to CaV2.2e37b (Fig. 3E). In summary, CaV2.2e37a channels in the DRG neurons were trafficked further along the neurites, as well as to the plasma membrane of the cell bodies, to a significantly greater degree than CaV2.2e37b channels.
Figure 3.
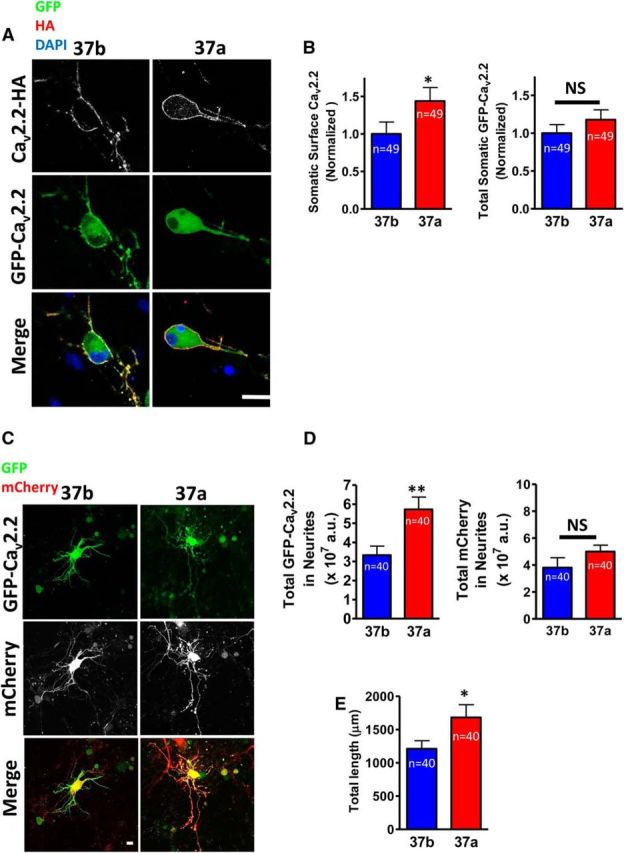
CaV2.2e37a is trafficked more readily than CaV2.2e37b to the plasma membrane of the soma and to the neuronal processes of DRG neurons. A, Confocal images of DRG cell bodies expressing GFP-HA-CaV2.2 isoforms with α2δ-1 and β1b. B, Normalized cell surface and total CaV2.2 in cell bodies. The cell surface HA and total GFP fluorescence densities were quantified and normalized to the average intensity value of CaV2.2e37b from each experiment. Cell surface expression of GFP-HA-CaV2.2e37a in the DRG somata was significantly greater than that of e37b (p = 0.0277). C, Confocal images of DRG neurites expressing GFP-HA-CaV2.2 isoforms with free mCherry. D, Total fluorescence of CaV2.2 isoforms and free mCherry in the neurites (in ×107 a.u.). Total GFP-HA-CaV2.2e37a in the DRG neurites was significantly greater than e37b (p = 0.0038). E, Total length of DRG neurites showing expression of GFP-HA-CaV2.2e37 isoforms. CaV2.2e37a channels were expressed further away from the soma than e37b channels (p = 0.0436). Scale bars: A, C, 20 μm. n, Number of cells. *p < 0.05; **p < 0.01 (Student's unpaired t test).
α2δ-1 is essential for the underlying mechanism of differential CaV2.2 isoform trafficking
Auxiliary α2δ subunits play an important role in CaV2.2 trafficking (Dolphin, 2012; Cassidy et al., 2014). To determine whether α2δ-1 is required for the differential cell surface expression of CaV2.2e37a channels, HA-tagged CaV2.2e37 isoforms were coexpressed plus β1b, with or without α2δ-1 in tsA-201 cells. The average whole-cell Gmax for both isoforms in the absence of α2δ-1 was significantly reduced, and the difference in conductance between e37a and e37b was lost (Fig. 4A,B). Similarly, in N2a cells, immunostaining of the cell surface HA-CaV2.2 revealed that the increased plasma membrane expression of CaV2.2e37a, relative to CaV2.2e37b, was lost in the absence of α2δ-1 (Fig. 4C,D). Thus, α2δ-1 is required for underlying mechanisms involved in the differential trafficking of CaV2.2e37a, possibly via interaction through intermediate protein(s) and utilization of the same pathway(s) involved in transporting the channels to the plasma membrane.
Figure 4.

Effect of α2δ-1 on the whole-cell conductance and the cell surface expression of CaV2.2 isoforms. A, Average whole-cell current density of CaV2.2 isoforms with and without α2δ-1 in tsA-201 cells [peak current density (pA/pF), e37b + α2δ-1 (blue), −204.5 ± 22.9 (+10 mV, n = 12); e37b (cyan), −41.7 ± 19.1 (+15 mV, n = 6); e37a + α2δ-1 (red), −323.0 ± 46.8 (+5 mV, n = 10); e37a (pink), −35.2 ± 10.0 (+15 mV, n = 6)]. B, Gmax. Values for experiments shown in A. C, Confocal images of N2a cells expressing HA-CaV2.2 isoforms, with or without α2δ-1. Scale bar, 20 μm. D, Cell surface CaV2.2 levels. The HA fluorescence intensities were normalized to the average intensity of CaV2.2e37b from each experiment. n, Number of cells. *p < 0.05; **p < 0.01; ***p < 0.001 (one-way ANOVA, Bonferroni's post hoc test).
CaV2.2e37a shows greater net forward trafficking to the cell membrane
To investigate the mechanism of differential CaV2.2 splice variant trafficking, BBS-tagged CaV2.2 constructs were expressed in N2a cells, in which the channels can be live-labeled directly with BTX488, to monitor the net appearance of the channels in the plasma membrane over time, after saturating the channels already on the surface with unlabeled BTX (Fig. 5A). In this protocol, the initial rate of appearance of CaV2.2e37a on the cell surface was greater than for CaV2.2e37b, leading to a greater steady-state maximum cell surface expression level (Fig. 5B). These results imply that the increased presence of CaV2.2e37a on the cell surface is due to an increased trafficking from subcellular organelles to the plasma membrane. Since the AP binding motifs in the CaV2.2e37 isoforms are also recognized by AP-2, another member of the AP family that is involved in endocytosis, the basal rates of endocytosis of the two isoforms were compared. CaV2.2e37a and CaV2.2e37b showed similar kinetics of endocytosis (Fig. 5C,D, Table 2), indicating that this did not contribute significantly to the observed differences in net forward trafficking.
Figure 5.
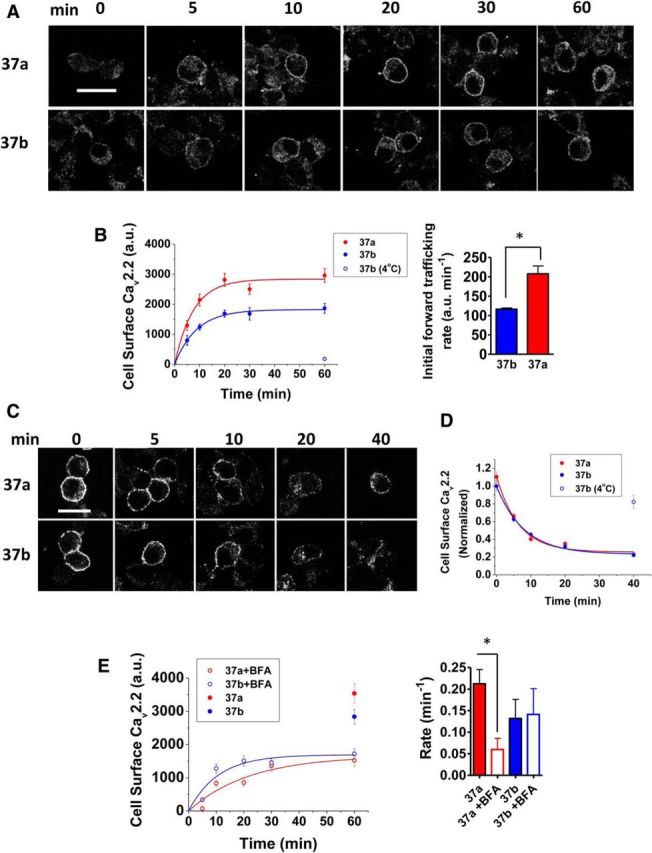
The forward trafficking of CaV2.2e37a isoforms is reduced by BFA. A, Confocal images of N2a cells expressing BBS-tagged CaV2.2e37 isoforms at different time points after the start of the net forward trafficking assay, showing the appearance of CaV2.2 at the cell surface by BTX488 live labeling. B, Left, Kinetics of CaV2.2e37 isoform net forward trafficking. The kinetic curves were fitted to a single exponential to derive time constant τ (minutes). The rates of net forward trafficking (1/τ, in min−1) were as follows: e37a (red), 0.212 ± 0.027 (n = 3); e37b (blue), 0.132 ± 0.036 (n = 3 transfections). As a negative control (blue open circle), e37b was kept at 4°C after the start of the experiment. Right, The initial rates of net forward trafficking of CaV2.2 isoforms in N2a cells were determined by taking the gradient of the linear regression from the initial linear phase of each forward trafficking kinetic curve. [CaV2.2e37b (blue), 116.6 ± 3.1 a.u./min; CaV2.2e37a (red), 207.7 ± 20.3 a.u./min; n = 3 transfections]. *p = 0.0114 (Student's unpaired t test). C, Endocytosis of CaV2.2e37 isoforms and AP-binding mutants. Representative confocal images of N2a cells expressing BBS-tagged CaV2.2e37 isoforms at different time points after the start of an endocytosis assay, showing the disappearance of BTX488-labeled CaV2.2 from the cell surface. D, The endocytosis kinetics of CaV2.2e37 isoforms. All cell surface intensities were normalized to CaV2.2e37b at t = 0 min in each experiment. The time constants (τ) from fitting a single exponential were as follows (in min): e37a (red), 7.00 ± 1.23; e37b (blue), 11.6 ± 3.53 (n = 3 transfections). e37b (open blue circle) was kept at 4°C as a negative control after the start of endocytosis experiment. E, Left, Kinetics of CaV2.2e37 isoform net forward trafficking in the presence of BFA (open red circle, e37a + BFA; open blue circle, e37b+BFA). Controls without BFA at 60 min are also shown for each isoform (red circle, 37a; blue circle, 37b). Right, The net forward trafficking rate of CaV2.2e37a isoforms with and without BFA. The time constants (τ) of the single exponentials from Figure 5, B and E were determined, and the rates were obtained by the reciprocal of τ (1/τ) (red closed bar, CaV2.2e37a; red open bar, CaV2.2e37a + BFA; blue closed bar, CaV2.2e37b; blue open bar, CaV2.2e37b + BFA; n = 3 transfections). *p < 0.05 (one-way ANOVA, Bonferroni's post hoc test). Scale bars: A, C, 20 μm.
Table 2.
Effect of D2R activation on rate of endocytosis of CaV2.2e37 splice variants and mutants
| [Quin] | τ (min) |
|
|---|---|---|
| 0 nm | 100 nm | |
| 37a | 7.00 ± 1.23 (3) | n/a |
| 37a + D2R | 11.1 ± 1.43 (5) | 6.60 ± 0.22 (3) |
| 37b | 11.6 ± 3.53 (3) | n/a |
| 37b + D2R | 29.0 ± 4.89 (4) | 6.90 ± 0.36 (3) |
| 37a L/A | 13.8 ± 1.85 (4) | n/a |
| 37a L/A + D2R | 27.3 ± 4.43 (3) | 18.6 ± 1.62 (3) |
| 37a Y/A | 21.1 ± 3.53 (4) | n/a |
| 37a Y/A + D2R | 12.6 ± 2.20 (3) | 7.28 ± 0.90 (3) |
The endocytosis time constants (τ) for CaV2.2 splice variants 37a and 37b and the 37a mutants, either alone or in combination with the D2R, are shown. When the D2R was included, experiments were performed in the absence (middle) or presence (right) of the D2R agonist Quin (100 nm). Number of different separate experiments are given in parentheses, with at least 20 cells per time point for each experiment.
Brefeldin A reduces cell surface expression of CaV2.2 splice variants
The two main sources of transmembrane proteins inserted into the plasma membrane are (1) newly synthesized proteins from the endoplasmic reticulum (ER) and the Golgi apparatus (Guo et al., 2014) and (2) recycled proteins via recycling endosomes (Grant and Donaldson, 2009). BFA, which disrupts the structure of the Golgi apparatus and inhibits the translocation of proteins from the ER to the plasma membrane (Fujiwara et al., 1988; Lippincott-Schwartz et al., 1989), was then used to further elucidate the mechanism of differential CaV2.2e37a net forward trafficking. As expected, in the presence of BFA, the maximum level of CaV2.2 splice variants appearing on the plasma membrane was markedly reduced compared to the control condition (Fig. 5D). This shows that approximately half of the channel population at the plasma membrane originated from the recycling endosomes within the duration of these experiments. Furthermore, in the presence of BFA, the difference between CaV2.2e37a and CaV2.2e37b in the maximum cell surface level achieved was abolished. In addition, the kinetics of CaV2.2e37a net trafficking to the plasma membrane were markedly slowed compared to those in the absence of BFA (Fig. 5E). BFA inhibits ADP ribosylation factor 1 (Arf1), which is essential for the recruitment of AP-1, which mediates clathrin-dependent cargo sorting (Zhu et al., 1998; Ren et al., 2013). These observations raised the possibility that the greater forward trafficking and increased cell surface expression of CaV2.2e37a, relative to CaV2.2e37b, are due to differences in sequence of the proximal C terminus of CaV2.2 as a result of alternative splicing, and that the underlying mechanism may involve AP-mediated sorting.
AP-1 expression knockdown and the AP-1σ V98S dominant-negative mutant impair the cell surface expression of CaV2.2 isoforms
Members of the AP family play an important role in clathrin-mediated cellular sorting of protein cargoes (Bonifacino and Traub, 2003). AP-1 is involved in cargo sorting in the Golgi apparatus, via interaction between its μ1 (AP-1μ) subunit and YxxΦ motifs, where Φ is hydrophobic residue I, L, M, F, or V (Ohno et al., 1995), and interaction of the γ-σ1 hemicomplex (AP-1γσ) with [DE]xxxL[LI] motifs (Janvier et al., 2003). We noted that both these canonical motifs (YxxΦ and [DE]xxxL[LI]) are present in the e37a sequence DMYSLL (Fig. 1A), supporting the possibility of interaction with APs. Interestingly, Cav2.2e37a contains both motifs in an overlapping manner, whereas CaV2.2e37b contains only a noncanonical [DE]xxxL[LI] motif where LL is substituted by ML (Motta et al., 1995; Hofmann et al., 1999). BFA disrupts AP-1-mediated sorting in the Golgi network, and the reduction in the maximum level of CaV2.2 detected at the plasma membrane in the presence of BFA implicated a role for AP-1 in CaV2.2 trafficking to the plasma membrane.
To examine the involvement of AP-1 in CaV2.2 trafficking, AP-1γ shRNA was coexpressed with HA-tagged CaV2.2e37 isoforms to knock down the expression of the key subunit for AP-1 interaction with [DE]xxxL[LI] (Cheung and Cousin, 2012). The cell surface CaV2.2 levels were compared to a control in which scrambled AP-1γ shRNA was coexpressed. AP-1γ shRNA reduced the AP-1γ (or γ-adaptin) expression level by ∼50% (Fig. 6A) and caused a modest but significant reduction in the cell surface expression of both CaV2.2e37 isoforms (Fig. 6B). To confirm the interaction between AP-1 and CaV2.2, the AP-1σ dominant-negative mutant V98S was coexpressed with the CaV2.2e37 isoforms in N2a cells, to impair the interaction with [DE]xxxL[LI]. This construct has been shown to disrupt the somatodendritic trafficking of the cargoes in hippocampal neurons (Jain et al., 2015). AP-1σ V98S significantly reduced the cell surface expression of both CaV2.2e37 isoforms by ∼50%, relative to those that were coexpressed with the wild-type AP-1σ (Fig. 6C,D). The disrupted trafficking of both CaV2.2 isoforms, as a result of the impairment of AP-1 function, suggests that trafficking of both isoforms is mediated by AP-1 and that the noncanonical DxxxML motif in CaV2.2e37b may also function, albeit less efficiently, as an AP-1 binding motif and be involved in trafficking to the plasma membrane.
Figure 6.
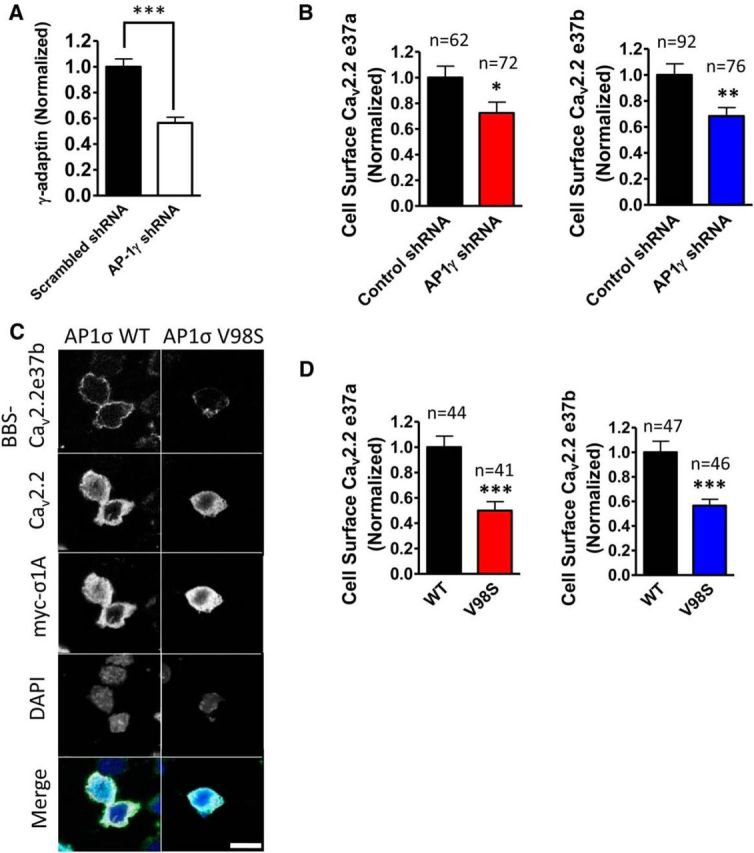
AP-1 knockdown and the dominant-negative AP-1 mutant reduce CaV2.2 trafficking to the plasma membrane. A, Knockdown of AP-1γ (or γ-adaptin) by AP-1 shRNA. AP-1γ shRNA expressed in N2a cells reduced the γ-adaptin expression level by ∼44%, compared to the γ-adaptin expression level in the scrambled shRNA condition. The expression of shRNA detected by mCerulean was comparable in all conditions (scrambled shRNA, closed bar, n = 56; AP-1 shRNA, open bar, n = 59; p < 0.0001). B, AP-1γ shRNA significantly reduces cell surface expression of both CaV2.2e37 isoforms. Cell surface CaV2.2 was normalized to the scrambled AP-1 shRNA control condition in each experiment. The expression of shRNA detected by mCerulean was comparable in all conditions (CaV2.2e37a, p = 0.0271; CaV2.2e37b, p = 0.0049). C, Confocal images of BBS-tagged CaV2.2e37b showing reduced cell surface expression (second panel) in the presence of AP-1σ V98S, compared to WT. Scale bar, 20 μm. D, Dominant-negative AP-1σ V98S mutant significantly reduces cell surface CaV2.2e37 isoforms. Cell surface CaV2.2 was normalized to the wild-type AP-1σ control condition in each experiment. The expression level of myc-tagged AP-1σ detected by anti-myc antibody was comparable in all conditions (CaV2.2e37a, p < 0.0001; CaV2.2e37b, p < 0.0001). n, Number of cells. *p < 0.05; **p < 0.01; ***p < 0.001 (Student's unpaired t test).
Mutations in AP binding motifs in the C terminus of CaV2.2e37a reduce the cell surface expression and the whole-cell currents through CaV2.2
Since the CaV2.2e37a sequence contains both YxxΦ and [DE]xxxL[LI] motifs, we mutated key residues to identify which motif is important in AP-1 interaction and to elucidate the mechanism of CaV2.2 channel trafficking. In total, 4 CaV2.2e37a mutants were created, mutating DMYSLL to DMASLL (Y/A), DMYSAL (L/A), DMYSAA (LL/AA), and DMASAA (YSLL/ASAA) (Fig. 7A). The L/A mutant is only able to interact with AP-1μ, and the Y/A mutant can only interact with AP-1γσ, whereas the LL/AA and YSLL/ASAA mutants completely abolish the interaction with AP-1 via these motifs. The cell surface and whole-cell expression levels of these four mutants and the wild-type CaV2.2e37a (all coexpressed with α2δ-1 and β1b) were determined by Western blot and immunocytochemistry (Fig. 7A,B). The plasma membrane expression levels of the L/A and Y/A mutants were ∼50% of the WT, and the LL/AA and YSLL/ASAA mutants were almost undetectable at the cell surface (Fig. 7B,C, left), despite the intracellular expression levels of all mutants showing no significant difference relative to the WT CaV2.2e37a (Fig. 7C, right). The overall expression levels of these mutants were also similar with each other in the Western blot, but slightly reduced particularly for the YSLL/ASAA mutant compared to the WT, although the reduction was not statistically significant (Fig. 7A). This may reflect the smaller number of cells in which intracellular CaV2.2 expression was detected in N2a cells, particularly for this mutant, as mutations in these motifs can lead to missorting of the proteins, which are then degraded (Braulke and Bonifacino, 2009). We therefore took the L/A, Y/A, and LL/AA mutants forward to further investigate the function and trafficking of these mutants.
Figure 7.
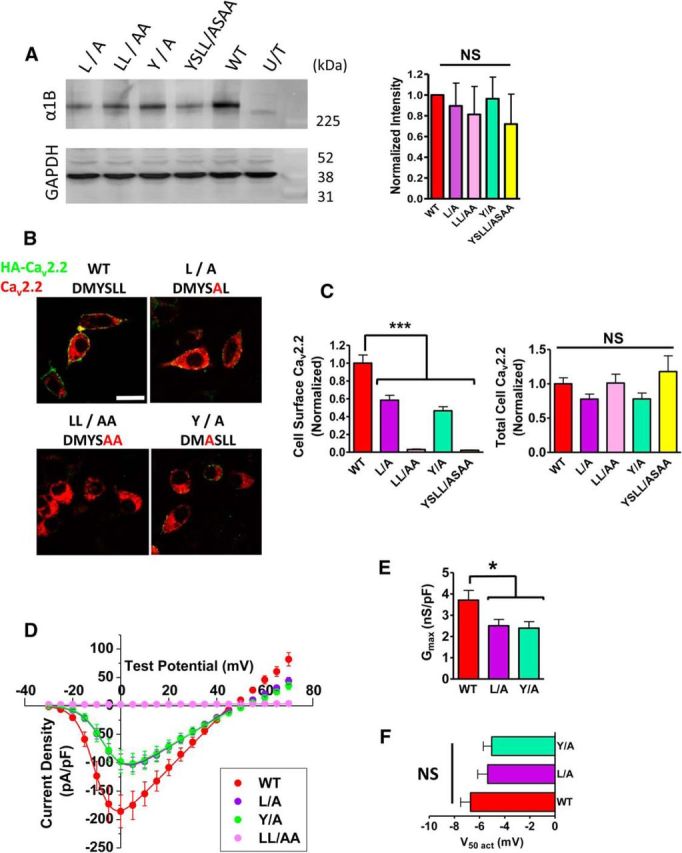
Effect of site-directed mutagenesis in adaptor protein binding motifs in CaV2.2e37a sequence. A, Left, Western blot analysis of CaV2.2e37a AP-binding mutants. Full-length CaV2.2 is detected in the whole-cell lysates (20 μg per lane) of tsA-201 cells expressing AP-binding mutants with α2δ-1 and β1b. In the untransfected negative control (U/T), cells were transfected with GFP. GAPDH staining shows equal protein loading in all lanes. Right, Quantification of band intensities of the Western blots. The intensities of CaV2.2e37a AP-binding mutants were normalized against the WT in each experiment after the background subtraction. The protein expression of CaV2.2e37a AP-binding mutants and WTs was not significantly different (n = 4). B, Confocal images showing N2a cells expressing HA-tagged AP-binding mutants. Scale bar, 20 μm. C, Cell surface expression of AP-binding mutants. The values were normalized to the average HA fluorescence intensity of wild-type CaV2.2e37a (WT) from each experiment. Left, Cell surface: red, WT (n = 64); purple, L/A (n = 82); pink, LL/AA (n = 43); green, Y/A (n = 94); yellow, YSLL/ASAA (n = 7). Right, Total CaV2.2 levels were not significantly different in all conditions. Only a few cells that were expressing CaV2.2 from YSLL/ASAA mutation were detected, due to a low expression of CaV2.2 in N2a cells. D, Whole-cell current density of AP-binding mutants. The peak current densities at +0 mV are as follows (in pA/pF); WT (red), −185.7 ± 28.7 (n = 24); L/A (purple), −103.2 ± 12.8 (n = 27); Y/A (green), −101.9 ± 18.3 (n = 30); LL/AA (pink), 2.44 ± 0.34 (n = 4). E, Gmax of AP-binding mutants is also significantly reduced, similarly to the cell surface expression. F, V50,act of CaV2.2e37a AP-1 binding mutants. V50 activation was not altered by the mutations [p = 0.27; WT (red), n = 22; L/A (purple), n = 27; Y/A (green), n = 30]. n, Number of cells. *p < 0.05; ***p < 0.001 (one-way ANOVA, Bonferroni's post hoc test).
To investigate whether the reduced plasma membrane expression of these CaV2.2 mutants leads to a parallel reduction in function, we recorded the whole-cell current of the L/A, Y/A, and LL/AA mutants expressed in tsA-201 cells in the presence of α2δ-1 and β1b. No current was detected from the LL/AA mutant (Fig. 7D), as predicted from the imaging experiments (Fig. 7C). The L/A and Y/A mutations caused the CaV2.2 peak currents and Gmax to be significantly reduced, compared to the WT CaV2.2e37a (Fig. 7D,E). The V50 activation voltages were not altered for these mutants (Fig. 7F). These results demonstrate that AP interaction is involved in the trafficking of CaV2.2e37a to the cell surface in the presence of the auxiliary subunits, and the reduced cell current density is due to the lower density of channels in the plasma membrane.
Expression of CaV2.2 AP-1 binding motif mutants in DRG neurons is reduced at the plasma membrane of the soma and in the neurites as a result of diminished net forward trafficking
To confirm that the mutations in the AP-1 binding motifs at the proximal C terminus of CaV2.2 have an effect on channel trafficking in neurons, these mutant CaV2.2 channels were also tagged with GFP at the N terminus. DRG neurons were transfected with HA-tagged GFP-CaV2.2 mutants in the presence of α2δ-1 and β1b (Fig. 8A). Immunostaining for HA revealed that in the cell bodies of DRG neurons, expression of all mutants at the plasma membrane was reduced, particularly for the LL/AA mutant, without significantly affecting the total expression levels of the channels (Fig. 8B). Furthermore, a significantly lower level of these mutants was observed in the neurite compartment, and expression in neurites was confined much closer to the cell bodies, relative to WT (Fig. 8C–E), suggesting that these motifs are crucial for CaV2.2 trafficking along the neurites as well.
Figure 8.
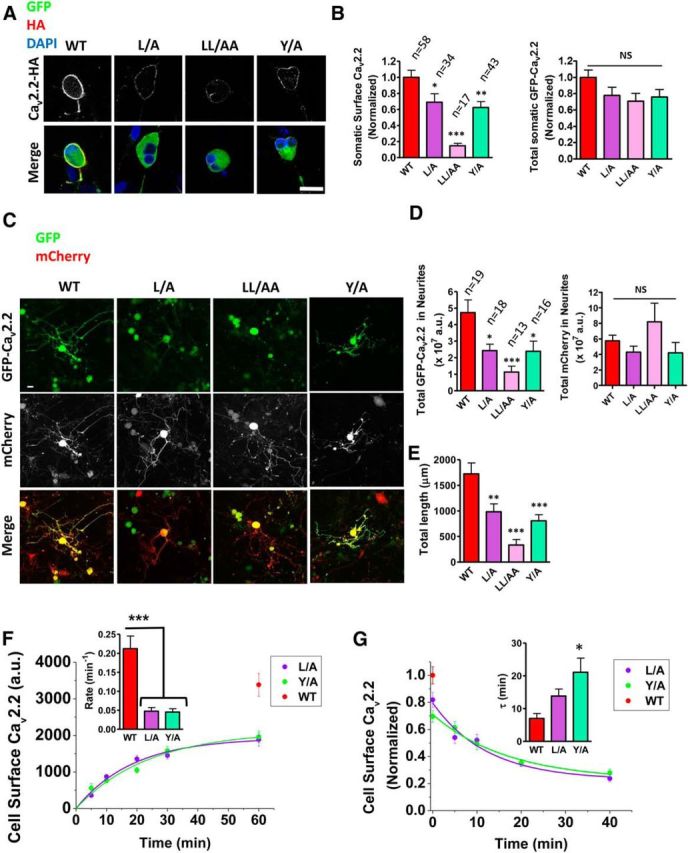
CaV2.2 AP-1 binding motif mutants exhibit reduced trafficking to the cell surface of DRG soma and to DRG neurites. A, Confocal images of DRG somata expressing GFP-HA-tagged CaV2.2e37a AP-binding mutants. B, Cell surface expression of AP-binding mutants. The values were normalized to the average HA fluorescence intensity of wild-type CaV2.2e37a from each experiment. Normalized total GFP fluorescence intensities in the cell were not significantly different (p = 0.14). C, Confocal images of DRG neurons expressing GFP-HA-tagged CaV2.2e37a AP-binding mutants with free mCherry in the neuronal processes. GFP is also expressed in some nonneuronal cells. D, Total fluorescence of GFP-HA-CaV2.2 AP-binding mutants and free mCherry in the DRG neurites (in ×107 a.u.). The total mCherry fluorescence values in the neurites were not significantly different (p = 0.14). E, Total length of DRG neurites expressing GFP-HA-CaV2.2 AP-binding mutants and WT. The AP-binding mutants were expressed in neurites significantly closer to the soma than the WT. F, The net forward trafficking kinetics of CaV2.2 AP-1 binding mutants. Net forward trafficking rates in the inset are as follows (in min−1): WT (red), 0.212 ± 0.027 (from Fig. 4B); L/A (purple), 0.048 ± 0.009; Y/A (green), 0.045 ± 0.008 (n = 3 to 5 transfections). G, The endocytosis kinetics of CaV2.2 AP-binding mutants. Cell surface L/A (purple) and Y/A (green) mutants were normalized to the WT at t = 0 min (red) in each experiment. The inset shows the time constants τ (in min): L/A (purple), 13.8 ± 1.85; Y/A (green), 21.1 ± 3.53 (n = 3 to 4 transfections). Scale bars: A, C, 20 μm. n, Number of cells. *p < 0.05; **p < 0.01; ***p < 0.001 (one-way ANOVA, Bonferroni's post hoc test).
The L/A and Y/A mutants were also tagged with the exofacial BBS tag to investigate how these mutations affect intracellular trafficking of CaV2.2e37a. The appearance of the mutant channels on the plasma membrane was significantly slower than for WT CaV2.2e37a, leading to a reduction in the maximum density of cell surface channels (Fig. 8F). The slower overall rates of forward trafficking kinetics for these mutants, compared to WT CaV2.2e37a (Fig. 8F, inset), were similar to that for WT CaV2.2e37a in the presence of BFA (Fig. 5E).
Furthermore, the average time constant for endocytosis was approximately doubled for the CaV2.2e37a L/A mutant, and more than tripled for the Y/A mutant, compared to WT CaV2.2e37a (Fig. 8G, Table 2). This observation could be explained by the action of AP-2, which is also able to recognize and interact with both YxxΦ and [DE]xxxL[LI] and predominantly mediates clathrin-dependent endocytosis (Nesterov et al., 1999; Motley et al., 2003). It is therefore possible that the YxxΦ motif plays a more dominant role than the [DE]xxxL[LI] motif in AP-2-mediated endocytosis of CaV2.2e37a. In summary, AP binding motifs at the C terminus of CaV2.2 control the intracellular trafficking of CaV2.2, and mutations to these sites disrupt the trafficking to the cell surface and to the distal ends of neurites.
Effect of D2R coexpression and activation on trafficking of CaV2.2 splice variants
We next examined whether CaV2.2 endocytosis stimulated by activation of GPCRs would be differentially affected for the CaV2.2e37 isoforms. Previous studies demonstrated that both D1 and D2 dopamine receptors directly interact with CaV2.2 via intracellular regions to modulate the channel properties, cell surface expression, and endocytosis (Kisilevsky and Zamponi, 2008; Kisilevsky et al., 2008). We therefore coexpressed the CaV2.2e37 isoforms (with α2δ-1 and β1b), together with D2R in N2a cells, to first determine the effect of D2R on cell surface expression of the two CaV2.2e37 isoforms. We found that D2R had no effect on the cell surface expression of CaV2.2e37a, and modestly enhanced the cell surface expression of CaV2.2e37b (Fig. 9A). Furthermore, upon D2R activation by the specific agonist Quin, the amount of both Cav2.2e37 isoforms on the cell surface was significantly reduced by ∼30% relative to the control within 30 min (Fig. 9B,C), which is likely to represent endocytosis. To elucidate the differential effect of D2R on the CaV2.2e37 isoform cell surface expression, the rate at which these channels undergo endocytosis with D2R was determined using BBS-tagged CaV2.2e37 isoforms in the presence or absence of Quin, and these rates were compared with the previously determined basal endocytosis without D2R (Fig. 5D, Table 2). The endocytosis rate of CaV2.2e37b was significantly slowed by the presence of D2R (Fig. 9B, Table 2). CaV2.2e37b then internalized more rapidly in the presence of Quin, with a τ value similar to that determined for CaV2.2e37b alone. On the other hand, the basal endocytosis rate of CaV2.2e37a was not significantly affected by coexpression of D2R, compared to CaV2.2e37a alone (Fig. 9C, Table 2), as predicted from the previous comparison of cell surface expression levels (Fig. 9A). In contrast to the effect of Quin to reduce the overall cell surface expression of CaV2.2e37a channels, Quin treatment did not significantly accelerate CaV2.2e37a endocytosis, possibly reflecting a minimum limit in the determination of endocytosis rate by this protocol.
Figure 9.
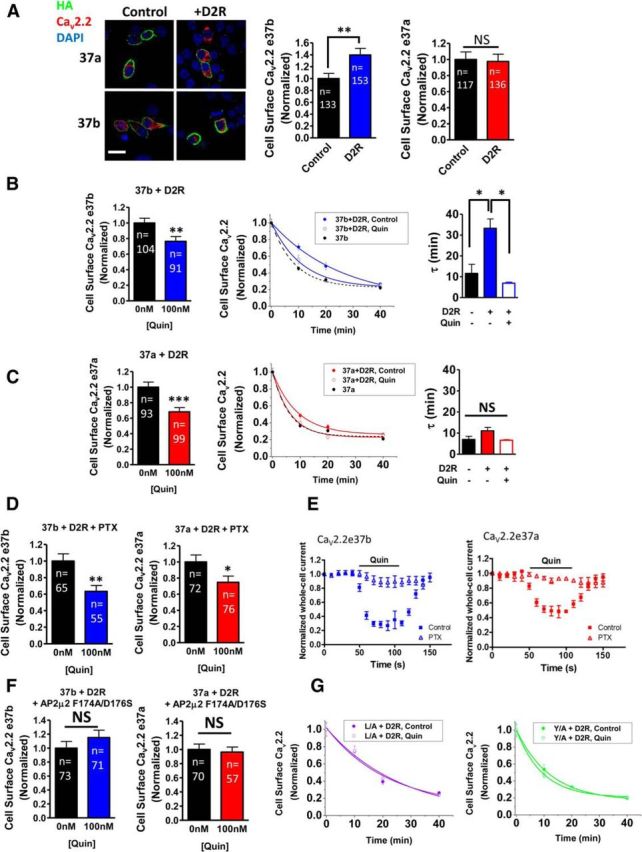
Effect of D2R expression and activation on cell surface CaV2.2e37 isoforms. A, Left, Confocal images of N2a cells expressing HA-tagged CaV2.2 with or without D2R. Scale bar, 20 μm. Right, Cell surface CaV2.2 with D2R is normalized to the control condition expressing an empty vector in each experiment. D2R significantly increased cell surface CaV2.2e37b (p = 0.0064), whereas cell surface CaV2.2e37a was not affected by D2R (p = 0.85). B, Left, Cell surface CaV2.2e37b in the presence of D2R, with or without 100 nm Quin (p = 0.0067). Middle, CaV2.2e37b endocytosis rate was slowed by the presence of D2R and accelerated by D2R activation (closed blue circle, e37b + D2R; open blue circle, e37b + D2R + Quin; black circle, e37b; from Fig. 5D). Right, The endocytosis kinetics (black bar, e37b; closed blue bar, e37b + D2R; open blue bar, e37b + D2R + Quin; n = 3 to 5 transfections; p < 0.05, one-way ANOVA, Bonferroni's post hoc test). C, Left, Cell surface CaV2.2e37a in the presence of D2R, with or without 100 nm Quin (p = 0.0002). Middle, e37a endocytosis was not significantly changed by the presence of D2R nor by D2R activation (closed red circle, e37a + D2R; open red circle, e37a + D2R + Quin; black circle, 37a; from Fig. 5D). Right, The endocytosis kinetics (black bar, e37a; closed red bar, e37a + D2R; open red bar, e37a + D2R + Quin; n = 3 to 5 transfections). D, Cell surface CaV2.2 in the presence of D2R, with or without 100 nm Quin after PTX treatment (37b, p = 0.0019; 37a, p = 0.0302). E, PTX blocks CaV2.2 inhibition mediated by D2R activation. PTX treatment removed the inhibition of CaV2.2 whole-cell current by 100 nm Quin application to activate D2R [CaV2.2e37b control (blue closed squares), n = 23; CaV2.2e37b with PTX (blue open triangles), n = 10; CaV2.2e37a control (red closed squares), n = 22; CaV2.2e37a control (red open triangles), n = 3]. F, Cell surface CaV2.2 in the presence of D2R and dominant-negative AP-2μ2 mutant F174A/D176S, with or without 100 nm Quin (37b, p = 0.2877; 37a, p = 0.7246). G, Endocytosis of CaV2.2e37a L/A and Y/A mutants was not accelerated by D2R activation. The endocytosis kinetics are shown for L/A + D2R (closed purple circle) and L/A + D2R + Quin (open purple circle) in the left panel and Y/A + D2R (closed green circle) and Y/A + D2R + Quin (open green circle) in the right. For all experiments, n = 3 to 5 transfections. n, Number of cells. *p < 0.05; **p < 0.01; ***p < 0.001 (Student's unpaired t test).
This effect of Quin was not blocked by pretreatment with PTX (Fig. 9D), indicating that D2R activity-mediated endocytosis is independent of the direct action of Gβγ on CaV2.2, as PTX blocks voltage-dependent inhibition of CaV2.2 by Quin (Fig. 9E). Receptor sequestration has been reported for a number of GPCRs following activation, which is mediated by the recruitment of β-arrestin to the activated receptor (Krupnick and Benovic, 1998). β-arrestin targets GPCRs for clathrin-dependent endocytosis by directly interacting with AP-2 (Goodman et al., 1996; Zhang et al., 1996; Laporte et al., 1999, 2000). To test whether blocking clathrin-mediated endocytosis also inhibits D2R activation-induced CaV2.2 endocytosis, the dominant-negative mutant of the AP-2μ2 subunit F174A/D176S was coexpressed; this construct has been shown to impair transferrin endocytosis (Motley et al., 2006). In the presence of the AP-2μ2 mutant, CaV2.2 endocytosis was not observed after Quin treatment (Fig. 9F). To confirm the involvement of AP-2 in D2R-mediated endocytosis of CaV2.2, the endocytosis rates of CaV2.2e37a L/A and Y/A mutants with D2R were examined. Quin treatment did not alter the endocytosis of either mutant (Fig. 9G, Table 2). These results indicate that disrupting the interaction between AP-2 and CaV2.2 blocks D2R agonist-induced endocytosis. In summary, these data suggest that (1) the D2R has a differential effect on CaV2.2e37 isoforms at the cell surface, as it reduces the endocytosis rate of CaV2.2e37b, but not e37a, and (2) activation of the D2R causes both CaV2.2e37 isoforms to internalize via β-arrestin-mediated recruitment of clathrin, which requires interaction between AP-2 and CaV2.2.
Discussion
AP-1 mediated regulation of CaV2.2 splice variant trafficking
CaV2.2 trafficking is mediated by interaction with its auxiliary subunits and various intracellular proteins (Kaeser et al., 2011; Dolphin, 2012). Our data demonstrate enhanced trafficking of CaV2.2e37a compared to the e37b splice variant, both to the plasma membrane and to neuronal processes where these channels are physiologically important. The 37a exon contains interaction motifs for both the μ1 subunit and γ-σ1 hemicomplex of AP-1, which are overlapping (DMYSLL). However, an AP-1 complex would be unable to bind both simultaneously due to conformational constraints (Heldwein et al., 2004; Ren et al., 2013). The complete abolition of both motifs severely disrupted trafficking of CaV2.2e37a to the cell membrane and DRG neurites, demonstrating the importance of these AP-1 interaction sites in the proximal C terminus of CaV2.2. Furthermore, [DE]xxxL[LI] is also present in other voltage-gated calcium channels such as CaV1.3, 1.4 and CaV2.1(e37a) in the proximal C terminus (Table 3). On the other hand, the CaV2.2e37b splice variant has a noncanonical [DE]xxxL[LI] motif, where L[LI] is substituted by ML (DMEFML), which is indicated to be a less efficient signal compared with the canonical motif (Motta et al., 1995; Hofmann et al., 1999). In addition, the e37b sequence lacks YxxΦ. This may explain why CaV2.2e37b channels are less efficiently trafficked to the plasma membrane and to the DRG neurites, compared to CaV2.2e37a, which contains two strong signals for binding to AP-1 in this exon. Mutating CaV2.2e37a from DMYSLL to DMFSLL also reduced the current density, which was indistinguishable from that of CaV2.2e37b (Raingo et al., 2007), supporting this hypothesis.
Table 3.
[DE]xxxL[LI] and YxxΦ motifs in the C-terminus of CaV channels
| CaV1.2 | GRIKHLDVVTLLRRIQ |
| CaV1.3 | GRIKHLDVVTLLRRIQ |
| CaV2.1 (e37a) | GRIHYKDMYSLLRVIS |
| CaV2.1 (e37b) | GRMPYLDMYQMLRHMS |
| CaV2.2 (e37a) | CRIHYKDMYSLLRCIA |
| CaV2.2 (e37b) | GRISYNDMFEMLKHMS |
The [DE]xxxL[LI] and YxxΦ motifs in the proximal C-terminus of CaV channels are indicated in bold.
The proximity of these motifs in the C terminus of CaV2.2 to the membrane may also create a favorable site for AP-1 interaction. This has been demonstrated for AP-2, which is recruited to the plasma membrane via phosphatidylinositol 4,5-bisphosphate interaction. This causes AP-2 to undergo a “locked” to “open” conformational change, which exposes its motif-binding sites (Jackson et al., 2010). Although phosphoinositides such as phosphatidylinositol 4-phosphate, prevalent in the Golgi, are alone insufficient for the recruitment of AP-1, the close proximity of these motifs to the membrane is probably important, as membrane-associated Arf1 brings AP-1 close to the Golgi membrane, where it unlocks the AP-1 conformation to allow for cooperative binding of the cargo and phosphatidylinositol 4-phosphate (Stamnes and Rothman, 1993; Crottet et al., 2002; Ren et al., 2013).
The overlapping nature of the AP-1 binding motifs in CaV2.2e37a is unprecedented; however, abolishing either of the binding sites for AP-1μ1 and γ-σ1 in CaV2.2e37a, by mutating the key amino acids, led to a partial loss of cell surface expression and trafficking to the DRG neurites. This indicates that both of the AP-1 subunits separately have the ability to interact with the overlapping motif in e37a and are able to partially compensate for the trafficking defect in the e37a single mutants, when only one of the potential binding sites is available. However, when both motifs are available for interaction, one of the AP-1 subunits may have a higher affinity than the other toward its corresponding motif, to mediate more efficient trafficking in a native state. Moreover, other intracellular regions of CaV2.2 also contain possible interaction sites for APs. For example, there is one YxxΦ motif in the N terminus (Y59) and two in the II–III loop (Y811 and Y1154), whereas there is only one other [DE]xxxL[LI] site, which is in the distal C terminus (E2256) in CaV2.2. All of these sites are conserved in human, mouse, rat, rabbit, and chicken CaV2.2. In the case of AP-2, binding to [DE]xxxL[LI], YxxΦ, and phosphatidylinositol 4,5-bisphosphate is essential for ensuring its high affinity for the cargo in the membrane (Jackson et al., 2010). CaV2.2e37a may be able to present both motifs in the e37a sequence to the AP-1 complex studied here, and as a result the AP-1 complex is able to interact with the conformationally most favorable counterpart motif for mediating effective trafficking. No mutational or interaction studies have been conducted on the other sites in Cav2.2 so far, and it will now be important to investigate the involvement of these sites in AP-mediated trafficking.
Although it is not clear which AP-1 subunit mediates trafficking more effectively in the native state, it has been shown for AP-2 that it interacts with YxxΦ with a higher affinity than [DE]xxxL[LI] (Jackson et al., 2010). This was also found in our experiments where the CaV2.2e37a Y/A mutant showed a markedly slower endocytosis rate, indicating that the YxxΦ motif may also interact with AP-2μ2 subunits, which are involved predominantly in clathrin-mediated endocytosis (Nesterov et al., 1999). Our findings suggest that in the case of endocytosis, YxxΦ may play a more important role than [DE]xxxL[LI] in mediating CaV2.2 endocytosis.
Both shRNA knockdown of AP-1γ and expression of the dominant-negative AP-1σ mutant V98S reduced trafficking of both isoforms to the plasma membrane. This provides direct evidence for AP-1 mediating trafficking for both isoforms of CaV2.2, e37a and e37b. Although other possible AP-interaction sites mentioned above potentially mediate CaV2.2 trafficking, the differential trafficking observed between the e37 isoforms in this study suggests that this particular motif may play a more important role than the others. Nevertheless, incomplete inhibition suggests that CaV2.2 trafficking may also involve non-clathrin-mediated mechanisms, such as lipid raft- and caveolae-mediated trafficking (Le Roy and Wrana, 2005; Parton and Simons, 2007). Indeed, CaV2 channels colocalize with caveolin and flotillin-1 in the presence of β and α2δ subunits, and are present in lipid rafts (Davies et al., 2006; Robinson et al., 2010). Overexpression studies of AP-1 dominant-negative mutants have indicated previously that AP-1 mediates somatodendritic trafficking of transmembrane receptors in central neurons such as hippocampal neurons (Farías et al., 2012; Jain et al., 2015). Our CaV2.2e37a AP-1 binding site mutants demonstrate that AP-1 may also play an important role in axonal trafficking in DRG neurons, since these are pseudounipolar and do not form dendrites, and therefore binding of AP-1 to these sites may modulate the presence of these channels at the presynaptic membrane.
Interaction between CaV2.2 splice variants and dopamine receptors and effects of receptor activation
Direct interaction between CaV2.2 and dopamine receptors may be important in regulating the surface expression of CaV2.2 (Kisilevsky and Zamponi, 2008; Kisilevsky et al., 2008). We find in N2a cells that coexpression of D2R does not increase the cell-surface expression of CaV2.2e37a and produces only a modest increase for CaV2.2e37b. Our results show that the rate of endocytosis of CaV2.2e37b is considerably slowed by the D2R; thus, the channels are more stable and they accumulate at the cell surface. Surprisingly, this stabilizing effect at the plasma membrane diminishes upon D2R activation, and CaV2.2e37b internalizes at an increased rate similar to that for the channel expressed in the absence of the receptor.
There are two possible explanations for this observation: (1) the activated D2R-CaV2.2 complex internalizes together at an accelerated rate; (2) the activated D2R undergoes a conformational change and dissociates from CaV2.2 at the cell surface, and they internalize separately at their own native rates. How D2 receptors decrease the endocytosis rate of CaV2.2e37b channels is still not clear; however, the colocalization of CaV2.2 and D2R via direct interaction of their intracellular regions suggested previously (Kisilevsky and Zamponi, 2008) implies that APs may be able to bind to the cargo motifs in CaV2.2 and D2R simultaneously to regulate their cotrafficking. Indeed, the D2R contains YxxΦ motifs in its intracellular loops 2 and 3 near the plasma membrane, but does not contain [DE]xxxL[LI] (Namkung and Sibley, 2004). In the case of endocytosis, the AP-2 μ subunit could potentially interact with either of these YxxΦ motifs in D2R, whereas the AP-2 α-σ2 hemicomplex could interact with the DxxxML motif in the e37b sequence to mediate their cointernalization from the cell surface. Our data support this concept, since mutating the DxxxLL motif in CaV2.2e37a to DxxxAL slows its endocytosis only in the additional presence of the D2R, whereas mutating YxxΦ motif in the C terminus of CaV2.2e37a does not (Fig. 9C,G, Table 2). We have also noted that the N terminus of CaV2.2 contains another YxxΦ motif, and this is adjacent to the region important for G-protein modulation (Page et al., 1998). Furthermore, upon D2R activation, β-arrestin may be recruited to the activated D2R, where it acts as an adaptor for AP-2-mediated endocytosis (Goodman et al., 1996; Laporte et al., 2000, 2002; Lan et al., 2009). Here we provide new evidence that disrupting the recruitment of functional AP-2 by overexpressing the dominant-negative mutant AP-2μ2 and mutations in [DE]xxxL[LI] and YxxΦ motifs inhibit CaV2.2 endocytosis upon D2R activation, demonstrating that AP-2 is required for CaV2.2 endocytosis mediated by D2R activation.
In summary, our data demonstrate novel evidence that CaV2.2 trafficking in cell bodies and neurites is fine-tuned by alternative splicing of exon 37, and is mediated differentially by AP-1. Furthermore, alternative splicing of exon 37 also modulates the effect on trafficking of CaV2.2 resulting from D2R interaction and activation. Blocking the interaction of APs with the binding motif in the proximal C terminus of CaV2.2 may modulate calcium entry into neurons and the response to dopamine receptor activation.
Footnotes
This work was supported by a Wellcome Trust senior Investigator award (098360/Z/12/Z) to A.C.D., N.M. was a PhD student supported by a Biotechnology and Biological Sciences Research Council PhD award in conjunction with Convergence Pharmaceuticals (BBSRC DTG Quota Case 1111490814462). We thank Dr. M.A. Cousin for providing AP-1 shRNA constructs, Dr. J.S. Bonifacino for providing AP-1σ1 cDNA constructs, and Dr. M.S. Robinson for providing AP-2μ2 cDNA constructs. We also thank J.S. Cassidy and W. Pratt for molecular biology assistance and providing constructs, and K. Chaggar for cell culture support.
The authors declare no competing financial interests.
This is an Open Access article distributed under the terms of the Creative Commons Attribution License Creative Commons Attribution 4.0 International, which permits unrestricted use, distribution and reproduction in any medium provided that the original work is properly attributed.
References
- Altier et al., 2006.Altier C, Khosravani H, Evans RM, Hameed S, Peloquin JB, Vartian BA, Chen L, Beedle AM, Ferguson SS, Mezghrani A, Dubel SJ, Bourinet E, McRory JE, Zamponi GW. ORL1 receptor–mediated internalization of N-type calcium channels. Nat Neurosci. 2006;9:31–40. doi: 10.1038/nn1605. [DOI] [PubMed] [Google Scholar]
- Altier et al., 2007.Altier C, Dale CS, Kisilevsky AE, Chapman K, Castiglioni AJ, Matthews EA, Evans RM, Dickenson AH, Lipscombe D, Vergnolle N, Zamponi GW. Differential role of N-type calcium channel splice isoforms in pain. J Neurosci. 2007;27:6363–6373. doi: 10.1523/JNEUROSCI.0307-07.2007. [DOI] [PMC free article] [PubMed] [Google Scholar]
- Andrade et al., 2010.Andrade A, Denome S, Jiang YQ, Marangoudakis S, Lipscombe D. Opioid inhibition of N-type Ca2+ channels and spinal analgesia couple to alternative splicing. Nat Neurosci. 2010;13:1249–1256. doi: 10.1038/nn.2643. [DOI] [PMC free article] [PubMed] [Google Scholar]
- Bell et al., 2004.Bell TJ, Thaler C, Castiglioni AJ, Helton TD, Lipscombe D. Cell-specific alternative splicing increases calcium channel current density in the pain pathway. Neuron. 2004;41:127–138. doi: 10.1016/S0896-6273(03)00801-8. [DOI] [PubMed] [Google Scholar]
- Bonifacino and Traub, 2003.Bonifacino JS, Traub LM. Signals for sorting of transmembrane proteins to endosomes and lysosomes. Annu Rev Biochem. 2003;72:395–447. doi: 10.1146/annurev.biochem.72.121801.161800. [DOI] [PubMed] [Google Scholar]
- Bourinet et al., 1999.Bourinet E, Soong TW, Sutton K, Slaymaker S, Mathews E, Monteil A, Zamponi GW, Nargeot J, Snutch TP. Splicing of α1A subunit gene generates phenotypic variants of P- and Q-type calcium channels. Nat Neurosci. 1999;2:407–415. doi: 10.1038/8070. [DOI] [PubMed] [Google Scholar]
- Braulke and Bonifacino, 2009.Braulke T, Bonifacino JS. Sorting of lysosomal proteins. Biochim Biophys Acta. 2009;1793:605–614. doi: 10.1016/j.bbamcr.2008.10.016. [DOI] [PubMed] [Google Scholar]
- Cassidy et al., 2014.Cassidy JS, Ferron L, Kadurin I, Pratt WS, Dolphin AC. Functional exofacially tagged N-type calcium channels elucidate the interaction with auxiliary α2δ-1 subunits. Proc Natl Acad Sci U S A. 2014;111:8979–8984. doi: 10.1073/pnas.1403731111. [DOI] [PMC free article] [PubMed] [Google Scholar]
- Castiglioni et al., 2006.Castiglioni AJ, Raingo J, Lipscombe D. Alternative splicing in the C-terminus of CaV2.2 controls expression and gating of N-type calcium channels. J Physiol. 2006;576:119–134. doi: 10.1113/jphysiol.2006.115030. [DOI] [PMC free article] [PubMed] [Google Scholar]
- Cheung and Cousin, 2012.Cheung G, Cousin MA. Adaptor protein complexes 1 and 3 are essential for generation of synaptic vesicles from activity-dependent bulk endosomes. J Neurosci. 2012;32:6014–6023. doi: 10.1523/JNEUROSCI.6305-11.2012. [DOI] [PMC free article] [PubMed] [Google Scholar]
- Crottet et al., 2002.Crottet P, Meyer DM, Rohrer J, Spiess M. ARF1·GTP, tyrosine-based signals, and phosphatidylinositol 4,5-bisphosphate constitute a minimal machinery to recruit the AP-1 clathrin adaptor to membranes. Mol Biol Cell. 2002;13:3672–3682. doi: 10.1091/mbc.E02-05-0309. [DOI] [PMC free article] [PubMed] [Google Scholar]
- Davies et al., 2006.Davies A, Douglas L, Hendrich J, Wratten J, Tran Van Minh A, Foucault I, Koch D, Pratt WS, Saibil HR, Dolphin AC. The calcium channel alpha2delta-2 subunit partitions with CaV2.1 into lipid rafts in cerebellum: implications for localization and function. J Neurosci. 2006;26:8748–8757. doi: 10.1523/JNEUROSCI.2764-06.2006. [DOI] [PMC free article] [PubMed] [Google Scholar]
- De Waard et al., 1994.De Waard M, Pragnell M, Campbell KP. Ca2+ channel regulation by a conserved β subunit domain. Neuron. 1994;13:495–503. doi: 10.1016/0896-6273(94)90363-8. [DOI] [PubMed] [Google Scholar]
- Dolphin, 2012.Dolphin AC. Calcium channel auxiliary α2δ and β subunits: trafficking and one step beyond. Nat Rev Neurosci. 2012;13:542–555. doi: 10.1038/nrn3311. [DOI] [PubMed] [Google Scholar]
- Dubel et al., 1992.Dubel SJ, Starr TV, Hell J, Ahlijanian MK, Enyeart JJ, Catterall WA, Snutch TP. Molecular cloning of the alpha-1 subunit of an omega-conotoxin-sensitive calcium channel. Proc Natl Acad Sci U S A. 1992;89:5058–5062. doi: 10.1073/pnas.89.11.5058. [DOI] [PMC free article] [PubMed] [Google Scholar]
- Evans et al., 2010.Evans RM, You H, Hameed S, Altier C, Mezghrani A, Bourinet E, Zamponi GW. Heterodimerization of ORL1 and opioid receptors and its consequences for N-type calcium channel regulation. J Biol Chem. 2010;285:1032–1040. doi: 10.1074/jbc.M109.040634. [DOI] [PMC free article] [PubMed] [Google Scholar]
- Farías et al., 2012.Farías GG, Cuitino L, Guo X, Ren X, Jarnik M, Mattera R, Bonifacino JS. Signal-mediated, AP-1/clathrin-dependent sorting of transmembrane receptors to the somatodendritic domain of hippocampal neurons. Neuron. 2012;75:810–823. doi: 10.1016/j.neuron.2012.07.007. [DOI] [PMC free article] [PubMed] [Google Scholar]
- Fujiwara et al., 1988.Fujiwara T, Oda K, Yokota S, Takatsuki A, Ikehara Y. Brefeldin A causes disassembly of the Golgi complex and accumulation of secretory proteins in the endoplasmic reticulum. J Biol Chem. 1988;263:18545–18552. [PubMed] [Google Scholar]
- Gao et al., 2000.Gao T, Bunemann M, Gerhardstein BL, Ma H, Hosey MM. Role of the C terminus of the α1C(CaV1.2) subunit in membrane targeting of cardiac L-type calcium channels. J Biol Chem. 2000;275:25436–25444. doi: 10.1074/jbc.M003465200. [DOI] [PubMed] [Google Scholar]
- Goodman et al., 1996.Goodman OB, Jr, Krupnick JG, Santini F, Gurevich VV, Penn RB, Gagnon AW, Keen JH, Benovic JL. β-Arrestin acts as a clathrin adaptor in endocytosis of the β2-adrenergic receptor. Nature. 1996;383:447–450. doi: 10.1038/383447a0. [DOI] [PubMed] [Google Scholar]
- Grant and Donaldson, 2009.Grant BD, Donaldson JG. Pathways and mechanisms of endocytic recycling. Nat Rev Mol Cell Biol. 2009;10:597–608. doi: 10.1038/nrm2755. [DOI] [PMC free article] [PubMed] [Google Scholar]
- Guo et al., 2014.Guo Y, Sirkis DW, Schekman R. Protein sorting at the trans-Golgi network. Annu Rev Cell Dev Biol. 2014;30:169–206. doi: 10.1146/annurev-cellbio-100913-013012. [DOI] [PubMed] [Google Scholar]
- Gurnett et al., 1996.Gurnett CA, De Waard M, Campbell KP. Dual function of the voltage-dependent Ca2+ channel α2δ subunit in current stimulation and subunit interaction. Neuron. 1996;16:431–440. doi: 10.1016/S0896-6273(00)80061-6. [DOI] [PubMed] [Google Scholar]
- Hall et al., 2013.Hall DD, Dai S, Tseng PY, Malik Z, Nguyen M, Matt L, Schnizler K, Shephard A, Mohapatra DP, Tsuruta F, Dolmetsch RE, Christel CJ, Lee A, Burette A, Weinberg RJ, Hell JW. Competition between α-actinin and Ca2+-calmodulin controls surface retention of the L-type Ca2+ channel CaV1.2. Neuron. 2013;78:483–497. doi: 10.1016/j.neuron.2013.02.032. [DOI] [PMC free article] [PubMed] [Google Scholar]
- Han et al., 2011.Han Y, Kaeser PS, Südhof TC, Schneggenburger R. RIM determines Ca2+ channel density and vesicle docking at the presynaptic active zone. Neuron. 2011;69:304–316. doi: 10.1016/j.neuron.2010.12.014. [DOI] [PMC free article] [PubMed] [Google Scholar]
- Heldwein et al., 2004.Heldwein EE, Macia E, Wang J, Yin HL, Kirchhausen T, Harrison SC. Crystal structure of the clathrin adaptor protein 1 core. Proc Natl Acad Sci U S A. 2004;101:14108–14113. doi: 10.1073/pnas.0406102101. [DOI] [PMC free article] [PubMed] [Google Scholar]
- Hibino et al., 2002.Hibino H, Pironkova R, Onwumere O, Vologodskaia M, Hudspeth AJ, Lesage F. RIM binding proteins (RBPs) couple Rab3-interacting molecules (RIMs) to voltage-gated Ca2+ channels. Neuron. 2002;34:411–423. doi: 10.1016/S0896-6273(02)00667-0. [DOI] [PMC free article] [PubMed] [Google Scholar]
- Hirning et al., 1988.Hirning LD, Fox AP, McCleskey EW, Olivera BM, Thayer SA, Miller RJ, Tsien RW. Dominant role of N-type Ca2+ channels in evoked release of norepinephrine from sympathetic neurons. Science. 1988;239:57–61. doi: 10.1126/science.2447647. [DOI] [PubMed] [Google Scholar]
- Hofmann et al., 1999.Hofmann MW, Höning S, Rodionov D, Dobberstein B, von Figura K, Bakke O. The leucine-based sorting motifs in the cytoplasmic domain of the invariant chain are recognized by the clathrin adaptors AP1 and AP2 and their medium chains. J Biol Chem. 1999;274:36153–36158. doi: 10.1074/jbc.274.51.36153. [DOI] [PubMed] [Google Scholar]
- Jackson et al., 2010.Jackson LP, Kelly BT, McCoy AJ, Gaffry T, James LC, Collins BM, Höning S, Evans PR, Owen DJ. A large-scale conformational change couples membrane recruitment to cargo binding in the AP2 clathrin adaptor complex. Cell. 2010;141:1220–1229. doi: 10.1016/j.cell.2010.05.006. [DOI] [PMC free article] [PubMed] [Google Scholar]
- Jain et al., 2015.Jain S, Farías GG, Bonifacino JS. Polarized sorting of the copper transporter ATP7B in neurons mediated by recognition of a dileucine signal by AP-1. Mol Biol Cell. 2015;26:218–228. doi: 10.1091/mbc.E14-07-1177. [DOI] [PMC free article] [PubMed] [Google Scholar]
- Janvier et al., 2003.Janvier K, Kato Y, Boehm M, Rose JR, Martina JA, Kim BY, Venkatesan S, Bonifacino JS. Recognition of dileucine-based sorting signals from HIV-1 Nef and LIMP-II by the AP-1 γ–σ1 and AP-3 δ–σ3 hemicomplexes. J Cell Biol. 2003;163:1281–1290. doi: 10.1083/jcb.200307157. [DOI] [PMC free article] [PubMed] [Google Scholar]
- Kaeser et al., 2011.Kaeser PS, Deng L, Wang Y, Dulubova I, Liu X, Rizo J, Südhof TC. RIM proteins tether Ca2+ channels to presynaptic active zones via a direct PDZ-domain interaction. Cell. 2011;144:282–295. doi: 10.1016/j.cell.2010.12.029. [DOI] [PMC free article] [PubMed] [Google Scholar]
- Kepplinger et al., 2000.Kepplinger KJ, Kahr H, Förstner G, Sonnleitner M, Schindler H, Schmidt T, Groschner K, Soldatov NM, Romanin C. A sequence in the carboxy-terminus of the α1C subunit important for targeting, conductance and open probability of L-type Ca2+ channels. FEBS Lett. 2000;477:161–169. doi: 10.1016/S0014-5793(00)01791-9. [DOI] [PubMed] [Google Scholar]
- Kisilevsky and Zamponi, 2008.Kisilevsky AE, Zamponi GW. D2 dopamine receptors interact directly with N-type calcium channels and regulate channel surface expression levels. Channels. 2008;2:269–277. doi: 10.4161/chan.2.4.6402. [DOI] [PubMed] [Google Scholar]
- Kisilevsky et al., 2008.Kisilevsky AE, Mulligan SJ, Altier C, Iftinca MC, Varela D, Tai C, Chen L, Hameed S, Hamid J, Macvicar BA, Zamponi GW. D1 receptors physically interact with N-type calcium channels to regulate channel distribution and dendritic calcium entry. Neuron. 2008;58:557–570. doi: 10.1016/j.neuron.2008.03.002. [DOI] [PubMed] [Google Scholar]
- Krovetz et al., 2000.Krovetz HS, Helton TD, Crews AL, Horne WA. C-terminal alternative splicing changes the gating properties of a human spinal cord calcium channel α1A subunit. J Neurosci. 2000;20:7564–7570. doi: 10.1523/JNEUROSCI.20-20-07564.2000. [DOI] [PMC free article] [PubMed] [Google Scholar]
- Krupnick and Benovic, 1998.Krupnick JG, Benovic JL. The role of receptor kinases and arrestins in G protein-coupled receptor regulation. Annu Rev Pharmacol Toxicol. 1998;38:289–319. doi: 10.1146/annurev.pharmtox.38.1.289. [DOI] [PubMed] [Google Scholar]
- Lan et al., 2009.Lan H, Teeter MM, Gurevich VV, Neve KA. An intracellular loop 2 amino acid residue determines differential binding of arrestin to the dopamine D2 and D3 receptors. Mol Pharmacol. 2009;75:19–26. doi: 10.1124/mol.108.050542. [DOI] [PMC free article] [PubMed] [Google Scholar]
- Laporte et al., 1999.Laporte SA, Oakley RH, Zhang J, Holt JA, Ferguson SS, Caron MG, Barak LS. The β2-adrenergic receptor/βarrestin complex recruits the clathrin adaptor AP-2 during endocytosis. Proc Natl Acad Sci U S A. 1999;96:3712–3717. doi: 10.1073/pnas.96.7.3712. [DOI] [PMC free article] [PubMed] [Google Scholar]
- Laporte et al., 2000.Laporte SA, Oakley RH, Holt JA, Barak LS, Caron MG. The interaction of β-arrestin with the AP-2 adaptor is required for the clustering of β2-adrenergic receptor into clathrin-coated pits. J Biol Chem. 2000;275:23120–23126. doi: 10.1074/jbc.M002581200. [DOI] [PubMed] [Google Scholar]
- Laporte et al., 2002.Laporte SA, Miller WE, Kim KM, Caron MG. β-Arrestin/AP-2 interaction in G protein-coupled receptor internalization: identification of a β-arrestin binding site in β2-adaptin. J Biol Chem. 2002;277:9247–9254. doi: 10.1074/jbc.M108490200. [DOI] [PubMed] [Google Scholar]
- Le Roy and Wrana, 2005.Le Roy C, Wrana JL. Clathrin- and non-clathrin-mediated endocytic regulation of cell signalling. Nat Rev Mol Cell Biol. 2005;6:112–126. doi: 10.1038/nrm1571. [DOI] [PubMed] [Google Scholar]
- Lippincott-Schwartz et al., 1989.Lippincott-Schwartz J, Yuan LC, Bonifacino JS, Klausner RD. Rapid redistribution of Golgi proteins into the ER in cells treated with brefeldin A: evidence for membrane cycling from Golgi to ER. Cell. 1989;56:801–813. doi: 10.1016/0092-8674(89)90685-5. [DOI] [PMC free article] [PubMed] [Google Scholar]
- Lipscombe et al., 2002.Lipscombe D, Pan JQ, Gray AC. Functional diversity in neuronal voltage-gated calcium channels by alternative splicing of Cavα1. Mol Neurobiol. 2002;26:21–44. doi: 10.1385/MN:26:1:021. [DOI] [PubMed] [Google Scholar]
- Marangoudakis et al., 2012.Marangoudakis S, Andrade A, Helton TD, Denome S, Castiglioni AJ, Lipscombe D. Differential ubiquitination and proteasome regulation of CaV2.2 N-type channel splice isoforms. J Neurosci. 2012;32:10365–10369. doi: 10.1523/JNEUROSCI.0851-11.2012. [DOI] [PMC free article] [PubMed] [Google Scholar]
- Maximov and Bezprozvanny, 2002.Maximov A, Bezprozvanny I. Synaptic targeting of N-type calcium channels in hippocampal neurons. J Neurosci. 2002;22:6939–6952. doi: 10.1523/JNEUROSCI.22-16-06939.2002. [DOI] [PMC free article] [PubMed] [Google Scholar]
- Motley et al., 2003.Motley A, Bright NA, Seaman MN, Robinson MS. Clathrin-mediated endocytosis in AP-2-depleted cells. J Cell Biol. 2003;162:909–918. doi: 10.1083/jcb.200305145. [DOI] [PMC free article] [PubMed] [Google Scholar]
- Motley et al., 2006.Motley AM, Berg N, Taylor MJ, Sahlender DA, Hirst J, Owen DJ, Robinson MS. Functional analysis of AP-2 alpha and mu2 subunits. Mol Biol Cell. 2006;17:5298–5308. doi: 10.1091/mbc.E06-05-0452. [DOI] [PMC free article] [PubMed] [Google Scholar]
- Motta et al., 1995.Motta A, Bremnes B, Morelli MA, Frank RW, Saviano G, Bakke O. Structure-activity relationship of the leucine-based sorting motifs in the cytosolic tail of the major histocompatibility complex-associated invariant chain. J Biol Chem. 1995;270:27165–27171. doi: 10.1074/jbc.270.45.27165. [DOI] [PubMed] [Google Scholar]
- Namkung and Sibley, 2004.Namkung Y, Sibley DR. Protein kinase C mediates phosphorylation, desensitization, and trafficking of the D2 dopamine receptor. J Biol Chem. 2004;279:49533–49541. doi: 10.1074/jbc.M408319200. [DOI] [PubMed] [Google Scholar]
- Nesterov et al., 1999.Nesterov A, Carter RE, Sorkina T, Gill GN, Sorkin A. Inhibition of the receptor-binding function of clathrin adaptor protein AP-2 by dominant-negative mutant mu2 subunit and its effects on endocytosis. EMBO J. 1999;18:2489–2499. doi: 10.1093/emboj/18.9.2489. [DOI] [PMC free article] [PubMed] [Google Scholar]
- Nowycky et al., 1985.Nowycky MC, Fox AP, Tsien RW. Three types of neuronal calcium channel with different calcium agonist sensitivity. Nature. 1985;316:440–443. doi: 10.1038/316440a0. [DOI] [PubMed] [Google Scholar]
- Ohno et al., 1995.Ohno H, Stewart J, Fournier MC, Bosshart H, Rhee I, Miyatake S, Saito T, Gallusser A, Kirchhausen T, Bonifacino JS. Interaction of tyrosine-based sorting signals with clathrin-associated proteins. Science. 1995;269:1872–1875. doi: 10.1126/science.7569928. [DOI] [PubMed] [Google Scholar]
- Page et al., 1998.Page KM, Cantí C, Stephens GJ, Berrow NS, Dolphin AC. Identification of the amino terminus of neuronal Ca2+ channel α1 subunits α1B and α1E as an essential determinant of G-protein modulation. J Neurosci. 1998;18:4815–4824. doi: 10.1523/JNEUROSCI.18-13-04815.1998. [DOI] [PMC free article] [PubMed] [Google Scholar]
- Parton and Simons, 2007.Parton RG, Simons K. The multiple faces of caveolae. Nat Rev Mol Cell Biol. 2007;8:185–194. doi: 10.1038/nrm2122. [DOI] [PubMed] [Google Scholar]
- Raghib et al., 2001.Raghib A, Bertaso F, Davies A, Page KM, Meir A, Bogdanov Y, Dolphin AC. Dominant-negative synthesis suppression of voltage-gated calcium channel Cav2.2 induced by truncated constructs. J Neurosci. 2001;21:8495–8504. doi: 10.1523/JNEUROSCI.21-21-08495.2001. [DOI] [PMC free article] [PubMed] [Google Scholar]
- Raingo et al., 2007.Raingo J, Castiglioni AJ, Lipscombe D. Alternative splicing controls G protein-dependent inhibition of N-type calcium channels in nociceptors. Nat Neurosci. 2007;10:285–292. doi: 10.1038/nn1848. [DOI] [PMC free article] [PubMed] [Google Scholar]
- Ren et al., 2013.Ren X, Farías GG, Canagarajah BJ, Bonifacino JS, Hurley JH. Structural basis for recruitment and activation of the AP-1 clathrin adaptor complex by Arf1. Cell. 2013;152:755–767. doi: 10.1016/j.cell.2012.12.042. [DOI] [PMC free article] [PubMed] [Google Scholar]
- Reynolds et al., 1986.Reynolds IJ, Wagner JA, Snyder SH, Thayer SA, Olivera BM, Miller RJ. Brain voltage-sensitive calcium channel subtypes differentiated by omega-conotoxin fraction GVIA. Proc Natl Acad Sci U S A. 1986;83:8804–8807. doi: 10.1073/pnas.83.22.8804. [DOI] [PMC free article] [PubMed] [Google Scholar]
- Robinson et al., 2010.Robinson P, Etheridge S, Song L, Armenise P, Jones OT, Fitzgerald EM. Formation of N-type (Cav2.2) voltage-gated calcium channel membrane microdomains: lipid raft association and clustering. Cell Calcium. 2010;48:183–194. doi: 10.1016/j.ceca.2010.08.006. [DOI] [PubMed] [Google Scholar]
- Stamnes and Rothman, 1993.Stamnes MA, Rothman JE. The binding of AP-1 clathrin adaptor particles to Golgi membranes requires ADP-ribosylation factor, a small GTP-binding protein. Cell. 1993;73:999–1005. doi: 10.1016/0092-8674(93)90277-W. [DOI] [PubMed] [Google Scholar]
- Westenbroek et al., 1998.Westenbroek RE, Hoskins L, Catterall WA. Localization of Ca2+ channel subtypes on rat spinal motor neurons, interneurons, and nerve terminals. J Neurosci. 1998;18:6319–6330. doi: 10.1523/JNEUROSCI.18-16-06319.1998. [DOI] [PMC free article] [PubMed] [Google Scholar]
- Zhang et al., 1996.Zhang J, Ferguson SS, Barak LS, Ménard L, Caron MG. Dynamin and β-arrestin reveal distinct mechanisms for G protein-coupled receptor internalization. J Biol Chem. 1996;271:18302–18305. doi: 10.1074/jbc.271.31.18302. [DOI] [PubMed] [Google Scholar]
- Zhu et al., 1998.Zhu Y, Traub LM, Kornfeld S. ADP-ribosylation factor 1 transiently activates high-affinity adaptor protein complex AP-1 binding sites on Golgi membranes. Mol Biol Cell. 1998;9:1323–1337. doi: 10.1091/mbc.9.6.1323. [DOI] [PMC free article] [PubMed] [Google Scholar]