
Figure 2.
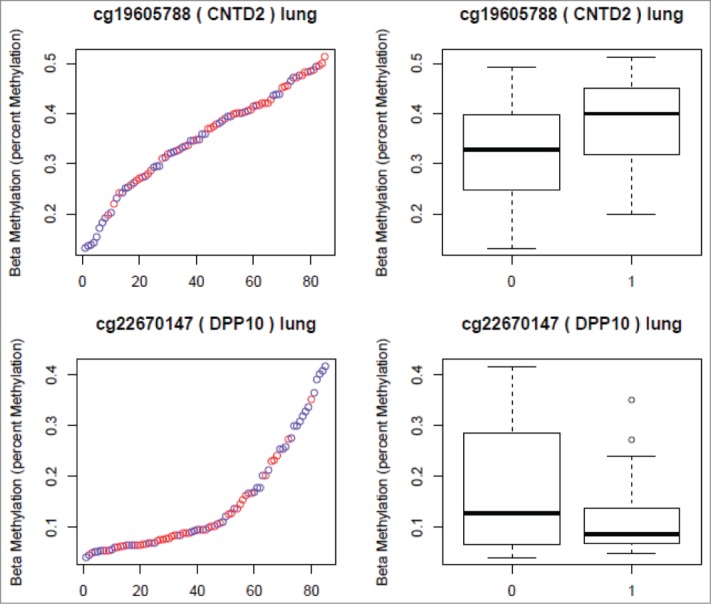
CpG sites Selected from the Lung Analyses. (Red in the scatter plots and 1 in the boxplots represents nicotine exposed tissue. Blue in the scatter plots and 0 in the boxplots represents unexposed tissue). The Y axis in both plots represents the β-values. The X axis in the scatter plots represents individual samples.