

Abstract
The development of biosimilar products is expected to grow rapidly over the next five years as a large number of approved biologics reach patent expiry. The pathway to regulatory approval requires that similarity of the biosimilar to the reference product be demonstrated through physiochemical and structural characterization, as well as within in vivo studies that compare the safety and efficacy profiles of the products. To support nonclinical and clinical studies pharmacokinetic (PK) assays are required to measure the biosimilar and reference products with comparable precision and accuracy. The most optimal approach is to develop a single PK assay, using a single analytical standard, for quantitative measurement of the biosimilar and reference products in serum matrix. Use of a single PK assay for quantification of multiple products requires a scientifically sound testing strategy to evaluate bioanalytical comparability of the test products within the method, and provide a solid data package to support the conclusions. To meet these objectives, a comprehensive approach with scientific rigor was applied to the development and characterization of PK assays that are used in support of biosimilar programs. Herein we describe the bioanalytical strategy and testing paradigm that has been used across several programs to determine bioanalytical comparability of the biosimilar and reference products. Data from one program is presented, with statistical results demonstrating the biosimilar and reference products were bioanalytically equivalent within the method. The cumulative work has established a framework for future biosimilar PK assay development.
Keywords: biotherapeutics, biosimilar, bioanalytical, pharmacokinetic, pharmacodynamics, recombinant, comparability
Abbreviations
- ART
ambient room temperature
- MRD
minimum required dilution
- Avg
Average
- BQL
Below the Quantification Limit
- CV
Coefficient of Variation
- ECL
Electrochemiluminescent
- LLOQ
Lower Limit of Quantification
- MSD
Meso Scale Discovery
- TPA
Tripropylamine
- ULOQ
Upper Limit of Quantification
- PK
pharmacokinetic
- BE
bioequivalence
- PD
pharmacodynamics
Introduction
Scientific advancements in recombinant genetic engineering techniques and refinements in manufacturing processes has led to several decades of growth in the development of biologic proteins for use in the treatment of human disease.1-4 Recombinant based drug development combined with monoclonal antibody technology has provided an avenue for developing highly pure targeted biologic therapeutics, in quantities that are adequate to meet market demand.1-4 As a result of these advancements, over 250 biologic molecules have been approved for therapeutic use,3 representing approximately 30% of all marketed drugs,5 with sales in the global market reaching more than $100 billion.6,7 As many first generation biologics reach patent expiry, commercial opportunities open up globally for development of follow-on biologics, which are also known as biosimilars.6,8 The ten top-selling biopharmaceuticals will lose patent protection by 2020, and these alone account for global market sales of approximately $50 billion.9,10 With the impending patent expiry of biologics driving growth, the biosimilar market is anticipated to be the “fastest-growing biologics sector over the next five years.”11 While the market offers opportunities, the development of biosimilars is complex and includes unique challenges that require significant investment costs for the manufacturer. Development of a biosimilar on average will take 5–8 y8 with costs ranging from $100-$200 million,12 whereas development of a small molecule generic typically will take 1–2 y8 with costs between $1-$5 million.12 Given the cost, and development risks associated with biosimilar production entrance into the market is anticipated to be dominated by larger pharmaceutical companies that have the financial capabilities and infrastructure needed to successfully support product development, with smaller pharmaceutical companies gaining increased market presence over time through partnering or expansion of their internal capabilities.13
By definition, a biosimilar is a biologic medicine that is highly similar to an approved reference (original) product in regards to structural and functional characteristics, and has demonstrated an absence of clinically meaningful differences between the reference and biosimilar products in terms of safety, purity, and potency.14 Biosimilars, though similar, are not exact copies of an original biological product. Unlike small molecule generics that are produced through chemical synthesis using a manufacturing process that is controlled and generally predictable,15 the development of biosimilars is complex, and the therapeutic properties of the biologic molecule are highly dependent on each step of the development process.3,16,17 Biosimilars are developed from living cells through genetic engineering and their production relies on optimized cell-expression systems and well-controlled manufacturing processes. Many of these steps require full development by the new manufacturer because institutional knowledge gained in the development of the reference product is not publically available.3,16 Production from living cells results in a heterogeneous mixture of parent drug, truncated fragments, and structural isoforms,3,15 and the products have an inherent susceptibility to post-translational modifications of the parent drug or fragments.2,3,15,17,19,20 While the primary protein sequence of a biosimilar is identical to the reference product, there can be differences in 3-dimensional structure as a result of variations in the manufacturing process that will occur between products, making it essential to determine if the differences affect all functions of the molecule including the pharmacokinetic (PK) and pharmacodynamic (PD) properties.2,3
Regulatory agencies have provided guidelines for sponsors to follow as they establish comparability between the biosimilar and the reference product, with the general principles being similar between the Food and Drug Administration (FDA) and the European Medicines Agency (EMA).21 FDA guidance on demonstrating similarity states that there are “no prescriptive requirements,” but rather similarity will be established based on the “totality-of-the-evidence,”14,22,23 and the EMA guidance recommends a “step-wise approach” to demonstrating similarity.24 Analytical characterization alone cannot provide a thorough understanding of the relationship between the molecular structure-function and the clinical effects. As a result the biosimilar manufacturer must demonstrate that the molecules are similar at the physiochemical and structural level, and must also conduct clinical studies to demonstrate that there are no effects on safety or efficacy as a result of analytically characterized differences that may be observed between the biosimilar and the reference product.2,3,21,25
Product development plans for biosimilars within Amgen align with regulatory expectations by providing a comprehensive comparative data package from studies designed to thoroughly characterize the biosimilar and reference products with regards to their safety, purity and potency profiles. The plans include extensive analytical testing of the biosimilar and the reference product, often include a nonclinical toxicology study, and clinical studies that begin with a pharmacokinetic (PK) similarity study of the product(s), followed by a comparative clinical study to evaluate product safety and efficacy in the patient population. To support global filing, the development studies are designed to compare the biosimilar product to reference products acquired in different regions, and this includes a comparative evaluation between reference products (Fig. 1). The inclusion of reference products sourced from different regions in the similarity assessments adds complexity to the overall testing strategy, affecting the analytical testing as well as the comparative clinical studies.
Figure 1.
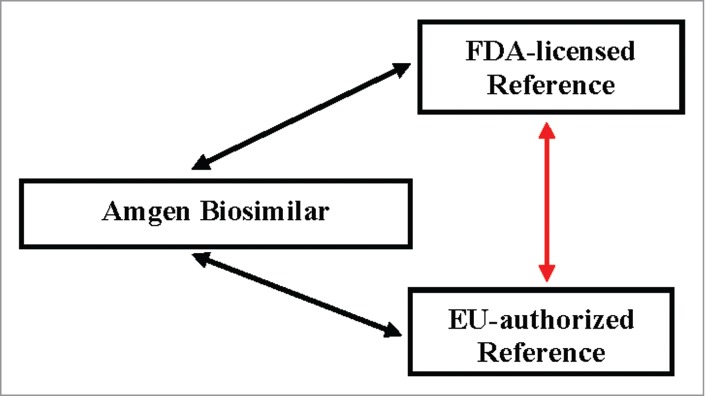
Support of a global filing strategy results in a complex comparative analysis of multiple products. The development studies are designed to compare the biosimilar product to reference product acquired in different regions, and to support a scientific bridge comparing the reference products.
Development of PK assays for quantitative measurement of the biosimilar and reference products in serum matrix is a critical component to the in vivo characterization of the test products. The bioanalytical data are a key element to demonstrating similarity of the test products; the concentration data serves as the foundation of the PK bioequivalence (BE) assessment of the dose-response profiles. The method or methods that are employed must be equally precise, accurate and robust in the measurement of the biosimilar and reference products sourced from different regions. Review of regulatory guidance documents and industry white papers26-28 shows that while there is a wealth of information providing clear direction on the methodology and performance characteristics required for ligand binding assays (LBA), these do not specifically address the unique challenges related to the establishment of PK assays that are used to support biosimilar product development. The current consensus within industry is that the best practice is to establish a single PK assay that uses a single analytical standard, for quantification of both the biosimilar and reference product(s) within test samples.1,15,19,29 Use of a single PK assay for quantification of the test products offers advantages by decreasing the inherent variability that would be associated with running multiple methods, and eliminating the need for crossover analysis when conducting blinded clinical studies. While the benefits are clear, use of a single method requires implementing a scientifically sound testing strategy that will evaluate the bioanalytical comparability of the test products within the method, and provide a solid data package to demonstrate the method is suitable for its intended use. To meet these objectives, a comprehensive approach with scientific rigor has been applied to the development, characterization and validation of the PK assays that are used in support of biosimilar drug development. The testing paradigm is outlined in Figure 2, and begins with a robust method qualification study that generates precision and accuracy data sets of the biosimilar and reference products, and applies statistical analysis of the data to determine if the test products are bioanalytically equivalent within the method. If the test products are shown to be bioanalytically comparable, the data then supports conducting validation of the method using a single analytical standard as the assay calibrator to quantify sets of Quality Control (QC) samples that are prepared with the biosimilar and reference products. With bioanalytical comparability being established across test products, the biosimilar is selected as the analytical standard for the single method.
Figure 2.
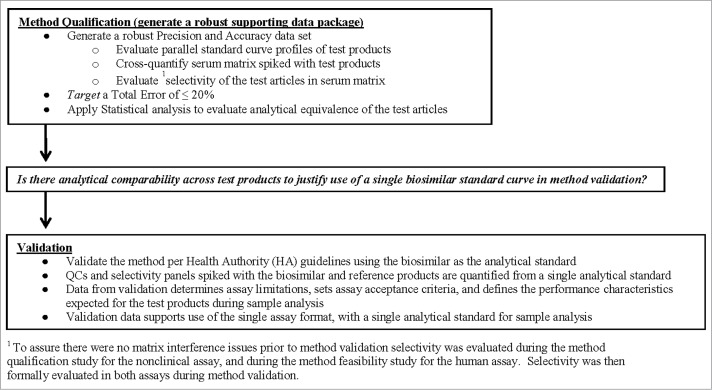
Outline of the testing paradigm applied to the single PK assay approach. The testing began with a robust method qualification study where statistical analysis of the data was used to determine if the test products were analytically equivalent within the method. If results from method qualification demonstrated the test products were comparable, then the data served to justify use of a single assay calibrator for quantification of the biosimilar and reference products during method validation and sample analysis.
Herein we present an overview of the step-wise testing strategy, the experimental designs, and the results that were used to determine bioanalytical comparability of multiple test products within a PK assay for one biosimilar program. Similar results have been obtained across other biosimilar programs. Data are presented outlining the process used to move from concept to establishment of a single assay approach and these include 1) development of the nonclinical PK assay that helped to define the data required to establish a single method; 2) implementation of the single PK assay in support of the investigational new drug (IND) application-enabling toxicology study that provided hands-on experience with the assay in production; 3) reformatting of the method to a human PK assay and generating feasibility data to establish the prototype; and 4) qualifying the human PK assay by generating a robust precision and accuracy data set and applying statistical analysis of the data following a pre-specified analysis plan designed to determine bioanalytical comparability of the test products based on predefined acceptance criteria.
Materials and Methods
Anti-idiotype (anti-ID) antibody pairs developed against the FDA-licensed reference product were generated at Amgen, Inc. (CA, USA). Commercially sourced pooled and individual serum samples from human and cynomolgus monkey were acquired from Bioreclamation, Inc. 96-well Multi-Array 6000 High Bind Microplates were purchased from MSD, MD. Blocker™ BLOTTO in TBS, was purchased from Thermo Scientific; wash buffer was purchased from Kirkegaard and Perry Laboratories. Read Buffer containing tripropylamine (TPA) was purchased from MSD, MD.
PK Method Format
To support biosimilar product development a PK assay was formatted using highly selective monoclonal anti-ID antibody pairs that were developed against the FDA-licensed reference product. The method was established on the Meso Scale Discovery (MSD) Electrochemiluminescent (ECL) platform using an anti-ID monoclonal antibody to capture the biosimilar and reference product(s) from test samples, and a second ruthenium labeled anti-ID for detection of the bound test products (Fig. 3). After bioanalytical comparability was established across the test products the biosimilar was selected as the single assay calibrator for quantification of the biosimilar and reference products during method validation, and subsequently in the production phase (sample analysis). The method was developed, qualified, and validated to support nonclinical studies, and then subsequently to support the clinical studies.
Figure 3.

Schematic of the biosimilar single PK assay. Anti-idiotype antibodies were developed against the FDA-licensed reference product and used for capture and detection of the biosimilar and reference products from serum samples collected from in vivo studies. The method was established on the Meso Scale Discovery (MSD) Electrochemiluminescent (ECL) platform, and an anti-ID antibody was used to capture the biosimilar and reference product(s) from test samples, and a second ruthenium labeled anti-ID antibody was used for detection of the bound test products. In the single PK assay the biosimilar is used as the assay calibrator for quantification of both biosimilar and reference products.
ECL Assay Procedure
Standards (STDs) and QC samples were prepared by spiking test products into 100% serum. Murine anti-FDA-licensed reference product monoclonal antibody was diluted in phosphate-buffered saline (PBS, Mediatech, VA) and immobilized onto 96-well Multi-Array 6000 High Bind Microplate wells (MSD, MD). The microplates were blocked with the addition of Blocker™ BLOTTO in TBS buffer (Thermo Scientific, PA) after blotting out excess coating antibody. After blocking, the microplate was washed and test materials (Standards, QCs, unknowns) were diluted 1:100 with Blocker™ BLOTTO in TBS and then dispensed into the microplate wells. Following an incubation step, the plates were washed, and a ruthenium conjugated murine anti-FDA-licensed reference product monoclonal antibody was added to the wells to bind to the captured test products. After a final wash step, read buffer (MSD, MD) was added to the microplate wells for detection of bound ruthenium conjugated murine anti-ID. The microplate was electrically stimulated in the plate reader, and the ruthenium label in the presence of tripropylamine (TPA) in the read buffer, emitted light which was proportional to the amount of test article that was bound by the capture reagent. For the nonclinical methods Watson Laboratory Information Management System (LIMS) (version 7.4 SP3, Thermo Scientific, PA) was used for data reduction which utilized a 5-paramater (Marquardt) regression model with a weighting factor of 1/y,2 with an assay range between 100 – 50000 ng/mL. For the human (clinical) PK method a 4-parameter curve fit with 1/y2 weighting (GEN5 LIMS) was used for data reduction with the calibration curve range between 50 – 12,800 ng/mL.
Method Qualification
To establish bioanalytical comparability of multiple test products within the PK assay a method qualification study was conducted prior to method validation. The qualification study was statistically powered to generate a robust precision and accuracy data set to evaluate bioanalytical equivalence of the biosimilar and reference products. As illustrated in Figure 2, the testing paradigm included the analysis of parallel standard curves of test products, and sets of QC samples that were prepared with each product spiked into biological matrix at five concentrations that spanned the linear range of the method. The QC sample sets were cross-quantitated against the different standard curves, and the inter- and intra-assay precision and accuracy of standards and QC samples were determined. For each QC sample the back-calculated concentration (ng/mL), standard deviation (SD) and coefficient of variation (%CV) were calculated, and the %bias from nominal was determined. The %bias was calculated as: [(observed-nominal (ng/mL))/nominal (ng/mL)] x 100. Total Error (TE) which comprises both the systematic bias and the random error were calculated as: (|%Bias| +%CV). Demonstrating bioanalytical comparability in the method qualification study served to justify conducting method validation with a single analytical standard.
Nonclinical PK Assay Method Qualification
For the nonclinical PK assay, bioanalytical comparability of the biosimilar and only the FDA-licensed reference product were evaluated because the toxicology studies are designed with only one reference product. Bioanalytical comparability was determined based on the precision and accuracy assessment using standard LBA acceptance criteria,27,28 as well as applying a Bland-Altman Statistical analysis of the values obtained for QC samples that were prepared with the different test products and quantified against each of the different standard curves (n = 4 plates). The Bland-Altman statistical comparison was performed on the back-calculated concentrations (ng/mL) of QC samples determined from standard curves prepared with either the biosimilar or the FDA-licensed reference product. The mean ratio limits, the 95% confidence interval around the mean ratio of QC sample concentrations determined from each curve, and the limits of agreement (imprecision of the results) were calculated and assessed against the criteria [0.8, 1.25] to demonstrate bioanalytical comparability.
Implementation of the Nonclinical PK Method
Successful establishment of bioanalytical comparability of the biosimilar and FDA-licensed reference product within the nonclinical PK assay led to full validation following regulatory guidelines and industry standards,27,28 using the biosimilar as the analytical standard, and then implementing the method in support of the IND-enabling toxicology study. The objectives of the toxicology study were to evaluate and qualitatively compare the toxicity observed with both the biosimilar and reference products when administered to cynomolgus monkeys. Full toxicokinetic (TK) serum concentration-time profiles were determined from samples that were analyzed for biosimilar and reference product concentrations using the validated ECL nonclinical PK assay method. Inter-assay performance characteristics were collected and compared with the characteristics obtained during method validation.
Human PK Assay Prototype
The nonclinical PK assay was optimized for use with human serum, and assay performance data was generated in the human PK prototype assay. Parallel standard curve profiles of the test products were generated, and selectivity was assessed prior to method qualification and validation. The selectivity assessment was conducted using a human serum panel composed of 6 individual donors, 3 male and 3 female, each spiked at the Lower Limit of Quantification (LLOQ) with the individual test products. Spiked and unspiked samples were quantified against the biosimilar standard curve, and the %bias compared with nominal was determined for each test product. The %bias was calculated as: [(observed-nominal (ng/mL))/nominal (ng/mL)] x 100.
Human PK Assay Method Qualification
Qualification of the human PK assay required a comparison of the biosimilar to both FDA- and EU-authorized reference products, as well as a comparison between both reference products. This resulted in a total of n = 4 plates of data for each reference product, and a total of n = 8 plates of data for the biosimilar product, with the biosimilar being tested alongside each individual reference product on the same plate. Data from the precision and accuracy assessments were analyzed using a pre-specified statistical analysis plan that was specifically designed to determine analytical equivalence of the three test products within the PK method. The equivalence evaluation was composed of a comparison between instrument responses of the standards and QC samples, as well as the back-calculated concentrations of QC samples determined from the different standard curves. Analytical equivalence to confirm bioanalytical comparability of the biosimilar and reference products was then determined based on both 1) the equivalence evaluation and 2) the accuracy and precision evaluation.
The equivalence evaluation among the three products; biosimilar, FDA-licensed, and EU-authorized reference products included a comparison among products on 1) the instrument responses obtained for the QC samples, 2) the instrument responses obtained for the standard curve points, 3) back-calculated ng/mL concentrations (n = 5) for the QC samples generated from the different standard curves. For each of the three scenarios, the mixed effect model analysis of variance was applied to log transformed assay responses. The test products and spiked concentrations were included into the model as fixed effects, and the interaction between product and concentration were assessed within the model. If the interaction between product and concentration was statistically significant (p-value < 0.05), the statistical analysis was performed at each concentration level separately, otherwise the interaction was omitted from the model and the concentration data was analyzed cumulatively for the test product. The estimated mean difference of the instrument responses of the QC samples between each two test products, between each two standard curves, and between the back-calculated concentrations using different standard curves were reported along with the corresponding 2-sided 90% confidence interval. The mean difference and the 90% confidence interval were then transformed back to give the estimated ratio of the two geometric means and the 90% confidence interval of the ratio.
Evaluating analytical equivalence by comparing the 90% confidence interval to pre-defined equivalence interval [0.8, 1.25] and concluding bioanalytical equivalence by combining the totality of the evidences was selected as an appropriate approach given the method would be used to support the PK similarity study, and stringent criteria around the measurement of the test products within the assay were necessary to minimize confounding variability.
Human PK Assay Method Validation
The human PK assay was fully validated for performance parameters consistent with those established for quantitative pharmacokinetic methods as described within the bioanalytical FDA guidance document and industry literature.27,28 Nine independent sets of biosimilar standards (STD) prepared in human serum were analyzed during method validation. The nominal concentrations of the standards were 50, 100, 200, 400, 800, 1600, 3200, 6400, and 12800ng/mL. Two independent sets of the biosimilar, FDA-licensed, and EU-authorized validation samples were prepared in human serum at concentrations of 50, 150, 1250, 9600, and 12800ng/mL, and then quantified against the biosimilar standard curve. The validation study was conducted across nine assays performed over three days by three analysts.
Results
Results from the nonclinical PK assay qualification study showed the standard curve profiles of the biosimilar and FDA-licensed reference product overlay with cumulative (n=8) recoveries across concentrations being within ± 4% of nominal, and precision (%CV) across standard curve points of ≤ 3%. The inter- and intra-assay precision and accuracy observed for individual standard curves met the internal a priori target acceptance criteria of ≤ 15% that was set for both parameters. As shown in Figures 4 and 5, QC sample sets that were cross-quantitated against the two different standard curves were comparable; the values fell within ± 20% of nominal. Cumulatively, the individual back-calculated QC concentrations generated from both standard curves across 32 assays had inter-assay CVs ≤ 9%, and accuracy within ± 9% of nominal. QC sample concentrations for each test product quantitated against the biosimilar standard curve had CVs ≤ 8%, and were within ± 19.2% of nominal. Similarly, QC sample concentrations for each test product quantitated against the FDA-licensed reference standard curve had CVs of ≤ 10.1%, and were within ± 19.5% of nominal. Total Error (TE) for QC samples was ≤ 16% for cumulative data, and ≤ 30% for data sets, including the LLOQ values, derived from the individual curves. The Bland-Altman statistical comparison of QC concentrations measured from both standard curves showed acceptable agreement as the ratio of the geometric means fell within the established limits of [0.8, 1.25]. Data from the method qualification study for the nonclinical PK assay met the internal a priori target acceptance criteria across test parameters, and were within regulatory guidance and industry standards for LBAs.27,28
Figure 4.
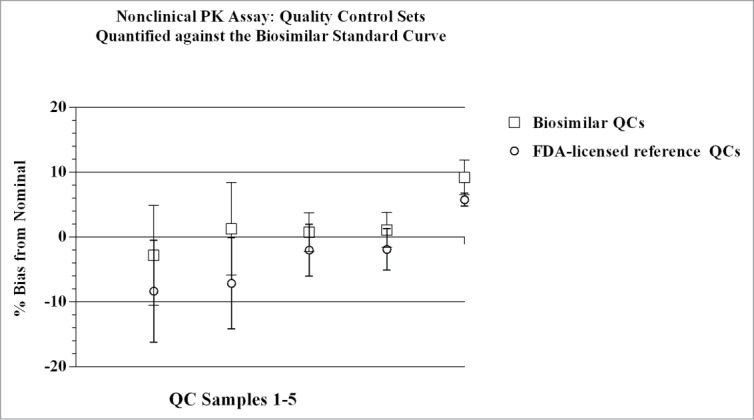
Quality Control sample sets were quantified against both the biosimilar and the reference product standard curves in the nonclinical PK assay. The individual concentrations (ng/mL) of QC sample sets determined from quantification against either the biosimilar or the reference product standard curves, varied from each other by ≤ 7%. Mean (n = 4), + SD for each QC sample point, with CVs for each point ≤ 8%. Concentration of QC samples 1–5 (left to right): 100, 300, 3000, 35000, 50000 ng/mL, respectively.
Figure 5.
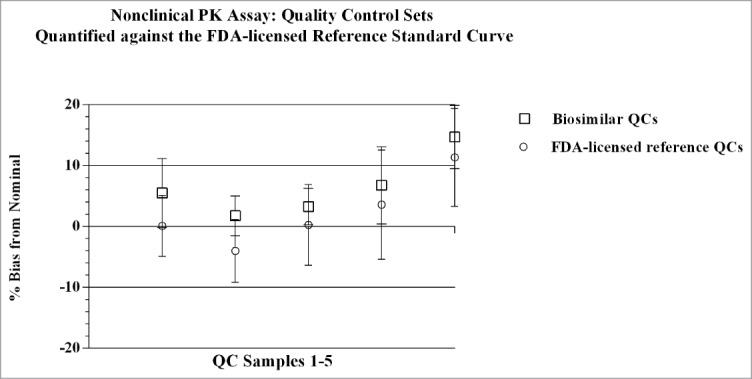
Quality Control sample sets were quantified against both the biosimilar and the reference product standard curves in the nonclinical PK assay. The individual concentrations (ng/mL) of QC sample sets determined from quantification against either the biosimilar or the reference product standard curves, varied from each other by ≤ 7%. Mean (n = 4), + SD for each QC sample point, with CVs for each point ≤ 10.1%. Concentration of QC samples 1–5 (left to right): 100, 300, 3000, 35000, 50000 ng/mL, respectively.
Implementation of the nonclinical PK assay to measure serum concentrations in the IND-enabling toxicology study in cynomolgus monkeys demonstrated utility of the single PK assay approach, and allowed a comparison of method performance across the validation and production phases (sample analysis). Summary statistics of method validation and sample analysis are presented in Table 1. The CV and bias obtained for QC samples during method validation were ≤ 7% and within ± 9% of nominal, respectively, and results obtained during the sample analysis phase were ≤ 6% and within ± 3% of nominal, respectively. These data demonstrated that method performance during production was consistent with performance observed during validation. A total of nine analytical runs were performed to analyze the TK samples in the toxicology study, and all met the assay acceptance criteria. As displayed in Figure 6, mean concentration-time profiles of the test groups were similar between the biosimilar and FDA-licensed reference product following weekly administration of the test products in monkeys.
Table 1.
Nonclinical PK assay support of the toxicology study: Performance data comparison
| Assay Validation Inter-assay Statistics |
Toxicology Study Inter-assay Statistics |
||||
|---|---|---|---|---|---|
| Sample Type | Accuracy (%Bias) | Precision (%CV) | Total Error (%TE) | Accuracy (%Bias) | Precision (%CV) |
| Standards | −3 to 2 | 0 to 10 | NA | −7 to 5 | 0 to 3 |
| QC | −9 to 1 | 4 to7 | 5 to 19 | −3 to 0 | 5 to 6 |
CV: coefficient of variation, calculated as ((SD/mean concentration) x100).
Bias: [(observed-nominal (ng/mL))/nominal (ng/mL)] x 100.
Total error: (|%Bias| +%CV); which comprises both the systematic bias and the random error.
Figure 6.
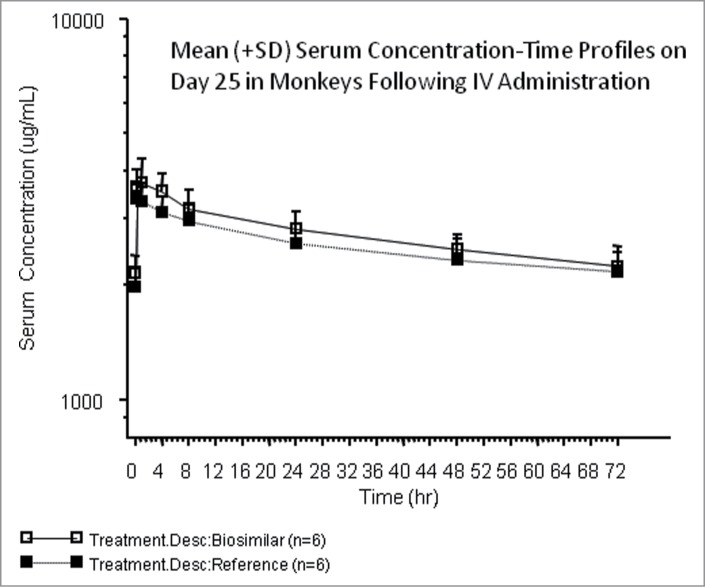
The nonclinical method was implemented to support the sample analysis phase of the toxicology study. Study performance data was consistent with performance data observed during validation (Table 1). As displayed in Figure 6, results from the toxicokinetic study showed that the mean concentration-time profiles in-vivo were similar between the biosimilar and FDA-licensed reference groups following administration of the test products weekly.
Feasibility data generated in the human PK prototype assay included a comparison of analytical standard curves prepared with the three test products, and an evaluation of selectivity using a panel of 6 human donor serum samples (3 male and 3 female) spiked with either the biosimilar, FDA-licensed or the EU-authorized reference products. As shown in Figure 7 and Table 2, there were no distinguishable differences in the standard curve profiles, demonstrating the anti-ID antibodies bound the three test products comparably within the assay with CVs of ≤ 7.7%. Similarly, results of the selectivity assessment showed that recovery of the three test products from biological matrix were comparable, with the bias falling within ± 11.3% of nominal for the test samples. A summary of the data are presented in Figure 8. Results met regulatory guidance criteria for LBAs, 27,28 and the data demonstrated there were no matrix effect differences across test products.
Figure 7.

The human PK assay prototype was established by reformatting the nonclinical PK assay for use with human serum matrix. The standard curve comparison of the biosimilar, the FDA-licensed, and EU-authorized reference products in the human PK prototype assay are presented, with the profiles showing the 3 products were comparable within the method. Mean (n = 2), + SD plotted; CVs ≤ 3%. Recoveries for the standard curve points were within ± 14% of nominal.
Table 2.
Summary of the standard curve data for the 3 test products in the human PK prototype assay
| Concentration ng/mL | Biosimilar Instrument Response | FDA-licensed Instrument Response | EU-authorized Instrument Response | Mean Instrument Response | SD | %CV |
|---|---|---|---|---|---|---|
| 50 | 618 | 607 | 549 | 591 | 37.1 | 6.3 |
| 100 | 1219 | 1183 | 1063 | 1155 | 81.5 | 7.1 |
| 500 | 5791 | 5808 | 5059 | 5552 | 427 | 7.7 |
| 1000 | 11640 | 11064 | 10338 | 11014 | 652 | 5.9 |
| 2500 | 27978 | 27697 | 26378 | 27351 | 854 | 3.1 |
| 6250 | 66845 | 64361 | 64291 | 65165 | 1455 | 2.2 |
| 12500 | 123154 | 123985 | 128814 | 125317 | 3057 | 2.4 |
| 20000 | 177747 | 172654 | 194467 | 181623 | 11411 | 6.3 |
| 25000 | 213273 | 210399 | 226203 | 216625 | 8418 | 3.9 |
CV: coefficient of variation, calculated as ((SD/mean concentration) x 100).
Bias: [(observed-nominal (ng/mL))/nominal (ng/mL)] x 100.
Figure 8.
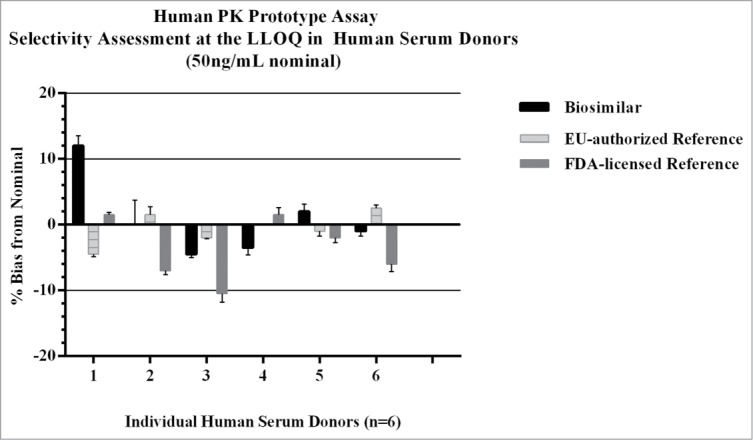
Selectivity was evaluated in the human PK prototype assay to determine if there were any significant recovery differences from human serum matrix across the three test products. Each of the test products were spiked into 6 individual normal human serum donors at the assay LLOQ (50ng/mL), and recovery of the three test products across donors were all within ± 11% of nominal. There were no matrix effects observed in human serum with the biosimilar, FDA-licensed, or EU-authorized reference products.
Qualification of the human PK assay showed inter- and intra-assay precision and accuracy results obtained for QC sample sets that were back-calculated against the three standard curves had comparable performance. The inter-assay performance of the standards, both cumulative and individual runs, had CVs of ≤ 4%, and %bias from nominal within ± 3%. Cumulative back-calculated concentrations of the QC samples (n = 64 assays) had inter-assay CVs of ≤ 9%, and %bias from nominal within ± 15%. When QC sample sets were quantified against standard curves prepared with the individual test products results showed the concentrations from the biosimilar standard curve had CVs of ≤ 10% with %bias within ± 15%; concentrations from the FDA-licensed reference standard curve had CVs of ≤ 7% with %bias within ± 20%; concentrations from the EU-authorized reference standard curve had CVs of ≤ 9% and %bias within ± 12%. Cumulative data for QC concentrations determined from the three curves at the LLOQ showed a TE of 24%; and TE's of 23%, 28%, and 21% for data sets derived independently from the biosimilar, FDA-licensed, and EU-authorized reference standard curves, respectively. QC samples above the LLOQ had TE values that were ≤ 20%. Data from one plate is displayed in Figure 9, where QC sample sets cross-quantitated against the biosimilar and EU-authorized reference standard curves were comparable with bias within ± 20% of nominal.
Figure 9.
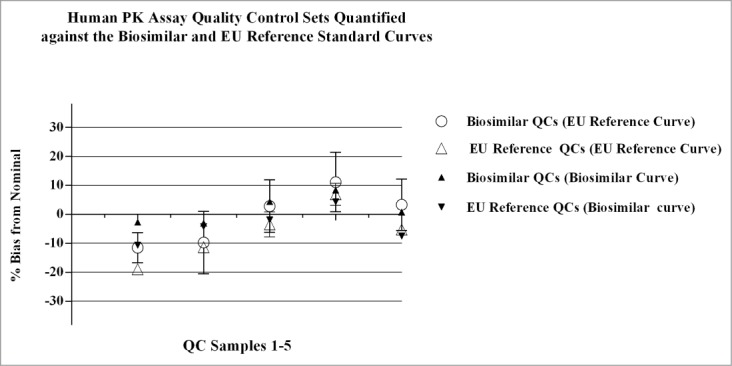
Parallel standard curves and QC sample sets were analyzed on the same plate during qualification of the human PK assay. The biosimilar vs. FDA reference product were analyzed in parallel on individual plates, and the biosimilar vs. the EU reference product were analyzed on separate plates. The QC samples were cross-quantified against the different standard curves and the %bias was calculated as: [(observed-nominal (ng/mL))/ nominal (ng/mL))] x 100. Data presented in Figure 9 are QC values from one plate in the qualification study comparing the EU reference product to the biosimilar product; similar results were obtained across the additional runs for the EU reference product and runs comparing the FDA reference product to the biosimilar product. Results obtained for QCs quantitated from the different standard curves were comparable, with bias values within ± 20% of nominal. Concentration of QC samples 1–5 (left to right): 50, 150, 1250, 9600, and 12800ng/mL, respectively.
Statistical analysis of the data obtained during the method qualification study of the human PK assay showed there was no significant difference in the QC concentrations measured from the standard curves prepared with the three test products. Results presented in Tables 3 and 4 show that across the parameters examined, including instrument responses and back-calculated ng/mL concentrations, the ratio of the geometric means fell within the pre-specified equivalence range of [0.80, 1.25]. There was no distinguishable difference in the concentrations of test article obtained when QC sample sets were quantified against the three individual standard curves. These data demonstrated bioanalytical comparability of the three test products within the human PK assay, and justified use of the biosimilar product as the single analytical standard during method validation and sample analysis.
Table 3.
Qualification of the human PK assay: Statistical analysis of the standard curve responses across the 3 test products
| Product 1 | Product 2 | Ratio of Product 1/Product 2 | Lower Bound of the 90% CI | Upper Bound of the 90% CI |
|---|---|---|---|---|
| Biosimilar | EU-authorized Reference | 1.00 | 0.93 | 1.08 |
| Biosimilar | FDA-licensed Reference | 0.96 | 0.86 | 1.06 |
| EU-authorized Reference | FDA-licensed Reference | 1.14 | 1.03 | 1.26 |
Table 4.
Qualification of the human PK assay: Statistical analysis of the back-calculated concentrations for QCs using standard curves from the biosimilar, FDA-licensed, and EU-authorized reference products
| Samples | Curve 1 | Curve 2 | Ratio of Curve 1/Curve 2 | Lower Bound of the 90% CI | Upper Bound of the 90% CI |
|---|---|---|---|---|---|
| Biosimilar QCs | Biosimilar | FDA-licensed | 1.07 | 1.00 | 1.14 |
| FDA-licensed QCs | Biosimilar | FDA-licensed | 1.07 | 1.00 | 1.14 |
| Biosimilar QCs | Biosimilar | EU-authorized Reference | 1.00 | 0.96 | 1.04 |
| EU-authorized Reference QCs | Biosimilar | EU-authorized Reference | 0.99 | 0.96 | 1.03 |
Results from the accuracy and precision assessment of validation samples quantified from the biosimilar standard curve during method validation of the human PK assay showed the mean intra-assay variability of the biosimilar validation samples ranged from 1- 2%, the inter-assay variability ranged from 3–6%, and the total error ranged from 5–16%. The FDA-licensed validation samples showed mean intra-assay variability that ranged from 2–3%, inter-assay variability that ranged from 4–7% and total error that ranged from 7- 22%. For the EU-authorized validation samples the mean intra-assay variability ranged from 2- 4%, the inter-assay variability ranged from 3- 6%, and the total error ranged from 4- 21%. A summary of the data are presented in Table 5.
Table 5.
Summary of the accuracy and precision of validation samples in the human PK assay
| LLOQ 50ng/mL | LOQ 150ng/mL | MQC 1250ng/mL | HQC 9600ng/mL | ULOQ 12800ng/mL | |||
|---|---|---|---|---|---|---|---|
| Biosimilar | Inter-run Statistics (n = 18) | Mean | 49.459 | 138.905 | 1230.827 | 10593.473 | 12496.818 |
| SD | 2.806 | 8.576 | 42.020 | 598.758 | 540.147 | ||
| %CV | 6 | 6 | 3 | 6 | 4 | ||
| %Bias | −1 | −7 | −2 | 10 | −2 | ||
| %TE | 7 | 13 | 5 | 16 | 6 | ||
| Intra-run Statistics (n = 9) | %CV | 1 | 1 | 2 | 2 | 2 | |
| %Bias | −1 | −7 | −2 | 10 | −2 | ||
| %TE | 6 | 9 | 5 | 13 | 5 | ||
| FDA-licensed | Inter-run Statistics (n = 18) | Mean | 48.588 | 145.021 | 1295.877 | 10398.966 | 14715.574 |
| SD | 2.377 | 7.803 | 45.568 | 427.113 | 958.250 | ||
| %CV | 5 | 5 | 4 | 4 | 7 | ||
| %Bias | −3 | −3 | 4 | 8 | 15 | ||
| %TE | 8 | 8 | 8 | 12 | 22 | ||
| Intra-run Statistics (n = 9) | %CV | 3 | 3 | 2 | 2 | 3 | |
| %Bias | −3 | −3 | 4 | 8 | 15 | ||
| %TE | 7 | 7 | 6 | 10 | 18 | ||
| EU-authorized | Inter-run Statistics (n = 18) | Mean | 50.210 | 140.611 | 1300.896 | 11004.639 | 13856.606 |
| SD | 1.996 | 6.997 | 35.087 | 635.299 | 628.817 | ||
| %CV | 4 | 5 | 3 | 6 | 5 | ||
| %Bias | 0 | −6 | 4 | 15 | 8 | ||
| %TE | 4 | 11 | 7 | 21 | 13 | ||
| Intra-run Statistics (n = 9) | %CV | 2 | 4 | 2 | 2 | 2 | |
| %Bias | 0 | −6 | 4 | 15 | 8 | ||
| %TE | 5 | 10 | 6 | 17 | 10 |
SD: standard deviation.
CV: coefficient of variation, calculated as ((SD/mean concentration) x100).
Bias: [(observed-nominal (ng/mL))/nominal (ng/mL)] x 100.
Total error: (|%Bias| +%CV); which comprises both the systematic bias and the random error.
Discussion
Demonstrating similarity of the biosimilar to the reference product during development is not based solely on physiochemical comparability, but also relies significantly on the comparability observed within the nonclinical and clinical studies.19 The clinical study to evaluate the PK profiles of the biosimilar and reference product serves to establish similarity of the dose-response relationship of the products, with the bioanalytical data providing the foundation to this assessment.30 Successful support of these comparative in vivo studies relies on the development of a well-characterized, robust PK method that measures the biosimilar and reference products in biologic matrix equivalently; with comparable precision and accuracy. The criteria used to conclude bioanalytical comparability of multiple test products within the method are critical. Though the biosimilar and reference product have identical primary structures, and the anti-ID antibodies are directed toward shared epitopes with comparative immunoreactivity expected, there are challenges to achieving bioanalytical comparability within an immunologically-based method that must be empirically evaluated. Product characteristics that have the potential to affect performance in the immunoassay include 1) concentration differences related to product labeling, and the effect of reconstitution which may result in protein concentrations spanning the high to low allowable limits of the specification; 2) post-translational modifications that result in structural changes such as glycosylation; and 3) differences in the process impurity profiles. All of these have the potential to affect binding of the products to the capture and detection antibodies and influence variability within the assay.15,19 The objective of the work presented here was to develop a scientifically sound approach to establishing a single PK assay that uses a single analytical standard, to measure multiple test products in serum from in vivo studies that support biosimilar programs.
Use of a single PK assay to support biosimilar product development has recently been recommended within industry as best practice, but there are few publications that describe the process for establishing a single method for multiple products and the scientific rigor required to demonstrate comparability. This publication describes an approach that was implemented in 2011, at a time when regulatory and industry guidance on the topic was limited, and it has been used successfully across several biosimilar programs. To assure that differences observed in the performance and quantification of the test products were well within the variability expected within the methodology, a comprehensive step-wise testing approach, with a statistically-based evaluation of the data was applied. The first biosimilar toxicology study was supported by a nonclinical PK assay that was established through a method qualification study where a Bland-Altman statistical analysis was applied to the precision and accuracy data. These data demonstrated bioanalytical comparability of the test products, and supported validation of the single PK method using a single analytical standard. As the program moved toward clinical study support, a formal statistical analysis plan was drafted to assess bioanalytical comparability of the multiple test products in the clinical PK assay. This statistical analysis assessment was applied retrospectively to data from the first nonclinical PK assay qualification study, and results showed there was no statistically-significant difference in the interactions of the products within the method. These data demonstrated proof of concept, and supported use of the proposed testing paradigm in future programs. The conclusions from the bioanalytical comparability testing within the single clinical PK method were confirmed in the PK similarity study that was conducted in human subjects dosed with the biosimilar, FDA-licensed and EU-authorized reference products. Results from this study showed similar dose-response profiles were obtained across the three test products, and the bioequivalence (BE) criteria were met. Collectively the data across several biosimilar development programs has demonstrated the approach is robust, scientifically sound and remains aligned with the evolving regulatory and industry recommendations.
The bioanalytical strategy and experimental studies described here have established a comprehensive framework for the development, qualification and validation of PK assays that are used in support of biosimilar programs. To determine bioanalytical comparability of the test products within the method, a rigorous testing paradigm that included a robust method qualification study comparing precision and accuracy of the biosimilar and reference products was applied. The method qualification study was designed to evaluate equivalence of the test products within the bioanalytical method, and the data was statistically analyzed to determine bioanalytical comparability. The bioanalytical strategy was designed as “fit-for-purpose,” and the approach has been used successfully to establish a single PK assay for nonclinical and clinical support across several biosimilar programs. Future biosimilar programs will evaluate use of a single PK method case-by case; applying similar scientific rigor to the comparability assessment of the test products to assure a scientifically sound data package supports conclusions, and demonstrates the method is suitable for its intended use.
Disclosure of Potential Conflicts of Interest
There is no potential conflict of interest. The authors employed with Amgen Inc. include: Alex Colbert, Vincent Fung-Sing Chow, Teresa Wong, Danielle DeSimone, Lei Zhou and Susan Pederson. The authors have no other relevant affiliations or financial involvement with any organization or entity with a financial interest in or financial conflict with the subject matter or materials discussed in the manuscript apart from those disclosed. No writing assistance was utilized in the production of this manuscript.
Acknowledgments
The authors thank Jessie Gu for her contributions and input into the design and statistical analysis of the early biosimilar programs.
Ethical Statement
The authors complied with the legal requirements pertaining to the work that was done. The materials were collected and maintained in accordance with applicable laws including informed consent, there were no subject identifiers, and the applicable regulations and institutional policies were followed.
References
- 1. Cai X-Y, Gouty D, Baughman S, Ramakrishnan M, Cullen C. Recommendations and requirements for the design of bioanalytical testing used in comparability studies for biosimilar drug development. Bioanalysis 2011; 3:535-40; PMID:21388266; http://dx.doi.org/ 10.4155/bio.11.24 [DOI] [PubMed] [Google Scholar]
- 2. Tsiftsoglou AS, Ruiz S, Schneider CK. Development and regulation of biosimilars: current status and future challenges. BioDrugs 2013; 27:203-11; PMID:23553340; http://dx.doi.org/ 10.1007/s40259-013-0020-y [DOI] [PubMed] [Google Scholar]
- 3. Lee JF, Litten JB, Grampp G. Comparability and biosimilarity: considerations for the healthcare provider. Curr Med Res Opin 2012; 28:1053-8; PMID:22519391; http://dx.doi.org/ 10.1185/03007995.2012.686902 [DOI] [PubMed] [Google Scholar]
- 4. Nowatzke WL, Rogers K, Wells E, Bowsher RR, Ray C, Unger S. Unique challenges of providing bioanalytical support for biological therapeutic pharmacokinetic programs. Bioanalysis 2011; 3:509-21; PMID:21388264; http://dx.doi.org/ 10.4155/bio.11.2 [DOI] [PubMed] [Google Scholar]
- 5. Mintz C. Commercializing Biosimilars: Who Will Dominate the Market? Life Science Leader Magazine 2013; 3. [Google Scholar]
- 6. Pharmaceutical Product Development (PPD) L White Paper Developing Biosimilars in Emerging Markets: Regulatory and Clinical Considerations. ppdicom 2013. [Google Scholar]
- 7. Lovenworth SJOMML. The New Biosimilar Era: The Basics, The Landscape, and The Future. Bloomberg Law 2013. [Google Scholar]
- 8. Lanthier M, Behrman R, Nardinelli C. Economic issues with follow-on protein products. Nat Rev Drug Discov 2008; 7:733-7; PMID:18654570; http://dx.doi.org/ 10.1038/nrd2636 [DOI] [PubMed] [Google Scholar]
- 9. Fitch Patent Expirations Drive Growth Globla Biosimilars Market. Reuters 2013. [Google Scholar]
- 10. Calo-Fernández B, Martínez-Hurtado JL. Biosimilars: company strategies to capture value from the biologics market. Pharmaceuticals (Basel) 2012; 5:1393-408; PMID:24281342; http://dx.doi.org/ 10.3390/ph5121393 [DOI] [PMC free article] [PubMed] [Google Scholar]
- 11. Rickwood SIH. Shaping the biosimilars opportunity: A global perspective on the evolving biosimilars landscape. IMS Health 2011. [Google Scholar]
- 12. Competition FTCE. Emerging health care issues: follow-on biologic drug competition. June 2009. Report http://wwwftcgov/os/2009/06/P083901biologicsreportpdf 2009. [Google Scholar]
- 13. Nuskey Bourgoin A, Beth An Outlook on US Biosimilar Competition Copyright © Thomson Reuters 2013; White Paper. [DOI] [PubMed] [Google Scholar]
- 14. US Department of Health and Human Services FDA CDER, Center for Biologics Evaluation and Research Guidance for Industry Scientific Considerations in Demonstrating Biosimilarity to a Reference Product DRAFT GUIDANCE 2012. [Google Scholar]
- 15. Oldfield P. Differences in bioanalytical method validation for biologically derived macromolecules (biosimilars) compared with small molecules (generics). Bioanalysis 2011; 3:1551-3; PMID:21756087; http://dx.doi.org/ 10.4155/bio.11.129 [DOI] [PubMed] [Google Scholar]
- 16. McMahon Publishing Understanding Key Differences Between Biosimilars and Small Molecule Generics. Pharmacy Practice News and Specialty Pharmacy Continuum May 2013. [Google Scholar]
- 17. Covic Kuhlmann M., Adrian. The protein science of biosimilars. Nephrol Dial Transplant 2006; 21:4-8; PMID:16280373; http://dx.doi.org/ 10.1093/ndt/gfl474 [DOI] [PubMed] [Google Scholar]
- 19. Cai X-Y, Wake A, Gouty D. Analytical and bioanalytical assay challenges to support comparability studies for biosimilar drug development. Bioanalysis 2013; 5:517-20; PMID:23425265; http://dx.doi.org/ 10.4155/bio.13.1 [DOI] [PubMed] [Google Scholar]
- 20. Andrzej Wiecek. Mikhail, Ashraf European regulatory guidelines for biosimilars. Nephrol Dial Transplant 2006; 21:17-20; http://dx.doi.org/ 10.1093/ndt/gfl477 [DOI] [PubMed] [Google Scholar]
- 21. Subramanyam M. Clinical development of biosimilars: an evolving landscape. Bioanalysis 2013; 5:575-86; PMID:23425273; http://dx.doi.org/ 10.4155/bio.13.5 [DOI] [PubMed] [Google Scholar]
- 22. US Department of Health and Human Services FDA CDER, Center for Biologics Evaluation and Research Guidance for Industry Quality Considerations in Demonstrating Biosimilarity to a Reference Protein Product DRAFT GUIDANCE 2012. [Google Scholar]
- 23. US Department of Health and Human Services FDA, (CDER) R Guidance for Industry Biosimilars: Questions and Answers Regarding Implementation of the Biologics Price Competition and Innovation Act of 2009 DRAFT GUIDANCE 2012. [Google Scholar]
- 24. European Medicines Agency (EMA) CHMP Guideline on Similar Biological Medicinal Products. CHMP/437/04 Rev 1 2 26 April 2013 [Google Scholar]
- 25. Miletich J, Eich G, Grampp G, Mounho B. Biosimilars 2.0: guiding principles for a global “patients first” standard. MAbs 2011; 3:318-25; PMID:21512318; http://dx.doi.org/ 10.4161/mabs.3.3.15599 [DOI] [PMC free article] [PubMed] [Google Scholar]
- 26. Viswanathan CT, Bansal S, Booth B, DeStefano AJ, Rose MJ, Sailstad J, Shah VP, Skelly JP, Swann PG, Weiner R. Quantitative bioanalytical methods validation and implementation: best practices for chromatographic and ligand binding assays. Pharm Res 2007; 24:1962-73; PMID:17458684; http://dx.doi.org/ 10.1007/s11095-007-9291-7 [DOI] [PubMed] [Google Scholar]
- 27. DeSilva B, Smith W, Weiner R, Kelley M, Smolec J, Lee B, Khan M, Tacey R, Hill H, Celniker A. Recommendations for the bioanalytical method validation of ligand-binding assays to support pharmacokinetic assessments of macromolecules. Pharm Res 2003; 20:1885-900; PMID:14661937; http://dx.doi.org/ 10.1023/B:PHAM.0000003390.51761.3d [DOI] [PubMed] [Google Scholar]
- 28. US Department of Health and Human Services FDA CDER, Center for Biologics Evaluation and Research Guidance to Industry: Bioanalytical Method Validation 2001. Guidance to Industry: Bioanalytical Method Validation 2001. [Google Scholar]
- 29. Oldfield P. A wide angle view of biosimilars from a bioanalytical perspective. Bioanalysis 2013; 5:533-5; PMID:23425269; http://dx.doi.org/ 10.4155/bio.12.316 [DOI] [PubMed] [Google Scholar]
- 30. Colletti KS. Bioanalysis-related topics presented at the International Confenrece and Exhibition on Biowaivers and Biosimilars. Bioanalysis, Future Science 2013; 5:529-31 [DOI] [PubMed] [Google Scholar]