
Figure 6.
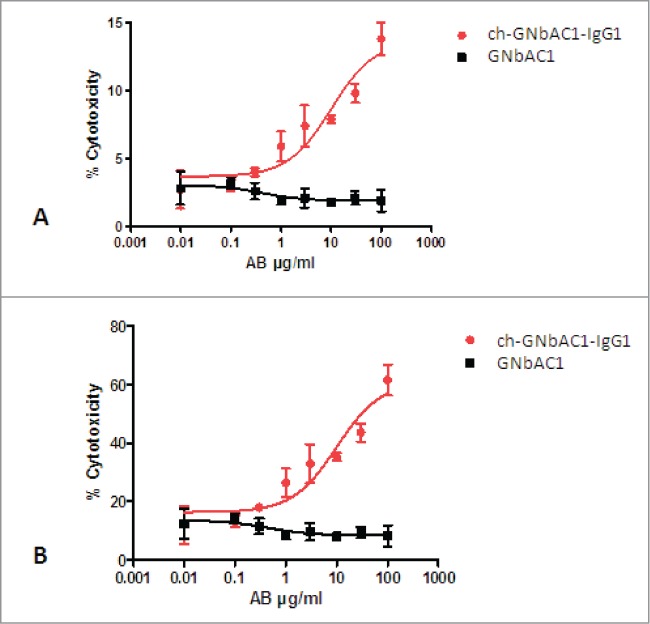
CDC-dependent dose-response curves of ch-GNbAC1-IgG1 and GNbAC1 (IgG4). (A) % cytotoxicity referring to total cells. EC50 ch-GNbAC1-IgG1: 10.12 μg/ml; EC50 GNbAC1: not calculated. (B) % cytotoxicity referring to transfected cells. EC50 ch-GNbAC1-IgG1: 10.05 μg/ml; EC50 GNbAC1: not calculated.