

Abstract
Reduced representation bisulfite sequencing (RRBS) was used to analyze DNA methylation patterns across the mouse brain genome in mice carrying a deletion of the Prader-Willi syndrome imprinting center (PWS-IC) on either the maternally- or paternally-inherited chromosome. Within the ∼3.7 Mb imprinted Angelman/Prader-Willi syndrome (AS/PWS) domain, 254 CpG sites were interrogated for changes in methylation due to PWS-IC deletion. Paternally-inherited deletion of the PWS-IC increased methylation levels ∼2-fold at each CpG site (compared to wild-type controls) at differentially methylated regions (DMRs) associated with 5′ CpG island promoters of paternally-expressed genes; these methylation changes extended, to a variable degree, into the adjacent CpG island shores. Maternal PWS-IC deletion yielded little or no changes in methylation at these DMRs, and methylation of CpG sites outside of promoter DMRs also was unchanged upon maternal or paternal PWS-IC deletion. Using stringent ascertainment criteria, ∼750,000 additional CpG sites were also interrogated across the entire mouse genome. This analysis identified 26 loci outside of the imprinted AS/PWS domain showing altered DNA methylation levels of ≥25% upon PWS-IC deletion. Curiously, altered methylation at 9 of these loci was a consequence of maternal PWS-IC deletion (maternal PWS-IC deletion by itself is not known to be associated with a phenotype in either humans or mice), and 10 of these loci exhibited the same changes in methylation irrespective of the parental origin of the PWS-IC deletion. These results suggest that the PWS-IC may affect DNA methylation at these loci by directly interacting with them, or may affect methylation at these loci through indirect downstream effects due to PWS-IC deletion. They further suggest the PWS-IC may have a previously uncharacterized function outside of the imprinted AS/PWS domain.
Keywords: angelman syndrome, DNA methylation, genomic imprinting, imprinting center, prader-Willi syndrome, reduced representation bisulfite sequencing
Abbreviations
- AS
Angelman Syndrome
- AS-IC
Angelman Syndrome Imprinting Center
- AS-SRO
Angelman Syndrome Shortest Region of deletion Overlap
- BGS
Sodium Bisulfite Genomic Sequencing
- BISSCA
Bisulfite Sequencing Comparative Analysis
- CGI
CpG Island
- DH
DNase I Hypersensitive
- DMR
Differentially Methylated Region
- EtOH
Ethanol
- GO
gene ontology
- IC
Imprinting Center
- ICR
Imprinting Control Region
- IPA
Ingenuity Pathway Analysis ®
- lncRNA
long non-coding RNA
- mat
maternally-inherited allele
- pat
paternally-inherited allele
- PWS
Prader-Willi Syndrome
- PWS-IC
Prader-Willi Syndrome Imprinting Center
- PWS-SRO
Prader-Willi Syndrome Shortest Region of deletion Overlap
- RRBS
Reduced Representation Bisulfite Sequencing
- SDS
Sodium Dodecyl Sulfate
- SLIM
Sliding Linear Model
- TBE
Tris/Borate/EDTA
- Tris
Trisaminomethane
- UTR
untranslated region
Introduction
Imprinted domains containing multiple genes are typically governed by an imprinting control region (ICR) or imprinting center (IC) that regulates parent-of-origin epigenotypes and gene expression patterns across the domain.1 This includes establishing and/or maintaining allele-specific DNA methylation patterns at differentially methylated regions (DMRs) associated with the imprinted genes regulated by these ICs. An example of this is found in the imprinted Angelman/Prader-Willi syndrome (AS/PWS) domain, a ∼2 Mb region of human chromosome 15q11-q13 associated with 2 clinically distinct neurogenetic diseases, the Angelman (AS) and Prader-Willi (PWS) syndromes.2 Genomic imprinting across the domain is controlled by a bipartite IC composed of the PWS-IC and AS-IC. This IC regulates parent-of-origin expression of genes and transcripts that include SNURF/SNRPN (hereafter referred to as SNRPN), NECDIN (NDN), MAGEL2, and MKRN3, which are expressed exclusively from the paternally-inherited chromosome, and UBE3A and ATP10A which are expressed exclusively from the maternally-inherited chromosome in certain cells/tissues. 3,4 PWS is associated with loss of expression of paternally-expressed genes, while AS is associated with loss of function of the UBE3A gene.5 Each of the paternally-expressed genes is associated with a CpG island (CGI) DMR, which is unmethylated on the paternal allele and hypermethylated on the maternal allele.6-8 The paternal epigenotype on the paternally-inherited chromosome is governed by the PWS-IC, while the AS-IC establishes the maternal epigenotype on the maternally-inherited chromosome by acting as a negative regulator of the PWS-IC.5,9-11 The PWS-IC is associated with the 5′ flanking region, the first exon, and 5′ end of the first intron of the SNRPN gene and in humans is defined by a series of microdeletions in Prader-Willi syndrome patients with an overlapping and common 4.3 kb interval termed the PWS-SRO (shortest region of deletion overlap).3 Similarly, the AS-IC is defined by microdeletions in Angelman syndrome patients that share a common 0.88 kb deleted AS-SRO located ∼35 kb upstream of the PWS-IC. Paternally-inherited deletion of the PWS-IC results in an aberrant maternal epigenotype and loss of expression of paternally-expressed genes (e.g., NDN, MAGEL2, MKRN3).3,10,12-15
The syntenic mouse AS/PWS domain on chromosome 7 spans ∼3.7 Mb and is generally organized and imprinted in the same manner as the human with the addition of the paternally-expressed Frat3 gene16,17 (among other species-specific genes within the domain). The murine PWS-IC was first defined by a targeted 35 kb deletion of the 5′ region of the Snrpn gene and has been further delineated by a targeted 6 kb deletion of the 5′ region of the Snrpn gene.10,18 As with the human PWS-IC, when this deletion is paternally-transmitted, paternally-expressed genes are epigenetically silenced on the paternal chromosome.3,10,12-15
However, the extent to which the PWS-IC affects DNA methylation patterns across the entire imprinted AS/PWS domain, particularly outside of CpG island DMRs, has not been fully characterized. In addition, little is known about the potential influence of the PWS-IC on DNA methylation patterns outside of the AS/PWS domain. To provide a detailed high resolution analysis of the effects of the PWS-IC on DNA methylation both within and outside of the AS/PWS domain, we have performed reduced representation bisulfite sequencing (RRBS) methylation profiling on brain genomic DNA from mice carrying either a maternally- or paternally-transmitted deletion of the PWS-IC. We found that within the AS/PWS domain loss of the paternal PWS-IC resulted in hypermethylation of CpG islands as well as flanking CpG island shores 19 associated with promoter DMRs of paternally-expressed genes. Little effect on DNA methylation in other regions within the domain was detected upon paternal PWS-IC deletion. Deletion of the maternal PWS-IC also yielded no significant changes in DNA methylation across the domain. Interestingly, both paternal and maternal PWS-IC deletion resulted in altered methylation at both intra- and interchromosomal CpG sites outside of the AS/PWS domain, suggesting the PWS-IC may have a functional role outside of the imprinted AS/PWS domain.
Results
High resolution DNA methylation analysis was performed across the mouse brain genome by reduced representation bisulfite sequencing (RRBS 20,21). Methylation patterns were examined in genomic DNA from brain tissue of newborn mice carrying a 35 kb deletion of the PWS-IC on either the paternally- or maternally-inherited chromosome.14,18 Methylation patterns in mice carrying these deletions were compared to methylation patterns of normal control littermates to identify CpG sites whose methylation levels changed in the absence of the PWS-IC. These studies allowed us to examine the consequences of the paternally-inherited (pat) and maternally-inherited (mat) PWS-IC deletion on DNA methylation patterns both across the imprinted AS/PWS domain as well as outside of the domain.
RRBS data were generated from 62 to 150 million raw sequence reads per sample (Supplemental Table 1), yielding 31 to 64 million aligned reads (after masking repetitive sequences) and a mapping efficiency of 53–55%. The resulting number of autosomal CpG sites interrogated in all 3 samples (normal control, pat PWS-IC deletion, mat PWS-IC deletion) at a read depth ≥30 was 758,421 (Supplemental Table 2), which represents ∼6% of the single copy murine methylome (only autosomal sites were analyzed because animals were selected for analysis irrespective of sex). We first examined methylation levels at 254 CpG sites across the imprinted AS/PWS domain in normal controls and in samples carrying either a mat or pat PWS-IC deletion. We then identified CpG sites outside of the imprinted domain whose methylation levels were altered by deletion of either the mat or pat PWS-IC deletion.
Table 1.
Number of CpG sites outside of the imprinted AS/PWS domain showing altered DNA methylation levels upon PWS-IC deletion
| Read Depth | ≥ 10 | ≥ 20 | ≥ 30 | ≥ 40 | ≥ 50 | ≥ 60 | ≥ 70 | ≥ 80 | ≥ 90 | ≥ 100 |
|---|---|---|---|---|---|---|---|---|---|---|
| Wild Type Vs. Paternal Deletion | 282 | 278 | 273 | 256 | 228 | 189 | 161 | 121 | 91 | 59 |
| Wild Type Vs. Maternal Deletion | 304 | 304 | 298 | 273 | 250 | 217 | 199 | 157 | 127 | 99 |
RRBS analysis of the number of CpG sites with altered methylation levels at each read depth (column header) with a change in methylation of at least ±25% (absolute value; see text) and a q-value of 0.01 or less (compared to the wild-type control).
Analysis of CpG sites across the imprinted AS/PWS domain
The effect of PWS-IC deletion on parent-of-origin gene expression has been reported previously for both the human and mouse AS/PWS domains.3 In addition, the effect of PWS-IC deletion on methylation of DMRs associated with promoter CpG islands has been examined. Analyses of individual loci indicate that a paternal PWS-IC deletion yields a hypermethylated maternal epigenotype on the paternal allele in the promoter DMRs of paternally-expressed genes (e.g., 3,10,12-14). Thus, a pat PWS-IC deletion is expected to approximately double the overall methylation level of each CpG site within AS/PWS DMRs compared to a normal control. In contrast, mat PWS-IC deletion appears to have little or no effect on methylation levels of either the maternal or paternal alleles within these DMRs. However, a detailed and comprehensive DNA methylation analysis of the effects of PWS-IC deletion across the AS/PWS domain (including non-CpG island regions) under the same experimental conditions has not been performed. Furthermore, 4C analysis by Yasui et al. indicated that the PWS-IC engages in multiple interactions across the AS/PWS domain in human neuroblasts,22 suggesting the possibility that the PWS-IC may influence DNA methylation patterns outside of promoter CpG island DMRs within the imprinted AS/PWS domain.
For a comprehensive high-resolution analysis of CpG methylation across the AS/PWS domain by RRBS, we used a minimal read depth ≥10 in PWS-IC deletion samples as well as controls (though the average read depth at each CpG site across the domain was >100; see Supplemental Table 3). From these data, we identified and interrogated 254 CpG sites spanning ∼3.7 Mb of the imprinted domain from the 5′ end of the Frat3 locus to the 5′ end of the Atp10a gene (Fig. 1). Methylation levels at each of these sites were determined for the paternally-inherited (pat) PWS-IC deletion, the maternally-inherited (mat) PWS-IC deletion, and normal controls, then plotted as shown in Figures 2 and Supplemental Figure 1. Figure 2 shows the effects of the PWS-IC deletion at the 5′ regions of Ndn, Magel2, Mkrn3, and Frat3, regions that have previously been shown to be CpG islands and DMRs.3,6,7 RRBS interrogated 71 CpGs in the Frat3 DMR (Fig. 2A), far more than any other AS/PWS DMR, allowing for a detailed examination of the effect of the PWS-IC on Frat3 methylation. We found that in the pat PWS-IC deletion, the majority (∼90%) of individual CpG sites across the Frat3 DMR showed increased DNA methylation levels approximately fold2- above wild-type DNA methylation levels, regardless of the methylation level in wild-type mice. In addition, examination of the adjacent CpG island shore 19 showed a similar effect of the pat PWS-IC deletion (i.e., ∼2-fold increase in methylation), indicating that action of the PWS-IC on the paternal Frat3 allele extends outside of the immediate CpG island into the flanking CGI shore. In contrast, mat deletion of the PWS-IC showed minimal effect on methylation of the Frat3 DMR, with methylation levels of most CpG sites similar for the mat deletion and wild-type controls (Fig. 2A). Examination of the Mkrn3, Magel2, and Ndn DMRs (Fig. 2B-D) provided similar results to that of Frat3; the pat PWS-IC deletion resulted in approximately a 2-fold increase in methylation level at most CpG sites within the CpG island, while mat deletion yielded minimal change in methylation levels compared to wild-type controls at most CpGs within the island. For the CpG island shore of Mkrn3 (Fig. 2B) and the CpG island shelf 23 flanking the Ndn DMR (Fig. 2D; no CpG sites within the Ndn shore were interrogated), the effect of the pat deletion was similar to that observed in the body of the CpG islands. However, the CpG island shore of Magel2 (Fig. 2C) showed a gradually diminishing effect of pat PWS-IC deletion further away from the CpG island as the level of methylation increased in normal controls until the effect of the PWS-IC deletion was lost as the CpG island shore transitioned into the flanking exon. Thus, not all CpG island shores of these target genes of the PWS-IC are full DMRs regulated by the PWS-IC. Data from both the pat and mat deletions also showed a strong concordance in the change in methylation between methylation of the upper and lower strand of a given CpG site (indicated by underlined CpG sites in Fig. 2), indicating predominantly symmetrical changes in methylation at each CpG in response to the PWS-IC deletion. Percent methylation, read depth, and statistical values are listed for all individual CpG sites interrogated by RRBS across the AS/PWS imprinted domain in Supplemental Table 3.
Figure 1.
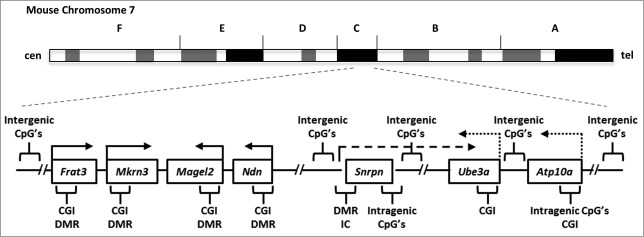
Organization of the imprinted murine AS/PWS domain. The ∼3.7 Mb region of the PWS/AS imprinted domain is depicted (not drawn to scale) relative to its location and orientation on mouse chromosome 7. Arrows above each gene indicate direction of transcription; solid arrows indicate genes that are paternally expressed, dotted arrows indicate genes that are maternally expressed. The long dashed arrow indicates the Snrpn primary transcript that extends into Ub3a and includes transcripts for Snord116 RNA's and the HG116 lncRNA.29 Brackets indicate approximate regions of RRBS coverage (see Figure 2 and Supplemental Fig. 1). “CGI” represents the location of CpG islands, “DMR” indicates differentially methylated regions, and “IC” indicates the region of the AS/PWS imprinting center.
Figure 2.
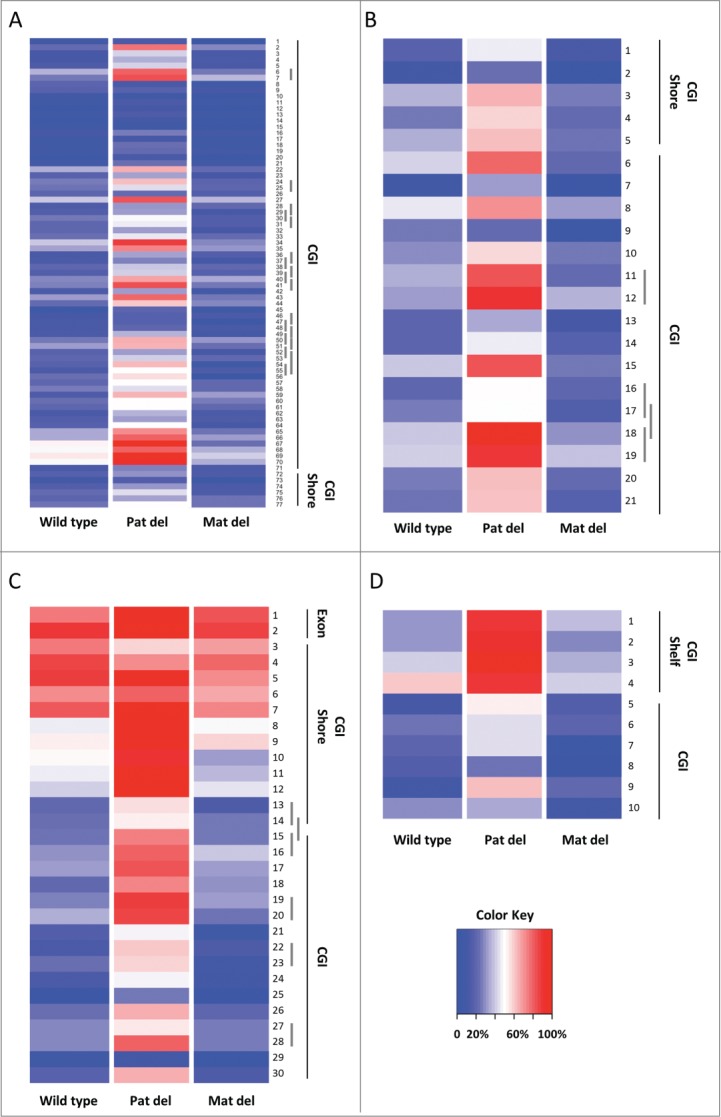
(See previous page). RRBS analysis of DMRs within the imprinted AS/PWS domain. For each heat map, individual CpG's are numbered as listed in Supplemental Table 3. Percent DNA methylation is indicated with a range of color, from 0% methylation in deep blue to 100% methylation in deep red, with 50% methylation indicated with white (see Color Key). Dark vertical lines along each graph indicate genomic features within each region: CGI (CpG island), CGI shore (defined as 2 kb region flanking either side of a CGI; 47, and CGI shelf (defined as the regions 2 to 4 Kb flanking a CGI 23). Short vertical gray bars along CpG numbers denote symmetrical CpG sites on opposite DNA strands. Sample names are indicated at the bottom of each lane of each heat map; “Pat del” denotes the paternal PWS-IC deletion, “Mat del” denotes the maternal PWS-IC deletion. The genes analyzed were: (A) Frat3, (B) Mkrn3, (C) Magel2, and (D) Ndn. The data shown are for CpG sites with a read depth of at least 10 sequences. Heat maps were generated using the gplots R library package (http://cran.r-project.org/package=gplots).
We also analyzed the effect of PWS-IC deletion on methylation levels across the AS/PWS domain in non-DMR regions (Supplemental Fig. 1). This included the region between Ndn and Snrpn (Supplemental Fig. 1A), the Snrpn locus (Supplemental Fig. 1B), downstream of Snrpn including the Snord116 region (Supplemental Fig. 1C), the Ube3a CpG island (Supplemental Fig. 1D), the intergenic region between Ube3a and Atp10a (Supplemental Fig. 1E), and the Atp10a locus (Supplemental Fig. 1F). Overall, these regions show little, if any, effect of PWS-IC deletion on DNA methylation levels. Two sites in an intron of the AK086712 transcript between Ndn and Snrpn (Supplemental Fig. 1A, CpGs #1 and 2) do appear to show similar levels of increased methylation in response to both the pat and mat PWS-IC deletion relative to wild-type levels, though these changes are not statistically significant; in addition, CpG #13 in Supplemental Fig. 1A shows a notable and statistically significant increase in methylation upon pat PWS-IC deletion. The significance of methylation changes at these sites is unclear. Consistent with previous reports (D. Driscoll, personal communication; 2,5,24), the CpG islands associated with Ube3a and Atp10a are not DMRs and PWS-IC deletion has no effect on their methylation (Supplemental Fig. 1D and F). These data confirm that the primary effect of the PWS-IC on DNA methylation in the AS/PWS domain occurs at, and flanking, CpG island DMRs. To our knowledge, this is the first comprehensive analysis of the effects of PWS-IC deletion on DNA methylation across the murine AS/PWS domain.
Analysis of CpG sites outside of the AS/PWS domain
In addition to determining the effects of the PWS-IC on DNA methylation across the AS/PWS domain, our RRBS analysis also allowed for an analysis of the potential effects of the PWS-IC on loci outside of the imprinted domain. To identify CpG sites outside of the imprinted domain whose methylation levels were altered by PWS-IC deletion, we required: 1) a read depth ≥30, 2) an absolute change in methylation level relative to normal controls (either increased or decreased) of >25% (e.g., 5% methylation in controls versus 30% methylation in the deletion), and 3) a q-value of <0.01. Using these criteria, 273 autosomal CpG sites showed methylation differences between normal controls and the paternal PWS-IC deletion, and surprisingly, 298 autosomal CpG sites showed methylation differences between the normal controls and the maternal deletion (Table 1). To further narrow the number of candidate sites affected by the PWS-IC deletion and reduce the potential for detecting false positives, we identified a subset of these CpG sites with at least one other CpG within 250 bp which showed a coordinate change in methylation (i.e., increased or decreased methylation with a similar magnitude of change). The detailed results of these analyses are shown in Tables 2 and 3. For the pat PWS-IC deletion, we identified 55 such CpG sites of altered DNA methylation associated with 17 loci/regions outside of the AS/PWS domain (Table 2). Two of these loci are in promoter regions, 2 are within exons of known genes or transcripts, 8 are within introns of known genes/transcripts, 2 are in CpG islands, 2 are in CpG island shores, 1 is in a 3′ UTR, one is in a 3′ flanking region, 4 are intergenic, and 6 are associated with DNase I hypersensitive (DH) regions (or “hotspots; 25) in brain tissue or embryonic stem cells as indicated in the UCSC Genome Browser (http://genome.ucsc.edu/). Such DH sites/hotspots in chromatin are typically associated with regulatory regions. In addition, 5 regions/loci contained ≥3 CpG sites showing coordinate changes in methylation spanning an interval <200 bp (e.g., intron 2 of Socs5).
Table 2.
CpG sites outside of the imprinted AS/PWS domain showing significant changes in DNA methylation upon paternal PWS-IC deletion
| Wild Type |
Paternal Deletion |
||||||||||
|---|---|---|---|---|---|---|---|---|---|---|---|
| Chr. | Position | Gene Symbol | Genomic Feature | DHS | Distance to TSS (bp) | Read Depth | % Methylation | Read Depth | % Methylation | q-value | % Difference |
| chr3 | 101,903,373 | Casq2 | Intron (1 of 10) | C | 12,995 | 126 | 38.9% | 50 | 74.0% | 0.0068 | 35.1% |
| chr3 | 101,903,383 | Casq2 | Intron (1 of 10) | C | 13,005 | 127 | 28.3% | 50 | 72.0% | 0.0001 | 43.7% |
| chr6 | 37,130,889 | Dgki | Intron (1 of 33) | 119,087 | 267 | 54.3% | 155 | 88.4% | <0.0001 | 34.1% | |
| chr6 | 37,130,890 | Dgki | Intron (1 of 33) | 119,086 | 196 | 52.6% | 94 | 81.9% | 0.0006 | 29.4% | |
| chr6 | 108,410,583 | Itpr1 | Intron (44 of 61) | 162,578 | 206 | 66.5% | 145 | 95.2% | <0.0001 | 28.7% | |
| chr6 | 108,410,584 | Itpr1 | Intron (44 of 61) | 162,577 | 170 | 57.6% | 81 | 95.1% | <0.0001 | 37.4% | |
| chr6 | 144,953,028 | Bcat1 | Intron (9 of 10) | E | 44,304 | 280 | 28.2% | 32 | 93.7% | <0.0001 | 65.5% |
| chr6 | 144,953,117 | Bcat1 | Intron (9 of 10) | E | 44,215 | 163 | 41.1% | 34 | 94.1% | <0.0001 | 53.0% |
| chr7 | 70,947,873 | Otud7a | Intergenic | E | 358,215 | 102 | 95.1% | 56 | 37.5% | <0.0001 | −57.6% |
| chr7 | 70,947,878 | Otud7a | Intergenic | E | 358,220 | 102 | 97.1% | 56 | 35.7% | <0.0001 | −61.3% |
| chr7 | 70,947,883 | Otud7a | Intergenic | E | 358,225 | 102 | 92.2% | 56 | 33.9% | <0.0001 | −58.2% |
| chr7 | 70,947,884 | Otud7a | Intergenic | E | 358,226 | 74 | 94.6% | 44 | 43.2% | <0.0001 | −51.4% |
| chr7 | 70,947,906 | Otud7a | Intergenic | E | 358,248 | 95 | 86.3% | 52 | 30.8% | <0.0001 | −55.5% |
| chr7 | 70,947,907 | Otud7a | Intergenic | E | 358,249 | 77 | 90.9% | 48 | 39.6% | <0.0001 | −51.3% |
| chr7 | 70,947,911 | Otud7a | Intergenic | E | 358,253 | 83 | 80.7% | 49 | 30.6% | <0.0001 | −50.1% |
| chr7 | 70,947,912 | Otud7a | Intergenic | E | 358,254 | 77 | 72.7% | 48 | 33.3% | 0.0050 | −39.4% |
| chr7 | 70,947,920 | Otud7a | Intergenic | E | 358,262 | 302 | 83.1% | 123 | 43.9% | <0.0001 | −39.2% |
| chr7 | 70,947,921 | Otud7a | Intergenic | E | 358,263 | 77 | 87.0% | 48 | 41.7% | 0.0001 | −45.3% |
| chr7 | 70,948,009 | Otud7a | Intergenic | E | 358,351 | 149 | 90.6% | 137 | 43.8% | <0.0001 | −46.8% |
| chr7 | 70,948,029 | Otud7a | Intergenic | E | 358,371 | 149 | 98.7% | 136 | 41.9% | <0.0001 | −56.7% |
| chr7 | 73,415,649 | Lrrk1 | Exon (28 of 34) | 117,578 | 167 | 99.4% | 79 | 39.2% | <0.0001 | −60.2% | |
| chr7 | 73,415,650 | Lrrk1 | Exon (28 of 34) | 117,577 | 409 | 96.8% | 169 | 45.0% | <0.0001 | −51.9% | |
| chr9 | 14,650,163 | Gpr83 | Intergenic/CGI | −14,535 | 79 | 78.5% | 47 | 34.0 | 0.0006 | −44.4% | |
| chr9 | 14,650,174 | Gpr83 | Intergenic/CGI | −14,524 | 79 | 75.9% | 47 | 36.2 | 0.0038 | −39.8% | |
| chr9 | 14,650,178 | Gpr83 | Intergenic/CGI | −14,520 | 79 | 77.2% | 46 | 37.0 | 0.0049 | −40.3% | |
| chr9 | 44,576,404 | Arcn1 | Promoter/CGI Shore | −513 | 171 | 45.0% | 108 | 83.3 | <0.0001 | 38.3% | |
| chr9 | 44,576,482 | Arcn1 | Promoter/CGI Shore | −591 | 115 | 46.1% | 59 | 81.4 | 0.0029 | 35.3% | |
| chr9 | 59,163,689 | Adpgk | 3’ UTR | W | 24,310 | 255 | 53.3% | 93 | 82.8% | 0.0002 | 29.5% |
| chr9 | 59,163,745 | Adpgk | 3’ UTR | W | 24,366 | 242 | 59.9% | 109 | 90.8% | <0.0001 | 30.9% |
| chr10 | 22,101,719 | Raet1d | Intergenic | 20,019 | 247 | 16.6% | 74 | 48.6 | 0.0001 | 32.0% | |
| chr10 | 22,101,720 | Raet1d | Intergenic | 20,020 | 158 | 14.6% | 57 | 50.9 | 0.0001 | 36.3% | |
| chr11 | 5,907,390 | Camk2b | Intron (3 of 20) | 51,629 | 91 | 52.7% | 40 | 12.5 | 0.0040 | −40.2% | |
| chr11 | 5,907,411 | Camk2b | Intron (3 of 20) | 51,650 | 91 | 49.5% | 40 | 7.5 | 0.0007 | −42.0% | |
| chr11 | 88,976,048 | Gm525 | Intergenic | 40,893 | 145 | 52.4% | 87 | 85.1% | 0.0002 | 32.6% | |
| chr11 | 88,976,053 | Gm525 | Intergenic | 40,898 | 154 | 50.6% | 89 | 85.4% | <0.0001 | 34.7% | |
| chr12 | 70,683,868 | Mettl21d | Promoter/CGI | W/E/C | 147 | 236 | 34.3% | 100 | 0.0% | <0.0001 | −34.3% |
| chr12 | 70,683,874 | Mettl21d | Promoter/CGI | W/E/C | 141 | 236 | 33.9% | 100 | 0.0% | <0.0001 | −33.9% |
| chr12 | 70,683,888 | Mettl21d | Promoter/CGI | W/E/C | 127 | 236 | 35.2% | 100 | 0.0% | <0.0001 | −35.2% |
| chr12 | 70,683,906 | Mettl21d | Promoter/CGI | W/E/C | 109 | 196 | 31.6% | 91 | 0.0% | <0.0001 | −31.6% |
| chr12 | 114,428,451 | Tmem121 | 3’ Flanking Region/CGI Shore | 4,337 | 288 | 60.4% | 121 | 91.7% | <0.0001 | 31.3% | |
| chr12 | 114,428,537 | Tmem121 | 3’ Flanking Region/CGI Shore | 4,423 | 325 | 63.4% | 111 | 93.7% | <0.0001 | 30.3% | |
| chr15 | 83,872,730 | Efcab6 | Intron (3 of 31) | 23,049 | 376 | 49.2% | 132 | 76.5% | <0.0001 | 27.3% | |
| chr15 | 83,872,765 | Efcab6 | Intron (3 of 31) | 23,014 | 211 | 68.2% | 108 | 94.4% | <0.0001 | 26.2% | |
| chr15 | 83,872,788 | Efcab6 | Intron (3 of 31) | 22,991 | 213 | 65.7% | 109 | 91.7% | 0.0001 | 26.0% | |
| chr17 | 87,524,852 | Socs5 | Intron (2 of 2) | W | 17,833 | 199 | 21.1% | 82 | 57.3% | <0.0001 | 36.2% |
| chr17 | 87,524,887 | Socs5 | Intron (2 of 2) | W | 17,868 | 175 | 21.7% | 78 | 57.7% | <0.0001 | 36.0% |
| chr17 | 87,524,890 | Socs5 | Intron (2 of 2) | W | 17,871 | 150 | 20.7% | 73 | 50.7% | 0.0033 | 30.0% |
| chr17 | 87,524,905 | Socs5 | Intron (2 of 2) | W | 17,886 | 233 | 14.6% | 96 | 54.2% | <0.0001 | 39.6% |
| chr17 | 87,524,921 | Socs5 | Intron (2 of 2) | W | 17,902 | 233 | 24.9% | 96 | 59.4% | <0.0001 | 34.5% |
| chr17 | 87,524,924 | Socs5 | Intron (2 of 2) | W | 17,905 | 233 | 13.3% | 96 | 50.0% | <0.0001 | 36.7% |
| chr17 | 87,524,929 | Socs5 | Intron (2 of 2) | W | 17,910 | 233 | 14.2% | 96 | 55.2% | <0.0001 | 41.0% |
| chr17 | 87,524,931 | Socs5 | Intron (2 of 2) | W | 17,912 | 233 | 14.2% | 96 | 53.1% | <0.0001 | 39.0% |
| chr17 | 87,524,960 | Socs5 | Intron (2 of 2) | W | 17,941 | 154 | 18.8% | 48 | 58.3% | 0.0003 | 39.5% |
| chr19 | 57,457,621 | Fam160b1 | Intron (12 of 16) | 22,122 | 49 | 51.0% | 47 | 91.5% | 0.0037 | 40.5% | |
| chr19 | 57,457,682 | Fam160b1 | Exon (13 of 17) | 22,183 | 204 | 62.7% | 56 | 96.4% | 0.0001 | 33.7% | |
Each line represents a single CpG site from RRBS analysis. DNA methylation changes (compared to the wild-type control) at each CpG site were deemed to be significant if they showed: 1) a read depth ≥30, 2) a methylation change of at least an absolute value of ±25% (see text), 3) a q-value of ≤0.01, and 4) 2 or more CpG sites within 250 bp of each other with similar increases or decreases in methylation. “Chr” denotes chromosome number; “TSS” denotes transcription start site; “DHS” indicates that a CpG site falls within a hotspot of DNase I hypersensitivity as determined by the UCSC Genome Browser tracks for DNase I from the University of Washington (W = E14.5 whole brain; E = ES cells; C = Cerebrum); “CGI” denotes CpG Island; “CGI Shore” denotes the 2 kb regions flanking a CGI; “Promoter” denotes a region ± 2 Kb from a transcription start site; “Intergenic” denotes sites >10 Kb from the nearest known gene; “3’ Flanking Region” denotes sites within 10 Kb downstream of the end of a known transcript. CpG sites within 10 Kb of a known gene were deemed to be associated with that gene; intergenic CpG sites were associated with the gene symbol of the nearest transcription start site. All other genomic features are as described for RefSeq entries in the UCSC Genome Browser. Bolded entries are those CpG sites of altered methylation common to both the paternal and the maternal PWS-IC deletion.
Table 3.
CpG sites outside of the imprinted AS/PWS domain showing significant changes in DNA methylation upon maternal PWS-IC deletion
| Wild Type |
Maternal Deletion |
||||||||||
|---|---|---|---|---|---|---|---|---|---|---|---|
| Chr. | Position | Gene Symbol | Genomic Feature | DHS | Distance to TSS (bp) | Read Depth | % Methylation | Read Depth | % Methylation | q-value | % Difference |
| chr2 | 50,844,062 | Gm13498 | Intergenic | C | 78,858 | 112 | 66.1% | 93 | 32.3% | 0.0023 | −33.8% |
| chr2 | 50,844,077 | Gm13498 | Intergenic | C | 78,873 | 111 | 66.7% | 93 | 32.3% | 0.0021 | −34.4% |
| chr2 | 50,844,086 | Gm13498 | Intergenic | C | 78,882 | 112 | 67.9% | 92 | 30.4% | 0.0003 | −37.4% |
| chr3 | 9,624,200 | Zfp704 | Intergenic | −14,115 | 207 | 63.3% | 97 | 93.8% | <0.0001 | 30.5% | |
| chr3 | 9,624,287 | Zfp704 | Intergenic | −14,202 | 78 | 55.1% | 52 | 96.2% | 0.0002 | 41.0% | |
| chr4 | 40,722,551 | Smu1 | Intergenic | −17,633 | 200 | 61.5% | 139 | 35.3% | 0.0028 | −26.2% | |
| chr4 | 40,722,584 | Smu1 | Intergenic | −17,666 | 195 | 52.3% | 138 | 23.9% | 0.0004 | −28.4% | |
| chr4 | 51,267,094 | Cylc2 | Intergenic | 37,544 | 162 | 65.4% | 70 | 24.3% | <0.0001 | −41.1% | |
| chr4 | 51,267,104 | Cylc2 | Intergenic | 37,554 | 160 | 63.1% | 70 | 22.9% | 0.0001 | −40.3% | |
| chr4 | 51,267,110 | Cylc2 | Intergenic | 37,560 | 162 | 64.2% | 70 | 24.3% | 0.0001 | −39.9% | |
| chr4 | 51,267,121 | Cylc2 | Intergenic | 37,571 | 162 | 63.6% | 70 | 24.3% | 0.0001 | −39.3% | |
| chr5 | 55,043,353 | Gm10440 | Intergenic | 302,122 | 189 | 67.2% | 105 | 95.2% | <0.0001 | 28.0% | |
| chr5 | 55,043,363 | Gm10440 | Intergenic | 302,132 | 187 | 68.4% | 105 | 95.2% | 0.0001 | 26.8% | |
| chr5 | 55,043,366 | Gm10440 | Intergenic | 302,135 | 190 | 61.6% | 105 | 87.6% | 0.0018 | 26.0% | |
| chr6 | 108,410,583 | Itpr1 | Intron (44 of 61) | 162,578 | 206 | 66.5% | 80 | 92.5% | 0.0030 | 26.0% | |
| chr6 | 108,410,584 | Itpr1 | Intron (44 of 61) | 162,577 | 170 | 57.6% | 52 | 98.1% | <0.0001 | 40.4% | |
| chr6 | 136,938,767 | Pde6h | Intergenic | E | 35,723 | 282 | 56.0% | 98 | 27.6% | 0.0018 | −28.5% |
| chr6 | 136,938,827 | Pde6h | Intergenic | E | 35,783 | 292 | 49.0% | 124 | 21.8% | 0.0005 | −27.2% |
| chr6 | 144,953,028 | Bcat1 | Intron (9 of 10) | 44,304 | 280 | 28.2% | 36 | 100.0% | <0.0001 | 71.8% | |
| chr6 | 144,953,117 | Bcat1 | Intron (9 of 10) | 44,215 | 163 | 41.1% | 38 | 94.7% | <0.0001 | 53.6% | |
| chr7 | 70,947,873 | Otud7a | Intergenic | E | 358,215 | 102 | 95.1% | 60 | 30.0% | <0.0001 | -65.1% |
| chr7 | 70,947,878 | Otud7a | Intergenic | E | 358,220 | 102 | 97.1% | 58 | 29.3% | <0.0001 | -67.7% |
| chr7 | 70,947,883 | Otud7a | Intergenic | E | 358,225 | 102 | 92.2% | 60 | 30.0% | <0.0001 | -62.2% |
| chr7 | 70,947,884 | Otud7a | Intergenic | E | 358,226 | 74 | 94.6% | 52 | 21.2% | <0.0001 | -73.4% |
| chr7 | 70,947,906 | Otud7a | Intergenic | E | 358,248 | 95 | 86.3% | 60 | 28.3% | <0.0001 | -58.0% |
| chr7 | 70,947,907 | Otud7a | Intergenic | E | 358,249 | 77 | 90.9% | 52 | 19.2% | <0.0001 | -71.7% |
| chr7 | 70,947,911 | Otud7a | Intergenic | E | 358,253 | 83 | 80.7% | 57 | 24.6% | <0.0001 | -56.2% |
| chr7 | 70,947,912 | Otud7a | Intergenic | E | 358,254 | 77 | 72.7% | 52 | 21.2% | <0.0001 | -51.6% |
| chr7 | 70,947,920 | Otud7a | Intergenic | E | 358,262 | 302 | 83.1% | 165 | 25.5% | <0.0001 | -57.7% |
| chr7 | 70,947,921 | Otud7a | Intergenic | E | 358,263 | 77 | 87.0% | 52 | 21.2% | <0.0001 | -65.9% |
| chr7 | 70,948,009 | Otud7a | Intergenic | E | 358,351 | 149 | 90.6% | 148 | 56.8% | <0.0001 | -33.8% |
| chr7 | 70,948,029 | Otud7a | Intergenic | E | 358,371 | 149 | 98.7% | 148 | 54.7% | <0.0001 | -43.9% |
| chr7 | 73,415,649 | Lrrk1 | Exon (28 of 34) | 117,578 | 167 | 99.4% | 65 | 44.6% | <0.0001 | -54.8% | |
| chr7 | 73,415,650 | Lrrk1 | Exon (28 of 34) | 117,577 | 409 | 96.8% | 151 | 37.7% | <0.0001 | -59.1% | |
| chr7 | 73,427,186 | Lrrk1 | Exon (22 of 34) | 106,041 | 138 | 76.8% | 98 | 45.9% | 0.0020 | −30.9% | |
| chr7 | 73,427,200 | Lrrk1 | Exon (22 of 34) | 106,027 | 137 | 73.0% | 98 | 39.8% | 0.0009 | −33.2% | |
| chr7 | 73,427,354 | Lrrk1 | Intron (21 of 33) | 105,873 | 341 | 55.4% | 138 | 27.5% | 0.0001 | −27.9% | |
| chr9 | 59,163,689 | Adpgk | 3’UTR | W | 24,310 | 255 | 53.3% | 88 | 85.2% | 0.0001 | 31.9% |
| chr9 | 59,163,745 | Adpgk | 3’UTR | W | 24,366 | 242 | 59.9% | 85 | 90.6% | 0.0001 | 30.7% |
| chr10 | 40,021,956 | Amd2 | Promoter/5’ UTR/CCI | W/C | 36 | 87 | 67.8% | 59 | 30.5% | 0.0098 | −37.3% |
| chr10 | 40,021,973 | Amd2 | Promoter/5’ UTR/CCI | W/C | 19 | 87 | 67.8% | 59 | 30.5% | 0.0098 | −37.3% |
| chr11 | 88,976,048 | Gm525 | Intergenic | 40,893 | 145 | 52.4% | 97 | 95.9% | <0.0001 | 43.5% | |
| chr11 | 88,976,053 | Gm525 | Intergenic | 40,898 | 154 | 50.6% | 97 | 88.7% | <0.0001 | 38.0% | |
| chr12 | 70,683,868 | Mettl21d | Promoter/CGI | W/E/C | 147 | 236 | 34.3% | 166 | 0.0% | <0.0001 | −34.3% |
| chr12 | 70,683,874 | Mettl21d | Promoter/CGI | W/E/C | 141 | 236 | 33.9% | 166 | 0.0% | <0.0001 | -33.9% |
| chr12 | 70,683,888 | Mettl21d | Promoter/CGI | W/E/C | 127 | 236 | 35.2% | 166 | 0.0% | <0.0001 | -35.2% |
| chr12 | 70,683,906 | Mettl21d | Promoter/CGI | W/E/C | 109 | 196 | 31.6% | 165 | 0.0% | <0.0001 | -31.6% |
| chr12 | 99,915,836 | Ptpn21 | 3’ UTR | W/C | 6,124 | 161 | 79.5% | 104 | 52.9% | 0.0068 | −26.6% |
| chr12 | 99,915,876 | Ptpn21 | 3’ UTR | W/C | 6,114 | 292 | 67.1% | 113 | 39.8% | 0.0015 | −27.3% |
| chr12 | 114,428,451 | Tmem121 | 3’ Flanking Region/CGI Shore | 4,337 | 288 | 60.4% | 104 | 92.3% | <0.0001 | 31.9% | |
| chr12 | 114,428,537 | Tmem121 | 3’ Flanking Region/CGI Shore | 4,423 | 325 | 63.4% | 103 | 90.3% | 0.0001 | 26.9% | |
| chr15 | 83,872,730 | Efcab6 | Intron (3 of 31) | 23,049 | 376 | 49.2% | 100 | 78.0% | 0.0003 | 28.8% | |
| chr15 | 83,872,765 | Efcab6 | Intron (3 of 31) | 23,014 | 211 | 68.2% | 77 | 96.1% | 0.0003 | 27.9% | |
| chr15 | 83,872,788 | Efcab6 | Intron (3 of 31) | 22,991 | 213 | 65.7% | 77 | 94.8% | 0.0002 | 29.1% | |
| chr19 | 57,457,621 | Fam160b1 | Intron (12 of 16) | 22,122 | 49 | 51.0% | 44 | 95.5% | 0.0019 | 44.4% | |
| chr19 | 57,457,682 | Fam160b1 | Exon (13 of 17) | 22,183 | 204 | 62.7% | 82 | 96.3% | <0.0001 | 33.6% | |
All notations, symbols, and definitions are as described in Table 2.
For the mat PWS-IC deletion, we identified 56 CpG sites of altered methylation within 250 bp of another site with similarly altered methylation; these sites were associated with 19 loci/regions outside of the AS/PWS domain (see Table 3). Two of these loci are in promoter regions, 3 are within exons of known genes or transcripts, 5 are within introns of known genes/transcripts, 2 are in CpG islands, 1 is in a CpG island shore, 1 is in a 5′ UTR, 2 are in 3′ UTRs, one is in a 3′ flanking region, 8 are intergenic, and 7 are DH sites in brain tissue or embryonic stem cells. Additionally, 7 regions/loci contain ≥3 CpGs with altered DNA methylation levels within 200 bp. Surprisingly, a total of 31 CpG sites representing 10 loci showed altered DNA methylation in both the mat and pat PWS-IC deletions (shown in bold in Tables 2 and 3); these methylation changes in common between the pat and mat deletions showed the same direction (i.e., increase or decrease in methylation level) and magnitude of change in methylation due to PWS-IC deletion. We are unaware of any previous reports that the PWS-IC affects DNA methylation at loci outside of the imprinted AS/PWS domain. Interestingly, the Lrrk1 gene exhibits changes in methylation at 2 different regions upon maternal PWS-IC deletion, one in exon 22 and the other in exon 28; we counted these 2 separate changes within a single gene as methylation changes at 2 individual loci.
To verify the RRBS-detected changes in methylation outside of the AS/PWS domain upon PWS-IC deletion, we performed conventional locus-specific sodium bisulfite genomic sequencing (BGS; 26) on 2 selected loci, Socs5 (located on chromosome 17) and the chromosome 7 intergenic region downstream of Otud7a (see Tables 2 and 3). The intronic locus associated with Socs5 showed a coordinate increase in methylation at 9 CpG sites by RRBS in response to pat deletion of the PWS-IC, while 12 CpG sites in the chromosome 7 intergenic region downstream of Otud7a showed a coordinate decrease in methylation by RRBS with both mat and pat deletion of the PWS-IC. Two mice from different litters were subjected to BGS analysis for each locus, deletion, and normal control; the 2 mice carrying a pat PWS-IC deletion were also from a different litter than the pat PWS-IC deletion mouse used for RRBS. For Socs5, BGS PCR primers were designed to include 8 of the CpG sites detected by the RRBS analysis, as well an additional 14 flanking sites. As shown in Figure 3, we found that methylation levels by BGS at 8 CpG sites in Socs5 (also interrogated by RRBS) increased from an average of 41% in normal controls to an average of 68% in the paternal deletion (with a p-value of <0.05 at 7 of the 8 RRBS sites). BGS results between the duplicate animals used for analysis of the pat deletion and normal controls were generally concordant. Socs5 RRBS data showed that the pat PWS-IC deletion increased DNA methylation to an average of ∼55% from an average of ∼17% in the normal controls (Table 2). Although the absolute levels of methylation were lower overall in the RRBS dataset than was obtained by BGS, both the degree and direction of change in methylation obtained by BGS were by and large consistent with our RRBS results (including at flanking sites not interrogated by RRBS). The small difference in magnitude between the RRBS and BGS results for Socs5 methylation may have been due to a PCR and/or cloning bias.
Figure 3.
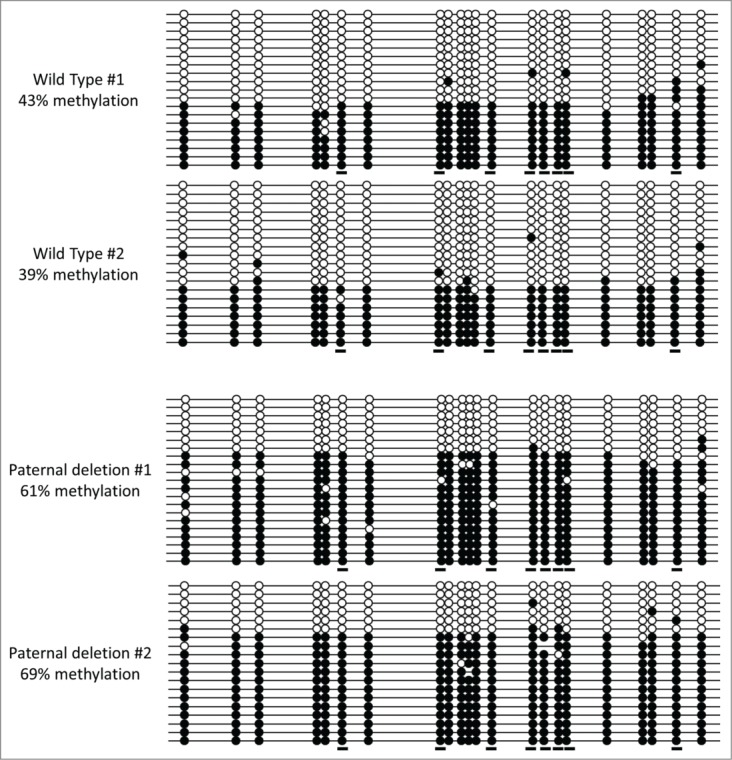
Sodium bisulfite genomic sequencing (BGS) of the Socs5-associated locus. Analysis was performed on brain DNA of 2 different wild-type mice and 2 different mice carrying a paternal PWS-IC deletion, all of which were littermates, but not littermates of the mouse used for RRBS analysis of a paternal PWS-IC deletion. Each horizontal line represents an individual sequenced DNA molecule, and each circle represents a CpG site. Filled circles denote a methylated CpG, and open circles denote an unmethylated CpG. Short horizontal underlines indicate CpG sites also interrogated by RRBS (see Tables 2 and 3). Percent methylation was calculated by dividing the total number of methylated CpG sites by the total number of CpG sites within each sample.
For the intergenic region on chromosome 7 ∼70 kb downstream of Otud7a, a similar BGS analysis was performed in mice carrying either the pat or mat PWS-IC deletion. RRBS data indicated the average methylation level of normal controls to be ∼90%, the pat PWS-IC deletion decreased methylation to an average of ∼38%, and the mat deletion decreased methylation to an average of ∼31%. Our BGS PCR primers amplified a region spanning 19 CpG sites, including 11 of the sites analyzed by RRBS. For BGS analysis (Fig. 4), the normal controls had an average DNA methylation level of ∼90%, while the average methylation levels of both the pat and mat PWS-IC deletions were ∼52%, all similar to results by RRBS. All 11 CpG sites in common had a significance of difference of <0.01. Thus, the BGS data for the chromosome 7 intergenic locus confirm the methylation levels and changes obtained by RRBS. These results also demonstrate that for this locus and the Socs5 intronic locus, the changes in methylation that we detected upon pat PWS-IC deletion were not unique to the single mouse used for RRBS analysis.
Figure 4.
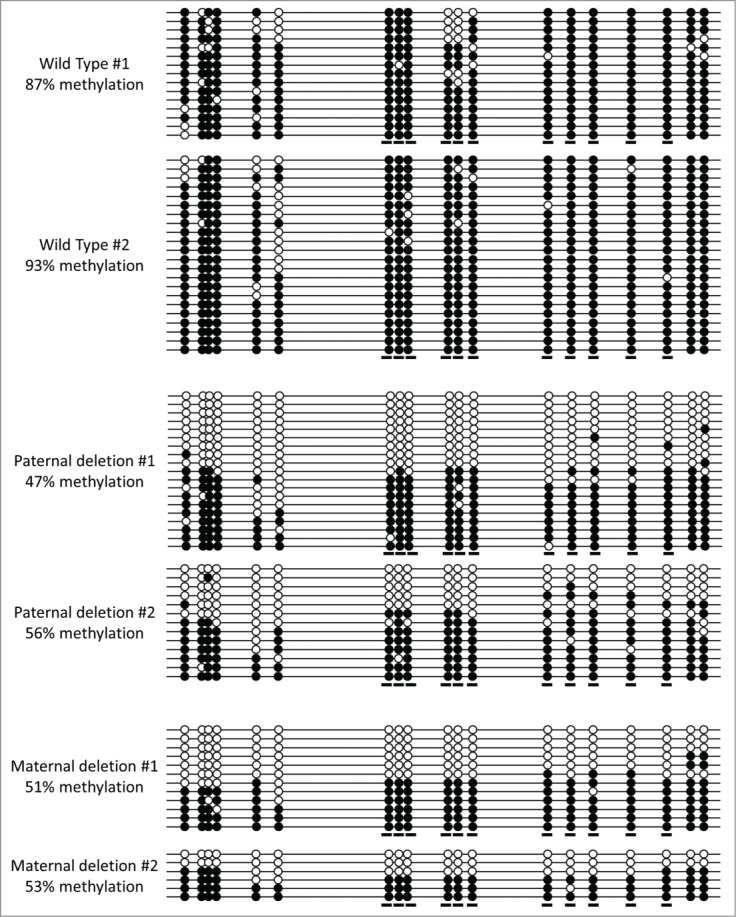
BGS analysis of the Otud7-associated locus. Analysis was performed on brain DNA of the same 2 wild-type and the 2 paternal PWS-IC deletion mice used for analysis of the Socs5-associated locus in Fig. 3; the 2 maternal PWS-IC deletion mice were littermates. All symbols, designations, and calculations are identical to those described for Fig. 3.
Overall, the majority (∼80%) of regions/loci showing a change in methylation in response to either mat or pat PWS-IC deletion mapped to within 10 kb of known genes/transcripts (or predicted genes) or to intergenic regions associated with a nuclease sensitive hotspot.25 This would suggest that the majority of these regions/loci affected by PWS-IC deletion outside of the imprinted domain are likely to be associated with functional components of the mouse genome. Furthermore, these results demonstrate that the PWS-IC has effects, direct and/or indirect, on DNA methylation that extend beyond the imprinted AS/PWS domain.
For both the pat and mat PWS-IC deletions, those regions/loci with altered DNA methylation relative to normal controls that fell within 15 kb of a known gene/transcript (and outside of the imprinted AS/PWS domain) were used for gene ontology (GO) analysis using Ingenuity Pathway Analysis (IPA) software. A core analysis was performed, reporting both direct and indirect pathway interactions, for those genes from both the paternally- and maternally-inherited PWS-IC deletions (pat deletion-specific, 8 genes; mat deletion-specific, 3 genes; 8 genes in common to both pat and mat deletion). These analyses revealed that a number of affected genes (7 of 19) are involved in important biological functions (Table 4). The top scoring biological functions reported by IPA were neurological disease, hereditary disorder, organ morphology, nervous system and development and function, embryonic development and developmental disorder, all pathways consistent with traits of Prader-Will and/or Angelman syndromes.
Table 4.
Pathway analysis of genes with altered DNA methylation from the paternally- and maternally-inherited PWS-IC deletion
| Biological Functions | Gene Symbols | |||||
|---|---|---|---|---|---|---|
| Neurological Disease | Casq2 | Camk2b | Gpr83 | Itpr1 | Pde6h | Socs5 |
| Hereditary Disorder | Casq2 | Gpr83 | Itpr1 | Pde6h | Socs5 | |
| Organ Morphology | Casq2 | Arcn1 | Socs5 | |||
| Nervous System Development and Function | Itpr1 | Camk2b | ||||
| Embryonic Development | Itpr1 | Socs5 | ||||
| Developmental Disorder | Casq2 | |||||
Top biological functions of genes, outside of the imprinted AS/PWS domain, with altered DNA methylation in the paternally and maternally inherited PWS-IC deletions. Only those genes from Tables 2 and 3 with CpG sites showing DNA methylation changes that fall within 15 kb of the gene body were chosen for gene ontology analysis. Underlined genes are those that are specific to the paternally inherited deletion; Pde6h is specific to the maternally inherited deletion; Itpr1 is common to both. Pathway analysis was performed using Ingenuity Pathway Analysis (IPA) software.
Discussion
We have used RRBS to examine the effect of the PWS-IC on DNA methylation patterns across the genome of the brain in newborn mice. We identified changes in the DNA methylation landscape upon deletion of the murine PWS-IC on either the maternally- or paternally-inherited chromosome. Within the imprinted AS/PWS domain, only methylation of differentially methylated CpG islands from paternally-expressed genes and their flanking CGI shores are affected significantly by pat PWS-IC deletion. However, as suggested by analysis of the Magel2 CGI shore (Fig. 2C), pat deletion of the PWS-IC may not affect methylation of the entire region defined as a shore, with methylation of the region of the shore distal to the CpG island unaffected by PWS-IC deletion. Methylation of CpG sites outside of DMRs associated with paternally-expressed genes is largely unaffected by pat PWS-IC deletion. Methylation of CpG sites across the entire AS/PWS domain appears to be essentially unaltered by mat PWS-IC deletion. However, Wu et al. have reported that a 4.8 kb maternal PWS-IC deletion in mice yielded changes in DNA methylation in the DMRs of the Ndn and Mkrn3 genes in brains from 1 day old mice.27 This discrepancy with our results may be due to the 4.8 kb PWS-IC deletion used by Wu et al. compared to the 35 kb PWS-IC deletion used in this study; the 4.8 kb deletion does not delete all of the DNase I hypersensitive sites associated with the PWS-IC28 and likely retains some PWS-IC functions. Nonetheless, our overall RRBS results for methylation patterns within the AS/PWS domain are highly consistent with existing studies of the effect of PWS-IC deletion on methylation in the AS/PWS domain.3,10,12-15 Thus, these data strongly validate our RRBS methodology and BISSCA software.
Our RRBS data set also allowed us to examine potential effects of PWS-IC deletion on methylation at loci outside of the imprinted AS/PWS domain. Using stringent criteria, including a requirement that at least 2 CpG sites within a 250 bp interval show coordinate changes in methylation of at least 25%, we identified 45 CpG sites and 16 corresponding loci outside of the AS/PWS domain showing changes in methylation in response to mat and/or pat PWS-IC deletion. Of these loci that are associated with a known gene, none are associated with a known imprinted gene. To our knowledge, these are the first data that suggest the PWS-IC may have effects (either direct or indirect) on DNA methylation outside of the imprinted AS/PWS domain. However, these are likely to be only a subset of loci whose methylation is affected by the PWS-IC because RRBS interrogates only a subset of CpG sites within the genome. Also, it is likely that additional methylation changes occur at other CpG sites and loci that do not meet the rigorous criteria we have employed to identify changes in DNA methylation. For example, reducing the stringency of our analysis to a q-value of ≤0.05 (and maintaining all of our other standard criteria) yielded 21 additional CpG sites (and 10 additional corresponding loci) with altered methylation upon pat PWS-IC deletion.
We considered the possibility that loci exhibiting altered DNA methylation might be closely associated with 129Sv-specific polymorphisms, despite extensive backcrossing of mice carrying the PWS-IC deletions to C57Bl/6. Our analysis showed that none of the 26 loci showing changes in methylation in response to either mat or pat PWS-IC deletion were within 5 kb of a 129Sv-specific SNP, suggesting that altered DNA methylation at these loci was unlikely to be associated with strain-specific SNPs. In addition, we considered the possibility that the sex of the animals carrying the PWS-IC deletion could have an effect on our results since we did not select animals for analysis with regard to their gender. However, the clinical phenotype of PWS is not different in affected males and females carrying similar molecular alterations (Daniel J. Driscoll, personal communication) so it is unlikely that the sex of the animals we used for analysis would have a significant effect on our results. Nonetheless, we cannot eliminate the possibility that the sex of the animals we used for RRBS could have had a small effect on our results. Also, it should be noted that our RRBS analyses were performed on pools of relatively small sample sizes (n ≤4) and that greater variation in our data could appear as larger numbers of individual animals are assayed.
The 17 loci showing methylation changes in response to pat PWS-IC deletion (using our most stringent standard criteria) could conceivably be a direct result of loss of the PWS-IC, for instance, by loci which interact with the PWS-IC and require physical proximity to the PWS-IC for normal establishment and/or stable maintenance of DNA methylation. Alternatively, methylation changes at a subset of these loci could be secondary to loss of expression of one or more paternally expressed genes that occurs upon pat PWS-IC deletion (e.g., Necdin, Magel2, Mkrn3, Snord116, etc.) and may identify some of the downstream loci affected by the loss of expression of these paternally-expressed genes within the AS/PWS domain. However, it is currently unclear what these loci showing altered methylation in response to pat PWS-IC deletion contribute to the PWS phenotype. The changes in methylation detected at 19 loci upon mat PWS-IC deletion was surprising since animals carrying mat PWS-IC deletions are typically viable and fertile and not thought to be significantly affected by loss of the PWS-IC on the maternal chromosome. However, the phenotype and long-term consequences of deleting just the PWS-IC on the maternal chromosome (in contrast to a deletion of the entire maternal AS/PWS domain) have not been carefully investigated so it may be possible that mice carrying only a mat PWS-IC deletion may have a heretofore undetected phenotype, as suggested by our results. Additionally, extensive characterization of humans carrying just a mat PWS-IC deletion has not been reported, likely due in large part to the small number of identified individuals. Also unexpected is the finding that a large subset of loci exhibiting changes in methylation outside of the AS/PWS domain (10 of 26 loci) show essentially the same changes irrespective of whether the PWS-IC deletion occurred on the maternal or paternal chromosome. Because the phenotypes resulting from pat or mat PWS-IC deletion are so different in both humans and mice, the expectation would be that DNA methylation changes outside of the AS/PWS domain resulting from mat or pat PWS-IC deletion also would be significantly different and non-overlapping. In addition, the deletion mice analyzed are hemizygous for the PWS-IC, indicating both PWS-IC alleles are required for normal methylation levels at those 10 loci which show a change in methylation upon either pat or mat PWS-IC deletion (Itpr1, Bcat1, Otud7a, Lrrk1, Adpgk, Gm525, Mettl21d, Tmem121, Efcab6, Fam160b1). The functional significance of our finding of substantial overlapping methylation changes outside of the AS/PWS domain upon mat and pat PWS-IC deletion is unclear. It is also interesting that the Lrrk1 gene shows methylation changes in exon 28 upon both pat and mat PWS-IC deletion, as well as methylation changes in intron 21 upon mat PWS-IC deletion only.
To investigate the possibility that some of the methylation changes we detected outside of the AS/PWS domain may be due to indirect effects of PWS-IC deletion, we compared our 26 loci of altered methylation with published studies of gene expression changes due to loss of one or more paternally expressed genes within the AS/PWS domain. Powell et al.29 recently characterized changes in gene expression that result from paternal deletion of the murine Snord116 locus, a cluster of snoRNAs encoded within the large Snrpn-Ube3a-ats transcript that is strongly linked to the PWS phenotype.30,31 Gene expression profiling by RNA-seq was performed on cortical RNA of dissected adult brains from mice carrying a paternal Snord116 deletion 30 and wild-type controls. Comparing our 26 loci with the 6,467 genes that exhibited significant changes in gene expression upon paternal Snord116 deletion (compared to wild type controls), we found 10 genes/loci in common: 4 loci with altered methylation upon pat PWS-IC deletion (Arcn1, Gpr83, Socs5, Dgki), 5 loci with altered methylation upon either pat or mat PWS-IC deletion (Mettl21d, Fam160b1, Bcat1, Itpr1, Otud7a), and 1 with mat PWS-IC deletion (Zfp704). Those 9 loci whose methylation changed with pat PWS-IC deletion (Arcn1, Gpr83, Socs5, Dgki, Mettl21d, Fam160b1, Bcat1, Itpr1, Otud7a) are candidates for indirect/downstream targets of Snord116 deletion. The functional significance of the correlation between paternal Snord116 deletion and altered methylation at the Zfp704 locus upon mat PWS-IC deletion, as well as functional implications of the correlation between changes in gene expression upon Snord116 deletion and changes in methylation with both mat and pat PWS-IC deletion (e.g., Arcn1, Gpr83, Socs5, Dgki, Mettl21d, Fam160b1, Bcat1, Itpr1, Otud7a), are unclear. Powell et al. also performed chromatin isolation by RNA purification (ChIRP) analysis on the 116HG long non-coding RNA (lncRNA) which is also encoded within the Snord116 locus and whose expression is also abolished by pat PWS-IC deletion.29 The ChIRP assay detects genomic DNA sequences that interact with the 116HG lncRNA. Comparison of our data with the list of genes detected by ChIRP analysis of the HG116 lncRNA (2403 genes) yielded 2 loci in common, Dgki whose DNA methylation was altered by pat PWS-IC deletion, and Zfp704 whose methylation was altered by mat PWS-IC deletion. This is further evidence that changes in DNA methylation at some loci may be a downstream effect of loss of Snord116 expression; the significance of the interaction between the HG116 lncRNA with the Zfp704 locus for DNA methylation is uncertain because changes in DNA methylation at the Zfp704 locus only occurs with mat PWS-IC deletion where expression of the HG116 RNA is presumably unaltered.
In an earlier study, Bittel et al.32 performed microarray analysis of genome-wide gene expression changes in newborn mouse brain in response to pat PWS-IC deletion. In contrast to the results from Snord116 deletion, of the 69 genes exhibiting a significant change in gene expression (≥1.5-fold change) detected by Bittel et al., none corresponded to the 26 loci associated with changes in DNA methylation which we detected in this study. The discrepancy in the results of the comparison between our DNA methylation data with the results of Powell et al. and Bittel et al. may be the stringency of the criteria used by Powell et al. versus Bittel et al. to identify genes that show changes in expression upon Snord116 deletion (6467 genes) and PWS-IC deletion (69 genes), respectively.
4C analysis of PWS-IC interactions across the imprinted AS/PWS domain and adjacent regions in human neurons identified 2 interactions that flank the cholinergic receptor nicotinic α 7 (Chrna7) gene.22 Chrna7 is non-imprinted and located outside of the AS/PWS domain ∼700 kb upstream of Frat3 in mice. Inspection of our RRBS data indicated our analysis interrogated 38 CpG sites associated with Chrna7; no changes in methylation levels at any of these sites was detected upon either mat or pat PWS-IC deletion, indicating the physical interactions of the PWS-IC flanking Chrna7 are not governing DNA methylation at the locus. Interestingly, the gene flanking Chrna7 is Otud7a (∼200 kb from Chrna7) at which our RRBS analysis identifies 12 CpG sites with altered DNA methylation upon either mat or pat PWS-IC deletion (Tables 2 and 3, Fig. 4).
Two of the loci showing altered methylation are associated with genes of notable interest for the AS/PWS domain. The calcium-calmodulin-dependent kinase II (CaMKII) is widely expressed in the brain and consists of 2 subunits, αCaM- KII and βCaMKII.33 We detected DNA methylation changes in the βCaMKII gene as a result of pat PWS-IC deletion, while altered regulation of αCaM- KII has been associated with Angelman syndrome.34,35 However, there are no obvious functional connections between pat PWS-IC deletion, βCaMKII, and Angelman syndrome, though the association is intriguing. The G protein-coupled receptor 83 (Gpr83) is broadly expressed in the brain and regulates systemic energy metabolism 36; our study detected altered methylation at multiple CpG sites ∼14 kb from Gpr83 upon pat PWS-IC deletion. Multiple loci in the AS/PWS domain also appear to be associated with regulation of energy metabolism. The 116HG lncRNA described by Powell et al.29 appears to regulate diurnal energy expenditure, and paternal Snord116 deletion alters Gpr83 expression. In addition, regulatory regions of multiple paternally-expressed genes across the AS/PWS (including the PWS-IC) are bound by nuclear respiratory factors 1 and 2 (NRF-1, 2; 28,37), transcription factors commonly associated with genes involved in respiration.38 The altered methylation and expression of Gpr83 upon pat PWS-IC deletion and Snord116 deletion, respectively, suggest aberrant Gpr83 regulation may contribute to altered energy metabolism in PWS.
The recent finding that the TET family of proteins converts 5-methylcytosine (5-mC) in DNA to 5-hydroxymethylcytosine (5-hmC), which can then be further converted to 5-formylcytosine (5-fC) and 5-carboxycytosine (5-cC),39 makes interpreting changes in DNA methylation complex. Because sodium bisulfite-based methods for assaying DNA methylation do not distinguish between 5-mC and 5-hmC, it is inherently unclear using these methods whether changes in methylation are due to changes in levels of 5-mC and/or 5-hmC. Distinguishing between changes in 5-mC versus 5-hmC is likely to be significant, as indicated by the recent finding that 5-hmC is enriched and 5-mC is depleted in active genes of neuronal cells.40
Materials and Methods
Animals
Whole brain tissue was obtained from mice carrying a previously described 35 kb PWS-IC deletion on either the paternally- or maternally-inherited chromosome.14,18 Both of these PWS-IC deletion strains have been backcrossed to C57Bl/6 mice for >20 generations. Whole brain tissue from normal newborn littermates was used as controls. All mice were maintained on a 14/10 dark/light cycle and fed breeder chow (Purina 5058, 9% fat) ad libitum. Newborn pups were sacrificed the morning of birth and whole brain tissue was dissected and flash frozen in liquid nitrogen.
Genomic DNA extraction
DNA was purified from frozen tissue using standard methods 41 with modifications. Briefly, thawed tissues were transferred to a 15 ml conical tube to which 3 ml of DNA extraction buffer with proteinase K (50 mM Tris-HCl pH 8.5; 25 mM EDTA pH 8.0; 150 mM NaCl; 300 mg/ml proteinase K; 0.5% SDS) were added. Samples were rotated overnight at room temperature. Samples were then extracted sequentially using equal volumes of phenol: chloroform: isoamyl alcohol (25:24:1, vol/ vol/ vol), followed by chloroform. Extracts were then treated with RNase (20 U/ml) (Ambion; AM2286), followed by an additional round of sequential organic extractions. DNA was precipitated by addition of NaCl to a final concentration of 300 mM and 2.5 volumes of 100% ethanol (EtOH). After mixing, genomic DNA was spooled out to a new 1.5 ml conical followed by centrifugation at 16,000 x g to pellet DNA. Pellet was then washed with 1 ml 70% EtOH, centrifuged again and allowed to air dry. Final ethanol-precipitated DNA was resuspended in 1 ml of TE (10 mM Tris-HCl, 1 mM EDTA, pH 8.0). For wild-type control samples, 2 separate RRBS libraries were constructed, each with pooled equimolar amounts of DNA from 2 animals from different litters; a total of 2 male and 2 female control animals were used. DNA sequencing data from both control libraries were then combined for analyses. For the maternal PWS-IC deletion, a single RRBS library was constructed from an equimolar pool of DNA from a single male and single female animal. For the paternal PWS-IC deletion, an RRBS library was constructed from a single female animal. For sodium bisulfite genomic sequencing, genomic DNA was purified from 2 female control animals, 2 male animals carrying the maternal PWS-IC deletion, and 2 male animals carrying the paternal PWS-IC deletion.
RRBS library construction and sequencing
RRBS libraries were generated following a protocol described by Gu et al.,20 with minor modifications. Briefly, 300 ng of genomic DNA was digested with MspI (NEB; R0106S) at 37°C for 2 hours and purified by standard phenol:chloroform:isoamylalcohol extraction and ethanol precipitation. End repair and A-tailing of MspI-digested genomic DNA was performed, followed by organic extractions and DNA precipitation. Ligation was then performed in a reaction containing 0.75 μM methylated adapters (Integrated DNA Technologies), followed by organic extractions and precipitation. Redissolved DNA samples were fractionated on a 3% Nusieve 3:1 Agarose (Lonza; 50091) 0.5X TBE (45 mM Tris-borate, 1 mM EDTA) gel and fragments between 160–340 bp in size (equivalent to 40–220 bp without adapters) were excised, followed by purification of excised DNA fragments with Qiagen's MinElute Gel Extraction Kit (Qiagen; 28604) according to manufacturer's protocol. Eluted size-selected DNA was subjected to 2 consecutive rounds of sodium bisulfite chemical conversions using a MethylCode Bisulfite Conversion Kit (Invitrogen; MECOV50) following the manufacturer's protocol. PCR amplification then was performed according to the protocol described by Gu et al.20 then purified using AMPure XP-PCR Purification magnetic beads (Agencourt, A63880) following the manufacturer's protocol. The resulting library was examined using a Bioanalyzer high-sensitivity gel to determine the proper size distribution of fragments. To determine the concentration of the library, samples were first assayed using a High-Sensitivity Quant-It assay (Invitrogen; Q-33120) on a Qubit (Invitrogen; Q32866) fluorometer to determine appropriate quantity for real-time quantitative PCR. Final library concentration was determined using quantitative PCR with Kappa Biosystems Library Quantification Kit (Kappa Biosystems; KK4824) following the manufacturer's recommended protocol. Library sequencing was performed on an Illumina Genome AnalyzerIIx following the manufacturer's protocol. Cluster generation was performed using the cBot platform with libraries seeded at 7pM for each lane. Sequencing was performed for 40 cycles.
Sequence alignment and data analysis
After sequencing, qseq files were converted to fastq format, with phred 33 quality score encoding, by CASAVA 1.9. Poor quality sequence reads were filtered out using Trim Galore! (Babraham Bioinformatics) and Cutadapt.42 Reads were trimmed or filtered to ensure only reads with an average quality score of 20 or more and a sequence read length of at least 20 bases were maintained. Illumina adaptor sequences were also trimmed from the 3′ end of reads. Additionally, sequences which were adaptor-trimmed had another 2 bases removed from the 3′ end to avoid including the filled-in cytosine base from the 3′ MspI-cut site. Sequence alignment and analyzes were performed using a custom-designed and -written software package termed BISSCA (Bisulfite Sequencing Comparative Analysis; A. Riva et al., manuscript in preparation), designed specifically to analyze bisulfite sequencing data. In silico size-selection of the repeat-masked mouse reference genome (NCBI37/mm9) and bisulfite conversion (C→T) of both sequence reads and reference genome (positive and negative strands) were performed followed by alignment of sequence reads to the reference genome. BISSCA utilizes the short-read aligner Bowtie to perform the alignment step.43 Alignment was performed using the -n option allowing up to 2 mismatches in the seed with –best reporting option specified. Additionally, the –norc option was utilized, as a separate reference file is used for both the forward and reverse strands of the reference genome. An output file was generated in a sorted SAM format for downstream analysis. After alignment, the conversion rate of each cytosine in the aligned reads was determined by the ratio of C→T conversion (C/(C+T)). The cytosine conversion rate of each cytosine component of a CpG dinucleotide was used to determine the methylation status of each CpG site. Cytosine conversion rates of cytosines that were not part of a CpG dinucleotide were used to determine the bisulfite conversion efficiency. Any reads with more than 1 unconverted C that was not part of a CpG were discarded. All statistical analyzes were performed using MethylKit,44 a library package for the statistical language and environment R. Briefly, samples were filtered to only include CpG sites that have a user-specified read depth and are present in all samples analyzed. To calculate differentially methylated sites between samples, a Fisher's exact test was employed. To correct for the problem of multiple hypothesis testing, the sliding linear model (SLIM) method was used to correct calculated p-values to q-values.45
Methylation levels of CpG sites outside of the AS/PWS domain were deemed to be significantly altered by PWS-IC deletion if all of the following conditions were met: 1) a sequencing read depth of ≥30 in both the control and PWS-IC deletion samples; 2) a DNA methylation change (increase or decrease) of at least an absolute magnitude of 25% (e.g., 5% methylation vs. 30% methylation) upon PWS-IC deletion; 3) a q-value of 0.01 or less; and 4) at least 2 CpG sites within a 250 bp interval showing a similar change in methylation upon PWS-IC deletion.
Locus-specific sodium bisulfite genomic sequencing
High resolution sodium bisulfite genomic sequencing was performed essentially as described by Clark et al.46 Genomic DNA was chemically converted using the MethylCode Bisulfite Conversion Kit (Invitrogen; MECOV-50) following the manufacturer's protocol. Briefly; 500 ng of genomic DNA was diluted to a final volume of 20 μl and converted by sample incubation with 130 μl of CT conversion reagent under the following conditions: 98°C for 10 min, 64°C for 2.5 hours, 4°C for up to 20 hours. After conversion, DNA was desalted and desulphonated as directed; DNA was eluted in 25 μl TE. PCR reactions were performed under the following conditions: 2 μl purified converted DNA, 1X PCR Buffer (Qiagen; 203205), 1 mM of each primer; 200 mM dNTPs and 0.125 units of HotStarTaqTM Polymerase (Qiagen; 203205) in a 25 ml reaction volume. Thermocycler conditions were as follows: 95°C for 15 minutes; 45 cycles of 94°C for 45 seconds, primer specific annealing temperature for 30 seconds, 7°C for 90 seconds; 72°C for 10 minutes and held at 4°C after completion. PCR primers were designed to amplify the upper strand of bisulfite-converted target sequences using MethylPrimer Express Software (Applied Biosystems). Oligonucleotide primer sequences are listed in Supplementary Table 4.
Data availability
Raw sequence data can be accessed through the NCBI Short Read Archive under the following study number: SRP038725
Supplementary Material
Disclosure of Potential Conflicts of Interest
No potential conflicts of interest were disclosed.
Acknowledgments
We thank Rolf Renne and Jianhong Hu for assistance with Illumina DNA sequencing, Joseph Kuhl, and Melissa Alberts for assistance with sodium bisulfite genomic sequencing assays, and Daniel Driscoll and Russell Darst for helpful discussions.
Funding
This work was supported by NIH grant R01 HD057026 to TPY and NIH grant R01 NS086456 to JLR.
References
- 1. Barlow DP. Genomic imprinting: a mammalian epigenetic discovery model. Ann Rev Genet 2011; 45:379-403; PMID:21942369; http://dx.doi.org/ 10.1146/annurev-genet-110410-132459 [DOI] [PubMed] [Google Scholar]
- 2. Buiting K. Prader-Willi syndrome and Angelman syndrome. Am J Med Genet Part C, Sem Med Genet 2010; 154C:365-76; PMID:20803659; http://dx.doi.org/ 10.1002/ajmg.c.30273 [DOI] [PubMed] [Google Scholar]
- 3. Horsthemke B, Wagstaff J. Mechanisms of imprinting of the Prader-WilliAngelman region. Am J Med Genet Part A 2008; 146A:2041-52; PMID:18627066; http://dx.doi.org/ 10.1002/ajmg.a.32364 [DOI] [PubMed] [Google Scholar]
- 4. Herzing LB, Kim SJ, Cook EH, Jr, Ledbetter DH. The human aminophospholipid-transporting ATPase gene ATP10C maps adjacent to UBE3A and exhibits similar imprinted expression. Am J Hum Genet 2001; 68:1501-5; PMID:11353404; http://dx.doi.org/ 10.1086/320616 [DOI] [PMC free article] [PubMed] [Google Scholar]
- 5. Horsthemke B, Buiting K. Imprinting defects on human chromosome 15. Cytogen Genome Res 2006; 113:292-9; PMID:16575192; http://dx.doi.org/ 10.1159/000090844 [DOI] [PubMed] [Google Scholar]
- 6. Sharp AJ, Migliavacca E, Dupre Y, Stathaki E, Sailani MR, Baumer A, Schinzel A, Mackay DJ, Robinson DO, Cobellis G, et al. Methylation profiling in individuals with uniparental disomy identifies novel differentially methylated regions on chromosome 15. Genome Res 2010; 20:1271-8; PMID:20631049; http://dx.doi.org/ 10.1101/gr.108597.110 [DOI] [PMC free article] [PubMed] [Google Scholar]
- 7. Chai JH, Locke DP, Ohta T, Greally JM, Nicholls RD. Retrotransposed genes such as Frat3 in the mouse Chromosome 7C Prader-Willi syndrome region acquire the imprinted status of their insertion site. Mamm Genome: Off J Int Mamm Genome Soc 2001; 12:813-21; PMID:11845283; http://dx.doi.org/ 10.1007/s00335-001-2083-1 [DOI] [PubMed] [Google Scholar]
- 8. Dittrich B, Robinson WP, Knoblauch H, Buiting K, Schmidt K, Gillessen-Kaesbach G, Horsthemke B. Molecular diagnosis of the Prader-Willi and Angelman syndromes by detection of parent-of-origin specific DNA methylation in 15q11-13. Hum Genet 1992; 90:313-5; PMID:1487250; http://dx.doi.org/ 10.1007/BF00220089 [DOI] [PubMed] [Google Scholar]
- 9. Brannan CI, Bartolomei MS. Mechanisms of genomic imprinting. Curr Opin Genet Dev 1999; 9:164-70; PMID:10322141; http://dx.doi.org/ 10.1016/S0959-437X(99)80025-2 [DOI] [PubMed] [Google Scholar]
- 10. Dubose AJ, Smith EY, Yang TP, Johnstone KA, Resnick JL. A new deletion refines the boundaries of the murine Prader-Willi syndrome imprinting center. Hum Mol Genet 2011; PMID:21659337; 20:3461-6; http://dx.doi.org/ 10.1093/hmg/ddr262 [DOI] [PMC free article] [PubMed] [Google Scholar]
- 11. Smith EY, Futtner CR, Chamberlain SJ, Johnstone KA, Resnick JL. Transcription is required to establish maternal imprinting at the Prader-Willi syndrome and Angelman syndrome locus. PLoS Genet 2011; 7:e1002422; PMID:22242001; http://dx.doi.org/ 10.1371/journal.pgen.1002422 [DOI] [PMC free article] [PubMed] [Google Scholar]
- 12. Rabinovitz S, Kaufman Y, Ludwig G, Razin A, Shemer R. Mechanisms of activation of the paternally expressed genes by the Prader-Willi imprinting center in the Prader-WilliAngelman syndromes domains. Proc Natl Acad Sci U S A 2012; 109:7403-8; PMID:22529396; http://dx.doi.org/ 10.1073/pnas.1116661109 [DOI] [PMC free article] [PubMed] [Google Scholar]
- 13. El-Maarri O, Buiting K, Peery EG, Kroisel PM, Balaban B, Wagner K, Urman B, Heyd J, Lich C, Brannan CI, et al. Maternal methylation imprints on human chromosome 15 are established during or after fertilization. Nat Genet 2001; 27:341-4; PMID:11242121; http://dx.doi.org/ 10.1038/85927 [DOI] [PubMed] [Google Scholar]
- 14. Bielinska B, Blaydes SM, Buiting K, Yang T, Krajewska-Walasek M, Horsthemke B, Brannan CI. De novo deletions of SNRPN exon 1 in early human and mouse embryos result in a paternal to maternal imprint switch. Nat Genet 2000; 25:74-8; PMID:10802660; http://dx.doi.org/ 10.1038/75629 [DOI] [PubMed] [Google Scholar]
- 15. Bressler J, Tsai TF, Wu MY, Tsai SF, Ramirez MA, Armstrong D, Beaudet AL. The SNRPN promoter is not required for genomic imprinting of the Prader-WilliAngelman domain in mice. Nat Genet 2001; 28:232-40; PMID:11431693; http://dx.doi.org/ 10.1038/90067 [DOI] [PubMed] [Google Scholar]
- 16. Nicholls RD, Knepper JL. Genome organization, function, and imprinting in Prader-Willi and Angelman syndromes. Annu Rev Genomics Hum Genet 2001; 2:153-75; PMID:11701647; http://dx.doi.org/ 10.1146/annurev.genom.2.1.153 [DOI] [PubMed] [Google Scholar]
- 17. Bervini S, Herzog H. Mouse models of Prader-Willi Syndrome: a systematic review. Front Neuroendocrinol 2013; 34:107-19; PMID:23391702; http://dx.doi.org/ 10.1016/j.yfrne.2013.01.002 [DOI] [PubMed] [Google Scholar]
- 18. Yang T, Adamson TE, Resnick JL, Leff S, Wevrick R, Francke U, Jenkins NA, Copeland NG, Brannan CI. A mouse model for Prader-Willi syndrome imprinting-centre mutations. Nat Genet 1998; 19:25-31; PMID:9590284; http://dx.doi.org/ 10.1038/ng0598-25 [DOI] [PubMed] [Google Scholar]
- 19. Irizarry RA, Ladd-Acosta C, Wen B, Wu Z, Montano C, Onyango P, Cui H, Gabo K, Rongione M, Webster M, et al. The human colon cancer methylome shows similar hypo- and hypermethylation at conserved tissue-specific CpG island shores. Nat Genet 2009; 41:178-86; PMID:19151715; http://dx.doi.org/ 10.1038/ng.298 [DOI] [PMC free article] [PubMed] [Google Scholar]
- 20. Gu H, Smith ZD, Bock C, Boyle P, Gnirke A, Meissner A. Preparation of reduced representation bisulfite sequencing libraries for genome-scale DNA methylation profiling. Nat Protoc 2011; 6:468-81; PMID:21412275; http://dx.doi.org/ 10.1038/nprot.2010.190 [DOI] [PubMed] [Google Scholar]
- 21. Meissner A, Gnirke A, Bell GW, Ramsahoye B, Lander ES, Jaenisch R. Reduced representation bisulfite sequencing for comparative high-resolution DNA methylation analysis. Nucleic Acids Res 2005; 33:5868-77; PMID:16224102; http://dx.doi.org/ 10.1093/nar/gki901 [DOI] [PMC free article] [PubMed] [Google Scholar]
- 22. Yasui DH, Scoles HA, Horike S, Meguro-Horike M, Dunaway KW, Schroeder DI, Lasalle JM. 15q11.2-13.3 chromatin analysis reveals epigenetic regulation of CHRNA7 with deficiencies in Rett and autism brain. Hum Mol Genet 2011; 20:4311-23; PMID:21840925; http://dx.doi.org/ 10.1093/hmg/ddr357 [DOI] [PMC free article] [PubMed] [Google Scholar]
- 23. Sandoval J, Heyn H, Moran S, Serra-Musach J, Pujana MA, Bibikova M, Esteller M. Validation of a DNA methylation microarray for 450,000 CpG sites in the human genome. Epigenetics: Off J DNA Methylation Soc 2011; 6:692-702; PMID:21593595; http://dx.doi.org/ 10.4161/epi.6.6.16196 [DOI] [PubMed] [Google Scholar]
- 24. Lossie AC, Whitney MM, Amidon D, Dong HJ, Chen P, Theriaque D, Hutson A, Nicholls RD, Zori RT, Williams CA, et al. Distinct phenotypes distinguish the molecular classes of Angelman syndrome. J Med Genet 2001; 38:834-45; PMID:11748306; http://dx.doi.org/ 10.1136/jmg.38.12.834 [DOI] [PMC free article] [PubMed] [Google Scholar]
- 25. John S, Sabo PJ, Thurman RE, Sung MH, Biddie SC, Johnson TA, Hager GL, Stamatoyannopoulos JA. Chromatin accessibility pre-determines glucocorticoid receptor binding patterns. Nat Genet 2011; 43:264-8; PMID:21258342; http://dx.doi.org/ 10.1038/ng.759 [DOI] [PMC free article] [PubMed] [Google Scholar]
- 26. Clark SJ, Harrison J, Paul CL, Frommer M. High sensitivity mapping of methylated cytosines. Nucleic Acids Res 1994; 22:2990-7; PMID:8065911; http://dx.doi.org/ 10.1093/nar/22.15.2990 [DOI] [PMC free article] [PubMed] [Google Scholar]
- 27. Wu MY, Jiang M, Zhai X, Beaudet AL, Wu RC. An unexpected function of the prader-willi syndrome imprinting center in maternal imprinting in mice. PloS One 2012; 7:e34348; PMID:22496793; http://dx.doi.org/ 10.1371/journal.pone.0034348 [DOI] [PMC free article] [PubMed] [Google Scholar]
- 28. Rodriguez-Jato S, Shan J, Khadake J, Heggestad AD, Ma X, Johnstone KA, Resnick JL, Yang TP. Regulatory elements associated with paternally-expressed genes in the imprinted murine AngelmanPrader-Willi syndrome domain. PloS One 2013; 8:e52390; PMID:23390487; http://dx.doi.org/ 10.1371/journal.pone.0052390 [DOI] [PMC free article] [PubMed] [Google Scholar]
- 29. Powell WT, Coulson RL, Crary FK, Wong SS, Ach RA, Tsang P, Alice Yamada N, Yasui DH, Lasalle JM. A Prader-Willi locus lncRNA cloud modulates diurnal genes and energy expenditure. Hum Mol Genet 2013; 22:4318-28; PMID:23771028; http://dx.doi.org/ 10.1093/hmg/ddt281 [DOI] [PMC free article] [PubMed] [Google Scholar]
- 30. Ding F, Li HH, Zhang S, Solomon NM, Camper SA, Cohen P, Francke U. SnoRNA Snord116 (Pwcr1MBII-85) deletion causes growth deficiency and hyperphagia in mice. PloS One 2008; 3:e1709; PMID:18320030; http://dx.doi.org/ 10.1371/journal.pone.0001709 [DOI] [PMC free article] [PubMed] [Google Scholar]
- 31. Sahoo T, del Gaudio D, German JR, Shinawi M, Peters SU, Person RE, Garnica A, Cheung SW, Beaudet AL. Prader-Willi phenotype caused by paternal deficiency for the HBII-85 CD box small nucleolar RNA cluster. Nat Genet 2008; 40:719-21; PMID:18500341; http://dx.doi.org/ 10.1038/ng.158 [DOI] [PMC free article] [PubMed] [Google Scholar]
- 32. Bittel DC, Kibiryeva N, McNulty SG, Driscoll DJ, Butler MG, White RA. Whole genome microarray analysis of gene expression in an imprinting center deletion mouse model of Prader-Willi syndrome. Am J Med Genet Part A 2007; 143:422-9; PMID:17036336; http://dx.doi.org/ 10.1002/ajmg.a.31504 [DOI] [PMC free article] [PubMed] [Google Scholar]
- 33. Elgersma Y, Fedorov NB, Ikonen S, Choi ES, Elgersma M, Carvalho OM, Giese KP, Silva AJ. Inhibitory autophosphorylation of CaMKII controls PSD association, plasticity, and learning. Neuron 2002; 36:493-505; PMID:12408851; http://dx.doi.org/ 10.1016/S0896-6273(02)01007-3 [DOI] [PubMed] [Google Scholar]
- 34. Steinkellner T, Yang JW, Montgomery TR, Chen WQ, Winkler MT, Sucic S, Lubec G, Freissmuth M, Elgersma Y, Sitte HH, et al. Ca(2+)calmodulin-dependent protein kinase IIalpha (alphaCaMKII) controls the activity of the dopamine transporter: implications for Angelman syndrome. J Biol Chem 2012; 287:29627-35; PMID:22778257; http://dx.doi.org/ 10.1074/jbc.M112.367219 [DOI] [PMC free article] [PubMed] [Google Scholar]
- 35. Weeber EJ, Jiang YH, Elgersma Y, Varga AW, Carrasquillo Y, Brown SE, Christian JM, Mirnikjoo B, Silva A, Beaudet AL, et al. Derangements of hippocampal calciumcalmodulin-dependent protein kinase II in a mouse model for Angelman mental retardation syndrome. J Neurosci 2003; 23:2634-44; PMID:12684449 [DOI] [PMC free article] [PubMed] [Google Scholar]
- 36. Muller TD, Muller A, Yi CX, Habegger KM, Meyer CW, Gaylinn BD, Finan B, Heppner K, Trivedi C, Bielohuby M, et al. The orphan receptor Gpr83 regulates systemic energy metabolism via ghrelin-dependent and ghrelin-independent mechanisms. Nat Commun 2013; 4:1968; PMID:23744028; http://dx.doi.org/ 10.1038/ncomms2968 [DOI] [PMC free article] [PubMed] [Google Scholar]
- 37. Rodriguez-Jato S, Nicholls RD, Driscoll DJ, Yang TP. Characterization of cis- and trans-acting elements in the imprinted human SNURF-SNRPN locus. Nucleic Acids Res 2005; 33:4740-53; PMID:16116039; http://dx.doi.org/ 10.1093/nar/gki786 [DOI] [PMC free article] [PubMed] [Google Scholar]
- 38. Scarpulla RC. Nuclear control of respiratory chain expression by nuclear respiratory factors and PGC-1-related coactivator. Ann N Y Acad Sci 2008; 1147:321-34; PMID: 19076454; http://dx.doi.org/ 10.1196/annals.1427.006 [DOI] [PMC free article] [PubMed] [Google Scholar]
- 39. Wu H, Zhang Y. Reversing DNA methylation: mechanisms, genomics, and biological functions. Cell 2014; 156:45-68; PMID:24439369; http://dx.doi.org/ 10.1016/j.cell.2013.12.019 [DOI] [PMC free article] [PubMed] [Google Scholar]
- 40. Mellen M, Ayata P, Dewell S, Kriaucionis S, Heintz N. MeCP2 binds to 5hmC enriched within active genes and accessible chromatin in the nervous system. Cell 2012; 151:1417-30; PMID:23260135; http://dx.doi.org/ 10.1016/j.cell.2012.11.022 [DOI] [PMC free article] [PubMed] [Google Scholar]
- 41. Strauss WM. Preparation of genomic DNA from mammalian tissue. edited by Coligan John E, et al. Current Protocols in Immunology 2001; Chapter 10:Unit 10 2 [DOI] [PubMed] [Google Scholar]
- 42. Martin M. Cutadapt removes adapter sequences from high-throughput sequencing reads. EMBnetjournal 2011; 17:10-2 [Google Scholar]
- 43. Langmead B, Trapnell C, Pop M, Salzberg SL. Ultrafast and memory-efficient alignment of short DNA sequences to the human genome. Genome Biol 2009; 10:R25; PMID:19261174; http://dx.doi.org/ 10.1186/gb-2009-10-3-r25 [DOI] [PMC free article] [PubMed] [Google Scholar]
- 44. Akalin A, Kormaksson M, Li S, Garrett-Bakelman FE, Figueroa ME, Melnick A, Mason CE. methylKit: a comprehensive R package for the analysis of genome-wide DNA methylation profiles. Genome Biol 2012; 13:R87; PMID:23034086; http://dx.doi.org/ 10.1186/gb-2012-13-10-r87 [DOI] [PMC free article] [PubMed] [Google Scholar]
- 45. Storey JD, Tibshirani R. Statistical significance for genomewide studies. Proc Natl Acad Sci U S A 2003; 100:9440-5; PMID:12883005; http://dx.doi.org/ 10.1073/pnas.1530509100 [DOI] [PMC free article] [PubMed] [Google Scholar]
- 46. Clark SJaF M. Bisulphite genomic sequencing of methylated cytosines. In: Taylor GR, ed. Laboratory Methods for the Detection of Mutations and Polymorphisms in DNA. Boca Raton, New York, London, Tokyo: CRC Press, 1997:151-61. [Google Scholar]
- 47. Doi A, Park IH, Wen B, Murakami P, Aryee MJ, Irizarry R, Herb B, Ladd-Acosta C, Rho J, Loewer S, et al. Differential methylation of tissue- and cancer-specific CpG island shores distinguishes human induced pluripotent stem cells, embryonic stem cells and fibroblasts. Nat Genet 2009; 41:1350-3; PMID:19881528; http://dx.doi.org/ 10.1038/ng.471 [DOI] [PMC free article] [PubMed] [Google Scholar]
Associated Data
This section collects any data citations, data availability statements, or supplementary materials included in this article.
Supplementary Materials
Data Availability Statement
Raw sequence data can be accessed through the NCBI Short Read Archive under the following study number: SRP038725