
Figure 3.
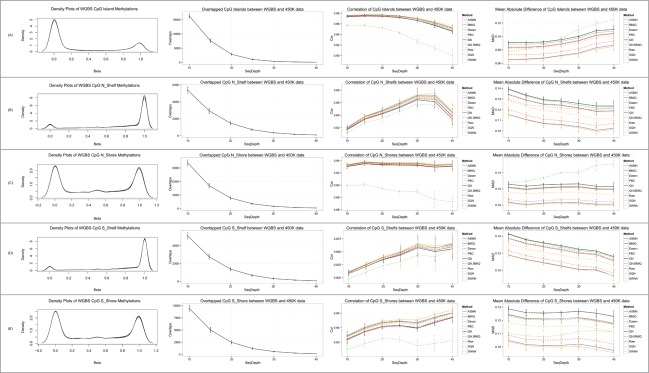
Comparison of different normalization methods for 450K data using WGBS data on a CpG regional level. β distributions, numbers of overlapped CpGs, mean correlations, and mean absolute differences between WGBS and 450K data, for CpG Island (A), N_Shelf (B), N_Shore (C), S_Shelf (D), and S_Shore (E) regions.