
Figure 5.
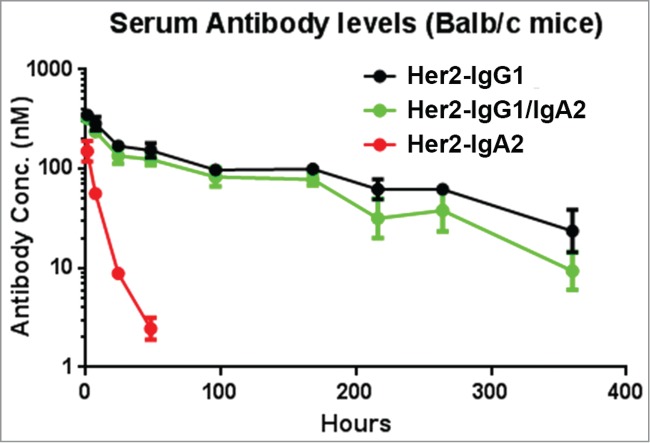
Pharmacokinetic profiles of mAb variants in BALB/c mice. Serum levels for Her2-IgG1 (black), Her2-IgG1/IgA2 (green), and Her2-IgA2 (red) in BALB/c mice were quantified by ELISA detecting human Fab. Mice were injected with a single IV bolus dose of 2.5 mg/kg. Each data point represents the average serum concentration of the mAb in 4 mice for up to 14 days. Error bars represent standard deviation. The data was fit to a 2 compartment model for the calculation of pharmacokinetic parameters (Table 3).