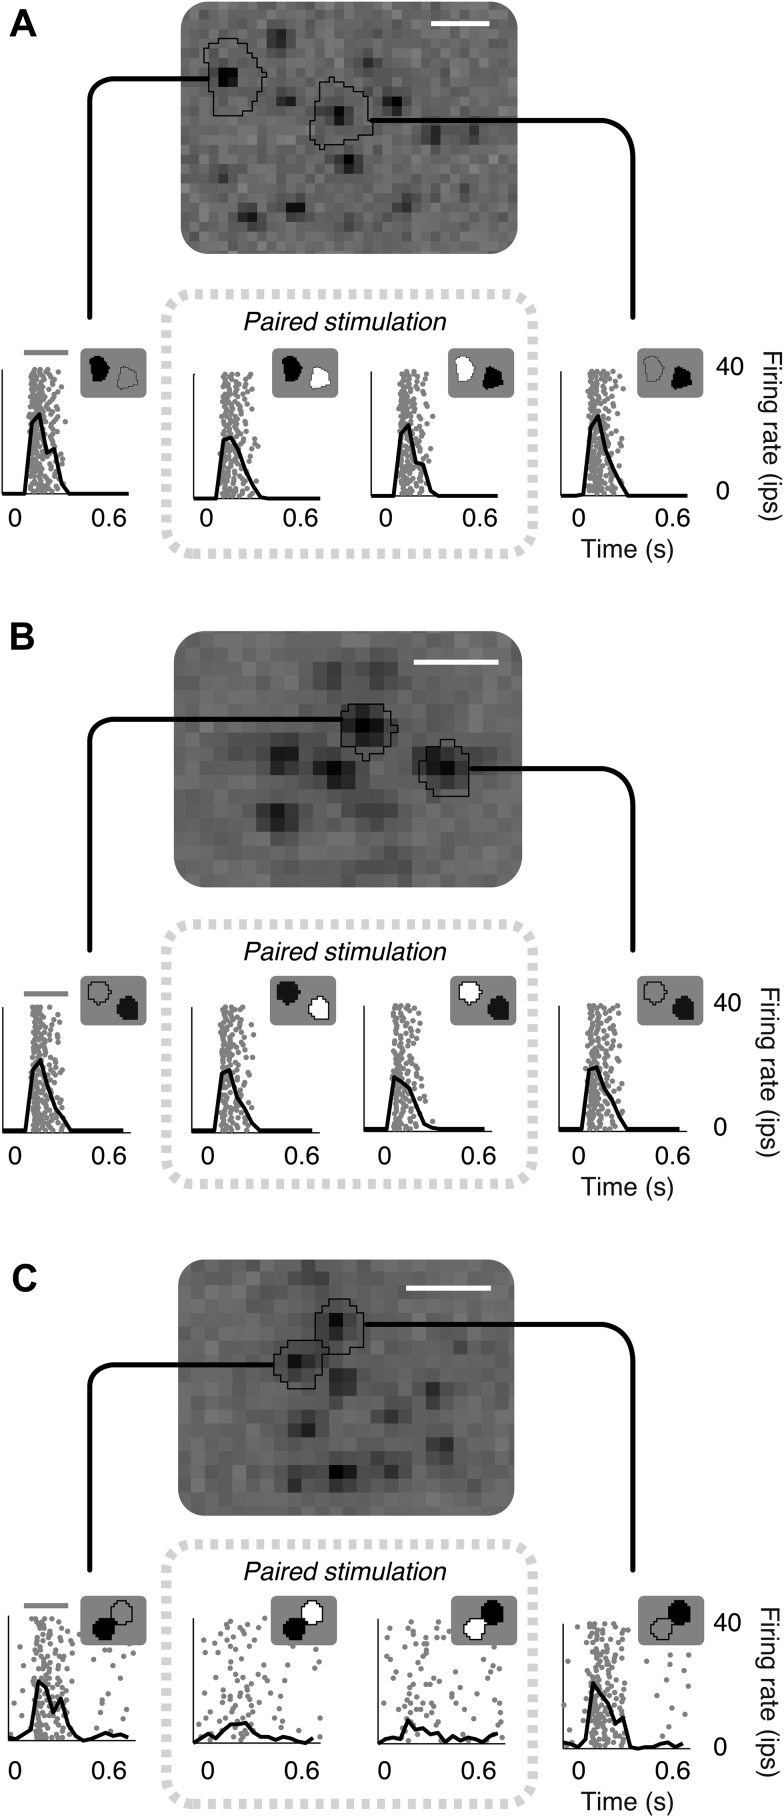
Figure 1. Failure of linear integration in OFF midget retinal ganglion cells (RGCs).
(A) Above, spatial spike-triggered average derived from white-noise analysis with high-resolution pixel stimulation. Black lines indicate regions of pixels independently stimulating individual cones (identified online). White line, scale bar (8.4 microns). Below, rasters of responses to repeated brief presentations of uniform luminance within each cone region. Each row is a trial, each point is a spike. Black line, average firing rate across trials. Gray line, stimulus presentation (250 ms). Stimulation in cone regions was either paired increments and decrements of light, or decrements alone, as shown in insets. (B) Another RGC showing failure of cancellation. (C) A RGC exhibiting cancellation.

