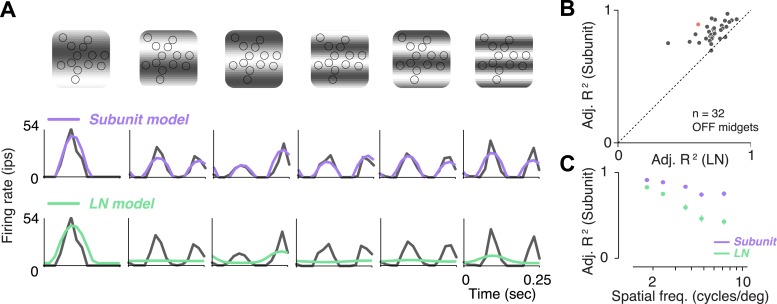
Figure 5. Responses to gratings.
(A) Sinusoidal gratings temporally modulated in contrast were presented to OFF midget RGCs. Top: grating stimuli superimposed on the cone locations of a single RGC, for a set of example combinations of spatial frequency and phase (with spatial frequency increasing from left to right). Bottom: cycle-averaged firing rate of the RGC (black); predictions of the LN model (green); predictions of the subunit model (purple). Both models were fit to independent data from white-noise stimulation. (B) Performance (adjusted R2, see ‘Materials and methods’) for subunit and LN models, across 32 OFF midget RGCs from a single retina. Data point in red corresponds to example shown in panel A. (C) Adjusted R2, computed separately for the two models for different spatial frequencies, averaged across RGCs. Error bars indicate s.e.m. across RGCs.

