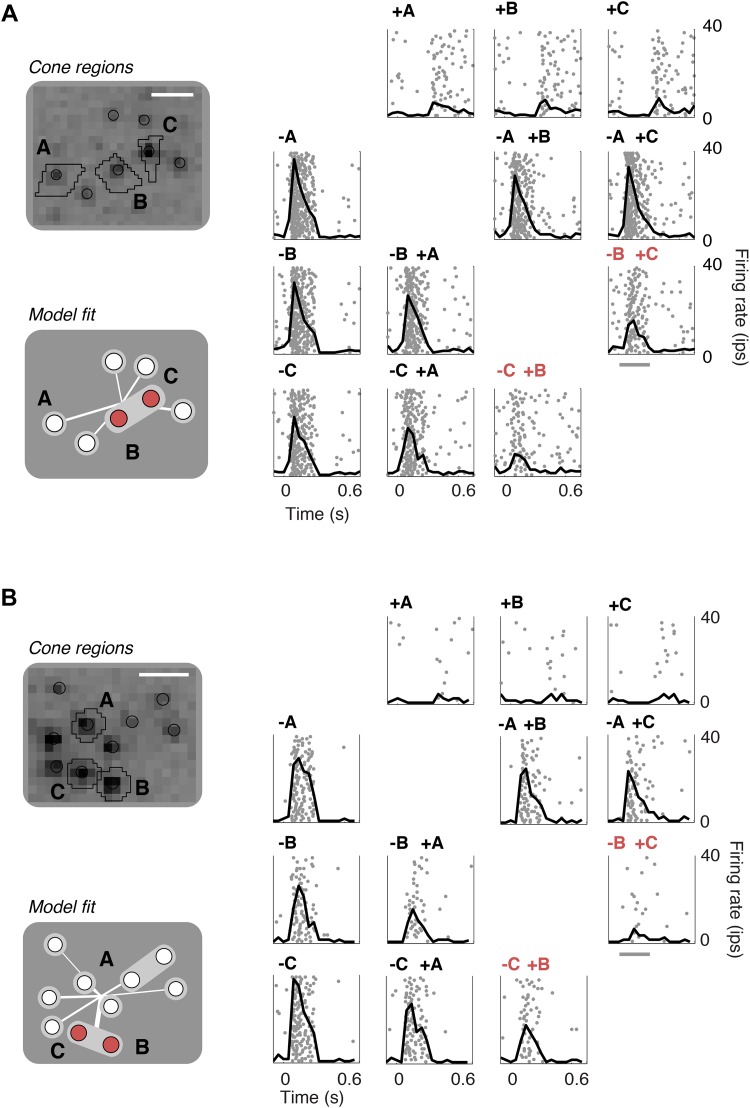
Figure 7. Closed-loop validation of subunit organization.
(A) Upper left, spatial spike-triggered average and cone stimulation regions, as in Figure 1. Lower left, diagram of fitted subunit model, as in Figure 3A. The three cones (A, B, C) were stimulated with increments (+) or decrements (−) of light. Panels on the right show the responses (as in Figure 1) of a single OFF midget RGC to different combinations of light increments and decrements. Top row, and left column, show responses to stimulation of single cones. Remaining panels show responses to paired stimulation. Red indicates the pair of cones found by the model to belong to a single subunit, and thus selected for paired stimulation. Gray line, stimulus presentation (250 ms). (B) Another example, plotted as in panel A.

