Abstract
As a classical analogue of electromagnetically induced transparency, plasmon induced transparency (PIT) has attracted great attention by mitigating otherwise cumbersome experimental implementation constraints. Here, through theoretical design, simulation and experimental validation, we present a novel approach to achieve and control PIT by hybridizing two double split ring resonators (DSRRs) on flexible polyimide substrates. In the design, the large rings in the DSRRs are stationary and mirror images of each other, while the small SRRs rotate about their center axes. Counter-directional rotation (twisting) of the small SRRs is shown to lead to resonance shifts, while co-directional rotation results in splitting of the lower frequency resonance and emergence of a PIT window. We develop an equivalent circuit model and introduce a mutual inductance parameter M whose sign is shown to characterize the existence or absence of PIT response from the structure. This model attempts to provide a quantitative measure of the physical mechanisms underlying the observed PIT phenomenon. As such, our findings can support the design of several applications such as optical buffers, delay lines, and ultra-sensitive sensors.
Metamaterials are well-known for their unusual optical responses such as negative refractive index, super-resolution imaging, and highly asymmetric and non-reciprocal behaviors that are impossible to elicit from naturally-occurring materials1,2,3,4. In addition to these unique characteristics, they can also emulate some of the renowned atomic and condensed matter phenomena such as electromagnetically induced transparency (EIT), Fano resonances, and orbital hybridization5,6,7. The former is indeed of significant importance owing to its exclusive feature of slow light which promises various applications in developing ultra-accurate sensors, low-power optical switches, optical buffers, and delay lines8,9,10,11,12,13,14. EIT is essentially a quantum destructive interference phenomenon which appears in a three level atomic system where a high-power pump beam induces a narrowband “dark” state to open a transparency window inside the broader absorption band of a “bright” state excited by a probe beam15,16. EIT has been observed in various media including cold atoms, warm atoms, and plasmas; however, cumbersome experimental conditions have often hampered its practical implementation17,18,19,20,21,22. The imitation of EIT by using metamaterials becomes significant where metamaterials can tremendously relax those experimental constraints. Since the first demonstration of EIT in metamaterials, called plasmon induced transparency (PIT), several metamaterial structures have been developed to achieve broadband, multiband, actively controllable, and polarization insensitive PIT from visible to microwave parts of the spectrum7,23,24,25,26,27,28,29,30,31,32,33. Most of those PIT structures leverage meta-atoms (i.e. building blocks of metamaterials) such as cut wires and/or split ring resonators (SRRs) as the analogues of bright or dark states when they either directly couple to the incident radiation (bright state) or are excited via induction from the bright meta-atom (dark state).
On the other hand, the interaction or hybridization of meta-atoms, when placed in a close proximity of one another34,35,36,37,38, tends to lead to the emergence of new resonant states from the splitting of degenerate modes. This can be easily achieved using SRRs and double split ring resonators (DSRRs) under various geometrical configurations in which coupling of both magnetic and electric moments can occur39,40,41,42,43,44,45,46,47,48,49. However, there are few reports of PIT through hybridization of SRRs, and the physical mechanisms underlying the interaction and emergence of PIT has not been studied previously.
In this work, we report the theoretical design and simulation, as well as experimental validation of a novel approach to specifically achieve and manipulate PIT by hybridizing two concentric-twisted DSRRs on flexible polyimide substrates. We further propose an equivalent circuit model to gain deeper understanding of the physics underlying the hybridization interaction, and therefore the occurrence or absence of PIT through hybridization, which we find to be quantitatively characterized by a mutual inductance parameter M and more specifically its sign. Finally, we experimentally determine a group delay of about 7 ps and relative group velocity of 0.06 associated with the proposed PIT structures, in good agreement with simulation results.
Results
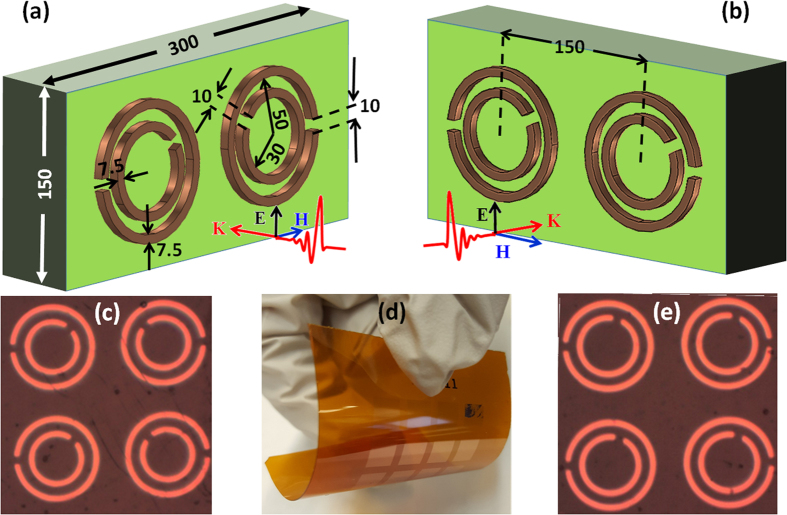
Figure 1a,b represent schematic illustrations of the DSRR array unit cells studied in this work, which consist of hybridized counter-directional and co-directional twisted DSRRs, respectively (all dimensions in micrometer). Magnified optical microscope images of the correspondingly fabricated structures can be seen in Fig. 1c,e. The arrays were realized on flexible polyimide films as shown in Fig. 1d. As illustrated in the figures, the outer or large SRRs are fixed and mirror images of each other. In counter-directional structures (Fig. 1a) the inner or small SRRs rotate synchronously (symmetrically) to each other in opposite directions, while in co-directional structures (Fig. 1b) the small SRRs rotate synchronously in the same direction. We employed standard photolithography to realize 200 nm thick Cu SRR arrays deposited on a flexible 125 μm thick Kapton polyimide film substrate. The fabricated samples were characterized using terahertz time domain spectroscopic (THz-TDS) method in transmission mode. The THz radiation illuminates the arrays at normal incidence with the wave polarization oriented along the gap of the large SRRs in order to directly excite them as bright resonators at their fundamental frequency (see methods). The design and simulation of the spectral response of the structures was carried out using finite element numerical method (FEM), with periodic conditions (PBC) for all side boundaries perpendicular to the plane of the SRRs and perfectly matched layers (PML) for the front and back faces parallel to the plane of the SRRs. In the simulations, we used a conductivity of 6×10⁷ (S/m) for the Cu of the SRRs and a permittivity of 3.15 for the polyimide. For transmission measurements, we divided the transmission through the samples by that of a bare 125 μm Kapton polyimide substrate, which was used as a reference. For phase measurements and determination of the group delay and relative group velocity, we performed an air scan as the reference (see methods).
Figure 1. Schematic and optical microscope image illustrations of hybrid concentric twisted DSRRs.
Schematic illustrations of counter-directional (a) and co-directional (b) structures. Optical microscope images of a fabricated sample of counter-directional (c) and co-directional (e) twisted DSRRs. An image of samples fabricated on a flexible 125 μm Kapton polyimide film (d).
Figure 2 shows both measured (solid lines) and simulated (dashed lines) transmission spectra of counter-directional twisted DSRRs when the small SRRs in each DSRR are progressively rotated from −90˚ to 90˚ in opposite directions such that the gap in the small SRRs moves continuously far away from the gap in the large SRRs. An illustration of the unit cell is shown in the inset of its associated spectrum. As shown in Fig. 2, these counter-directional structures exhibit two distinct resonances: one at a lower frequency which stems from large SRRs and one at higher resonance frequency which primarily arises from the small SRRs. However, these resonances are not independent of each other: because of the interaction between the small and large SRRs within each DSRR, any physical change to one influences the resonance response of the other. In the present case, a small perturbation is achieved when rotating the small SRRs equally but in opposite directions as shown in Fig. 2, while the large SRRs remain stationary, in such a manner that the two DSRRs remain mirrors of each other at any rotation angle. When rotating the small SRRs from −90˚ to 90˚, the lower resonance (fres.1) is red shifted while the higher resonance (fres.2) experiences a blue shift. The resonance strength at the lower frequency remains fairly unchanged, but that at the higher frequency reduces gradually by rotation in the course of rotation from −90˚ to 90˚, and in the special case of −45˚ case the higher resonance completely disappears.
Figure 2. Transmission spectra of counter-directional DSRRs.
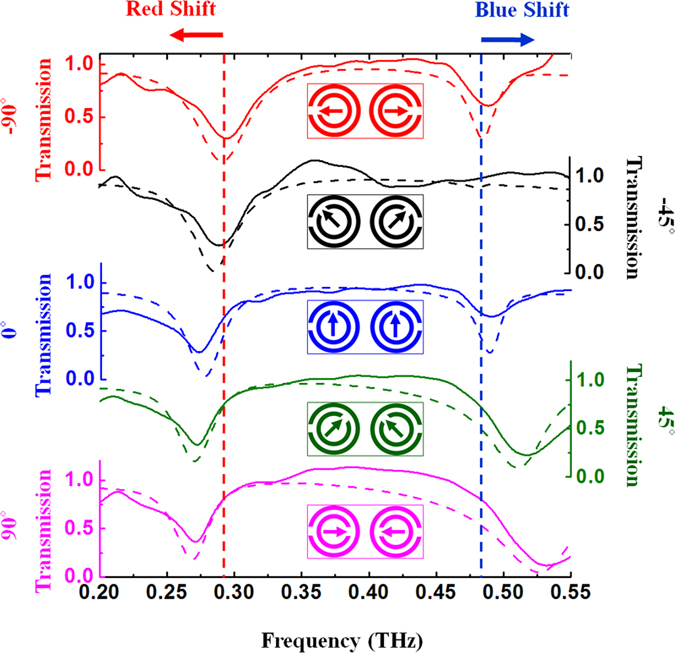
Insets show the front view of the couther-directional twisted DSRRs. By rotating from −90° to 90°, the first resonance (lower frequency) bears a red-shift and the second resonance (higher frequency) experiences a blue-shift.
Furthermore, additional simulations have confirmed that using only one such DSRR (either one) instead of two in a unit cell does not change the resulting spectra in Fig. 2 (see supplementary material), which is essentially equivalent to changing one of the DSRRs in the unit cell with its mirror image with respect to a vertical plane since that would mean both DSRRs are the same.
The red and blue shifts in the resonance near fRes.1 of these counter-directional twisted DSRRs, with a fairly constant strength, are most interesting because they can be used to easily achieve PIT phenomenon in the following manner. Let us start by considering the 0˚ case as a reference structure (blue plot in Fig. 2), a rotation of the small SRRs in one direction (e.g. negative or toward −45˚ shown in Fig. 2) or the opposite direction (e.g. positive or toward +45˚ in Fig. 2) will cause the resonance near fRes.1 to shift to a slightly higher or lower frequency than the reference resonance, respectively. Consequently, a hybrid structure that contains both a “positive” and “negative” twisted DSRRs in the unit cell would exhibit two resonances slightly shifted from each other, which is essentially equivalent to a splitting of the original resonance and thus the potential emergence of a PIT transmission window. More precisely, since we saw previously that the spectral responses in Fig. 2 are unchanged when using only one of the 2 counter-directional twisted DSRRs, the desired hybrid structure exhibiting PIT can be realized with only two DSRRs instead of four: a negatively twisted DSRR such as the right one in the −45˚ inset in Fig. 2 (black), and a positively twisted DSRR such as the left one in the +45° inset in Fig. 2 (green). In other words, this configuration corresponds exactly to the case of co-directional twisting of small SRRs in the unit cell, as illustrated in Fig. 1b,e. This means that the co-directional twisting of the small SRR in these DSRR arrays can lead to a PIT window as a result of opposite shifts in the transmission resonance whereas the counter-directional twisting of the small SRRs only leads to a frequency shift in a single direction.
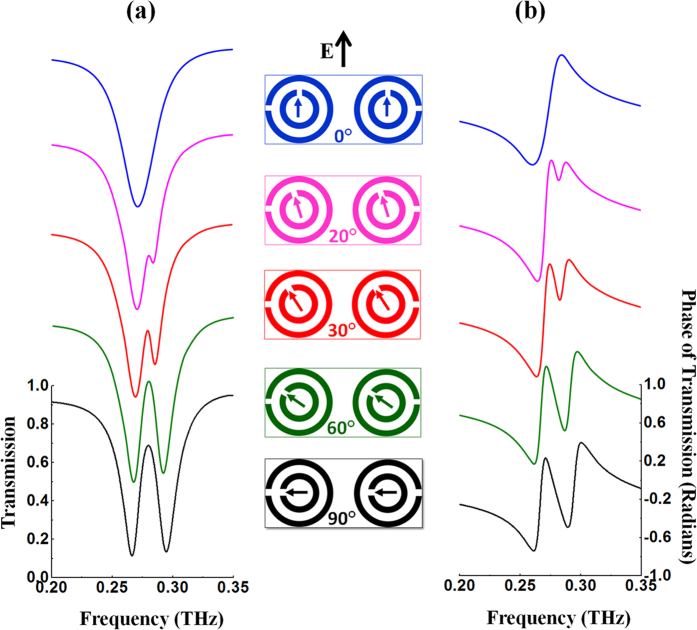
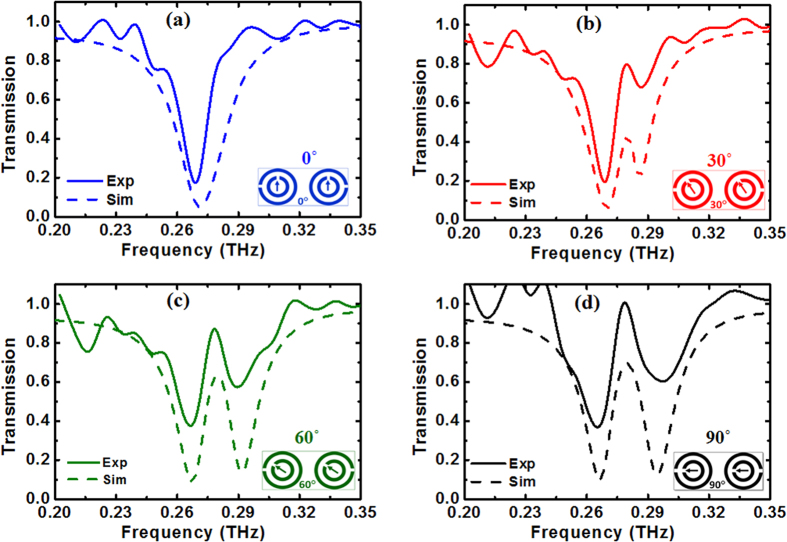
The effect of the rotation of the small SRRs on the opening of the PIT window in these co-directional twisted DSRRs is illustrated in Fig. 3 which shows the simulated transmission (Fig. 3a) and phase (Fig. 3b) spectra for rotation angles from 0° to 90°. At 90°, a PIT window can be clearly observed at ~0.280 THz. A comparison of the experimentally measured and simulated transmission spectra is depicted in Fig. 4 and a fairly good agreement is achieved.
Figure 3. Simulated transmission and phase spectra of hybridized co-directional twisted DSRRs.
Simulated transmission (a) and phase (b) spectra of hybrid co-directional twisted DSRRs when the small SRRs rotate synchronously in the same direction around their axes to achieve PIT. The middle column shows front view illustrations of the corresponding structures.
Figure 4. Comparison between simulated and experimental transmission spectra for co-directional twisted DSRRs.
(a–d) transmission spectra for 0°, 30°, 60°, and 90° rotations of the small SRRs, respectively.
The group delay and relative group velocity associated with the 90° co-directional twisted DSRRs that exhibit PIT are represented in Fig. 5. The solid and dashed black lines correspond to the values from experimentally measured and simulated transmission spectra, respectively. The solid red lines correspond to the group delay and relative group velocity of the polyimide reference. The group delay τg introduced by the metamaterial structure was calculated using
Figure 5. Comparison of simulated and experimental group delay and relative group velocity.
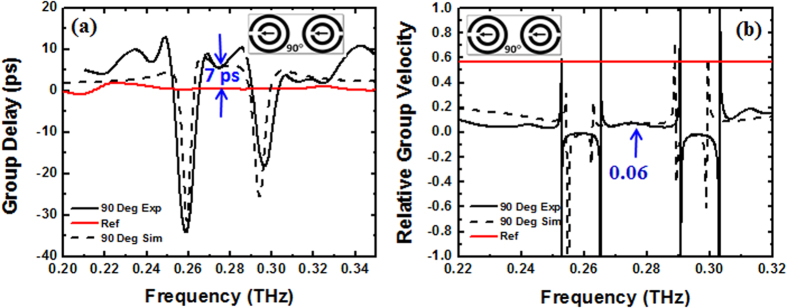
(a) Group delay and (b) relative group velocity (Vg/c) associated with 90° co-directional twisted DSRRs that exhibit PIT at ~0.280 THz. Solid and dashed black lines represent experimentally measured and simulated results, respectively. The red lines are group delay and relative group velocity of the reference polyimide.
 |
where φ and ω are the phase and angular frequency, respectively. To determine the phase φ of the transmission from the simulation spectra, we subtracted the phase of the incident wave, traveling in the air between the input port and surface of the structure, from the phase between the input and output ports. In doing so, only the desired phase difference between the front surface of the structure and the output port which is positioned 125 μm behind the DSRRs is obtained (see methods). However from the experimentally measured spectra, the phase of air scan (as the reference) was first subtracted from the measured phase of the sample, therefore an additional phase delay of air with a thickness of 125 μm (corresponding approximately to the thickness of the sample) was manually added to the subtraction (see methods). The relative group velocity Vg of the wave in the structure was subsequently obtained using
 |
where c, ng, and L are the speed of light in vacuum, group index, and thickness of the metamaterial structure considered to be 125 μm.
From Fig. 5 we observe that at frequencies away from the resonances, the group delay and relative group velocity of THz radiation tends to be equal to that of polyimide, as expected. At the resonance frequencies of 0.265 THz and 0.295 THz the metamaterial demonstrates negative group delay and velocity. At around 0.280 THz where there exists a ~70% PIT transmission, the THz radiation experiences a delay of around 7 ps, while the group velocity of the THz wave reduces to nearly 0.06 times the speed of light in the vacuum.
Discussion
The observation of PIT in the 90° co-directional twisted DSRR structure of Fig. 4d can be interpreted by further examining the resonances of each constituent DSRR as well as their interactions, with the aid of our FEM analysis. Figure 6e compares the transmission spectrum of the PIT structure (solid black line) superimposed with that of its two constituent DSRRs (pink and red lines, respectively). The electric field strength distribution in the structure is shown in Fig. 6a,b at the two resonance frequencies of 0.265 THz and 0.295 THz, respectively, along with their associated current densities in Fig. 6c,d. It is clearly observable that the two minima in the transmission spectrum of the PIT structure stem from the resonances associated with each of the constituent DSRRs. Although they are relatively broad at 0.270 and 0.290 THz, both resonances become narrower and a transparency window appears at 0.280 THz due to interaction between the two DSRRs after hybridization. Interestingly as a result, unlike conventional EIT phenomena where bright and dark states with a large difference in resonance bandwidths are required, the PIT demonstrated here is eventually created by coupling two bright states with comparable bandwidths.
Figure 6. Comparison of transmission spectra between 90° co-directional PIT structure and its constituent DSRRs, electric field and current density distributions at transmission resonance frequencies.
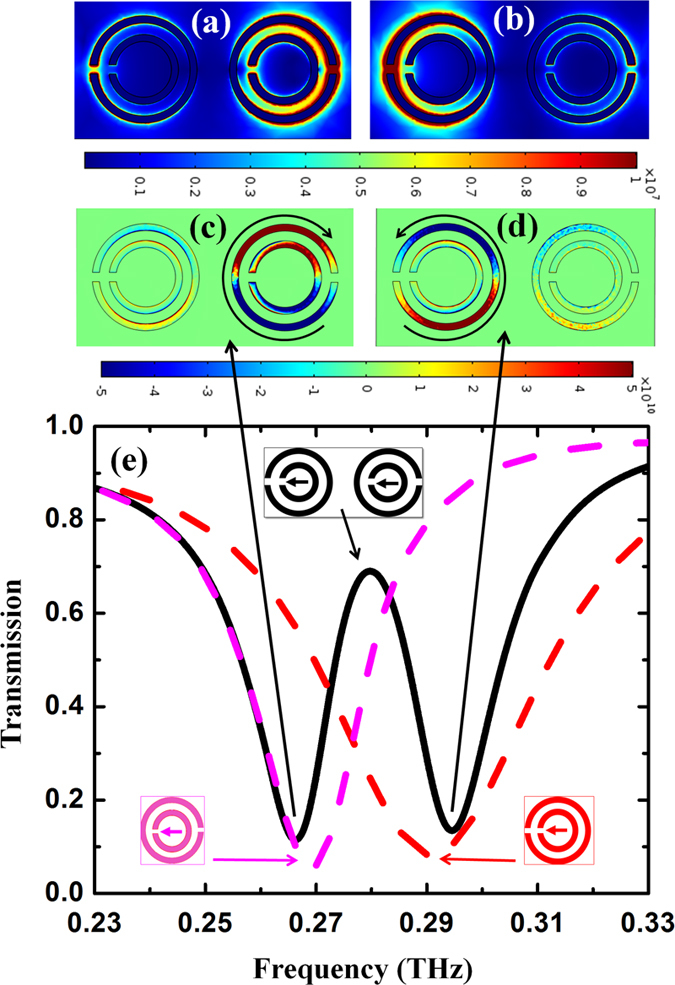
(a) Comparison of transmission spectra between 90°-co-directional PIT structure and its constituent elements. (b,c) Electric field strength distribution within the 90°-co-directional PIT structure at the two transmission resonance frequencies at 0.265 and 0.295 THz. (d,e) Current density distribution in the 90°-co-directional PIT structure at the same two resonance frequencies.
By contrast to the hybridized counter-directional DSRRs, in the co-directional DSRRs interaction between the two constituent DSRRs is essential to the emergence of a PIT response. For example, if one of the DSRRs in the PIT structure is rotated by 180˚ about its axis (e.g. right DSRR), the two adjacent DSRRs will interact with each other in such a manner that the higher frequency resonance will dominate over the lower frequency one, leading to disappearance of the PIT transmission window as shown in the spectrum comparison in Fig. 7a,b.
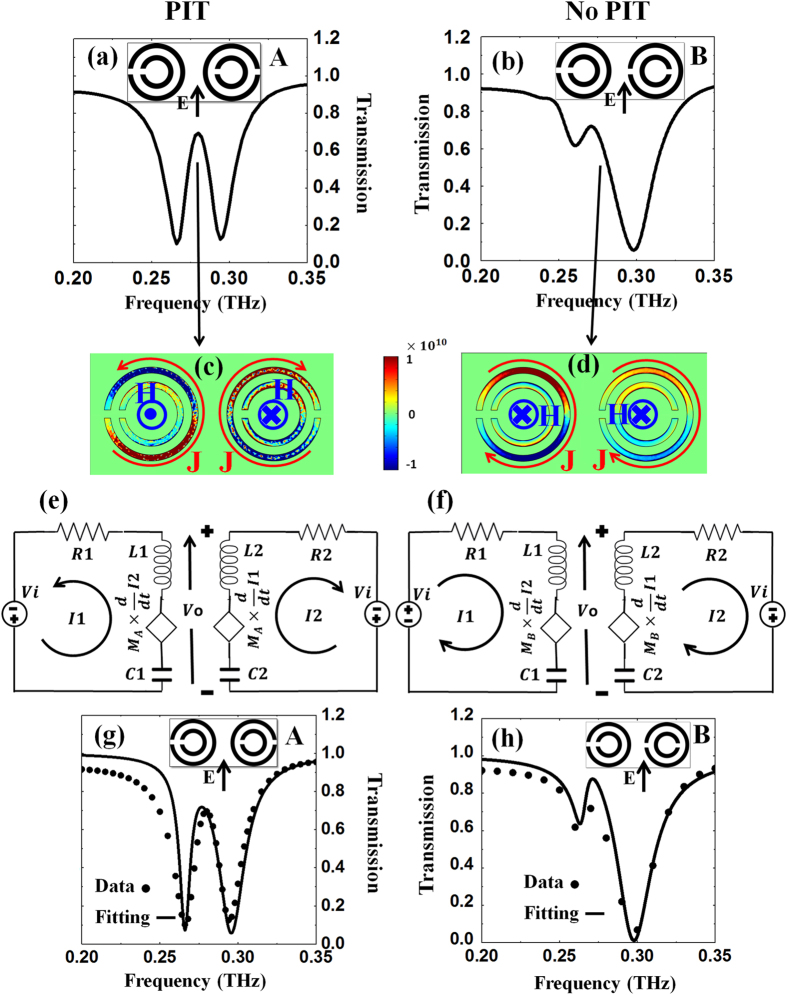
Figure 7. Transmission spectra, electric current at 0.280 THz, circuit model, and fitted spectra of structures A and B.
(a,b) are simulated transmission spectra of structure A and B. (c,d) are their associated current densities (x component) where red vectors, labeled J, and blue centrifugal and centripetal marks, labeled H, are used to show current and magnetic field direction of large SRRs. (e,f) Electric circuit models of structure A and B. (g,h) fitted transmission spectrum for structure A and B respectively where dots show the simulated data and solid lines are fitting result by the model.
For the rest of manuscript, we will call “structure A” the 90˚ co-directional PIT structure in Fig. 7a and “structure B” the other one in Fig. 7b. The current densities (x component) of structures A and B at 0.280 THz are illustrated in Fig. 7c,d, respectively. For clarity, we used red arrows and a label J, to show the current directions in the large SRRs, and blue into-plane (×) and out-of-plane (.) symbols for the induced magnetic fields. We clearly see that the electric currents generated in the two large SRRs of structure A are in opposite direction while they are in the same direction for structure B. Correspondingly, the generated magnetic fields inside the DSRRs are in opposite directions for structure A and in the same direction for structure B.
To gain a better understanding of the physics underlying these observations, we propose the equivalent circuit model for structures A and B, shown in Fig. 7e,f respectively. Each DSRR is modeled as a series RLC circuit with R as the resistance, C its capacitance, and L its self inductance. The resonance frequencies  of the left and right RLC circuits are set at 0.270 THz and 0.290 THz, which correspond to the resonances observed in Fig. 6 (red and pink lines). The coupling of an incident THz wave into the DSRRs is represented by a voltage source, Vi, with the same magnitude and phase in each circuit since the wave is arriving at normal incidence. To represent the mutual interaction between the two DSRRs, we introduce a the mutual inductance M such that an additional dependent voltage source equal to
  is added in the circuit, i.e. the voltage in one loop being proportional to the rate of change in the current inside the other loop. Since the DSRRs of structure A are exactly the same as structure B when considered individually, their circuit RLC models will be identical in both structures. However, due to the currents (or magnetic fields) being antiparallel in structure A and parallel in structure B (Fig. 7c,d), the interaction between the DSRRs in each unit cell will not be similar for the two structures and we expect the coupling parameter M to have different values (MA, MB) to characterize the dissimilar responses of A and B.
The equations governing this circuit models can be summarized as
 |
where M is either MA for structure A or MB for structure B, and ω is the angular frequency. Equa-tion (3) is used to extract the transfer function (VO/ Vi) of the circuit versus frequency. Fitting the square magnitude of transfer function to the simulated transmission spectra of structures A and B is shown in Fig. 7g,h respectively, and results in the values of the circuit elements and coupling parameters summarized in Table 1.
Table 1. Evaluated elements of circuit model resulted from fitting simulated transmission spectrum.
| Structure | C1 [fF] | C2 [fF] | L1 [pH] | L2 [pH] | M [pH] | R1 [Ω] | R2 [Ω] |
|---|---|---|---|---|---|---|---|
| A | 3.53 | 22.80 | 98.44 | 13.21 | 3.10 | 4.70 | 1.90 |
| B | 3.55 | 22.87 | 98.61 | 13.17 | −3.20 | 4.50 | 2.20 |
As anticipated, all circuit element parameters (R, L and C) have almost identical values for structures A and B. A remarkable difference is the value of M, which is found to be positive for structure A while it is negative for structure B but with nearly the same magnitude.
The near-equality of all parameters other than M confirms that the PIT and not-PIT responses of structures A and B originates solely from different coupling schemes of their constituent DSRRs. The opposite signs of M resembles an analogous behavior between two solenoids: like two solenoids with magnetic fluxes in opposite directions, structure A gives rise to a positive (attractive) coupling factor whereas, similar to two solenoids with magnetic fluxes in the same direction, structure B gives rise to a negative (repulsive) coupling factor. In other words, the mutual (due to M) and self induced (due to L) currents of each large SRR are in the same direction for structure A but in opposite directions for structure B. Thus, a positive mutual inductance MA between DSRRs in structure A will increase the total inductance (Li+MA) in each DSRR. As a result, since the bandwidth of the resonance in a series RLC circuit is equal to R/L, the bandwidth of the resonances from the DSRRs is expected to be reduced when coupled, which is consistent with what was observed in Fig. 6: both resonances became narrower, which gave rise to the opening of the PIT transmission window in between, at 0.280 THz. By contrast, a negative mutual inductance MB in structure B leads to the opposite effect: a reduction of the total inductance of both DSRRs, a broadening of their transmission resonance, and since the higher frequency resonance becomes dominant over the other one, the PIT window diminishes in structure B.
Methods
Numerical Simulation
In the design of the structures, we used Comsol Multiphysics FEM method to solve Maxwell equations. Figure 8 shows a schematic illustration of the structure under simulation with the details highlighted. We utilized PBC for all side boundaries perpendicular to the plane of the SRRs, and PML was applied for front and back boundaries which are parallel to the plane of the SRRs. The incident wave was launched at normal incidence with its polarization along the gap of large SRRs such that first order resonance was excited in the SRRs in all structures. Input and output ports were implemented to measure phase and transmission spectra by utilizing scattering parameters. The transmission T was calculated by using the scattering parameter S21 through:
Figure 8. Schematic illustration of simulation environment and conditions.
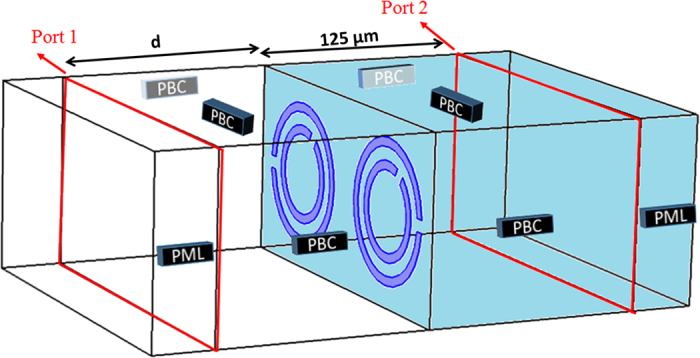
Blue area is polyimide and the white area contains air.
 |
To calculate the phase of transmission, we subtracted the phase of the incident wave inside the air between the input port and the surface of the structure from the phase between the two ports, so that only the desired phase difference between the front surface of the structure and the output port which is positioned 125 μm behind the SRRs is obtained:
 |
where φSim is the phase of transmission through the sample, φ21 is the phase difference between input and output ports, k0 is the wavenumber in vacuum, and d is the distance between port 1 (input port) and surface of the sample. The group delay was then calculated using Eq. (1) and subsequently the relative group velocity was evaluated using Eq. (2) where 125 μm was considered for the thickness of metamaterial (L).
Measurement
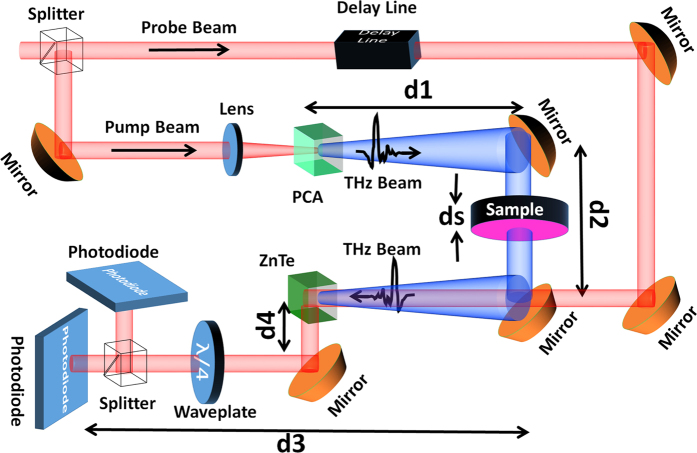
For experimental measurements, a THz-TDS system in transmission mode was used. Figure 9 shows a schematic illustration of the system. A 780 nm excitation laser beam with a repetition rate of 76 MHz is split into pump and probe beams. The pump beam excites a photoconductive antenna (PCA) to generate linearly polarized THz wave. For detection, an electro-optical sampling method is applied such that both transmitted THz wave through the sample and the 780 nm probe beam meet each other at a birefringent ZnTe crystal by controlling the timing between them through a delay stage. The THz wave induces different refractive indices along two orthogonal optical axes in the crystal, which affects the polarization of the time-delayed probe beam that passes through it. Then, a splitter followed by a waveplate separates two orthogonal polarizations of the probe beam and subsequently two photodiodes are used to detect each split beam. The detected voltage difference by photodiodes is then amplified by a lock-in amplifier which is a representation of the magnitude and phase of the transmitted THz wave through the sample.
Figure 9. Schematic representation of THz-TDS setup used to characterize samples.
A photoconductive antenna generates THz radiation and an electro-optic scheme is used for detecting the transmitted THz radiation through the sample.
The transmission ratio was obtained by dividing the transmitted THz wave through the samples by that obtained through a piece of the same (but bare) Kapton polyimide substrate film used as the reference. However, to evaluate the phase change between the exterior surfaces of the samples (φSample), the phase difference between the incident THz wave and the detected THz wave transmitted through sample (φmeasure) was first measured. Then, the phase of air and associated optical elements such as lenses or mirrors (φmirrors) had to be subtracted from φmeasure according to:
 |
where k0 is the wave number of air and d1 + d2 + d3 + d4 is the distance between the photodiodes and the PCA (Fig. 9). Therefore, an air scan was performed as the reference where the corresponding phase change φAirScan includes  . This phase was then subtracted from the measured phase of sample (φmeasure). However, while doing so, we also subtract a phase change associated with the contribution of air with the same thickness as the sample (ds). Therefore, a phase change equal to k0ds needs to be added back, which leads to a total phase change through the metamaterial sample to be:
 |
Additional Information
How to cite this article: Parvinnezhad Hokmabadi, M. et al. Plasmon-Induced Transparency by Hybridizing Concentric-Twisted Double Split Ring Resonators. Sci. Rep. 5, 15735; doi: 10.1038/srep15735 (2015).
Supplementary Material
Acknowledgments
This work was partially supported by the NSF CAREER Award (ECCS- 0955160) and the NSF Award ECCS-1441947. M.P.H. acknowledges Graduate Council Fellowship from the University of Alabama.
Footnotes
Author Contributions M.P.H. developed the concept, carried out the simulation, experiment, theoretical model, analysis of data, and wrote the manuscript. E.R. and E.P. fabricated the sample. S.M.K., as the principal investigator, conceived the idea, planned, coordinated and supervised the project, and wrote the manuscript. P.K. co-supervised the project and wrote the manuscript. M.P.H., P.K. and S.M.K. discussed the results and commented on the article.
References
- Shelby R. A., Smith D. R. & Schultz S. Experimental verification of a negative index of refraction. Science 292, 77–79 (2001). [DOI] [PubMed] [Google Scholar]
- Liu Z., Lee H., Xiong Y., Sun C. & Zhang X. Far-field optical hyperlens magnifying sub-diffraction-limited objects. Science 315, 1686–1686 (2007). [DOI] [PubMed] [Google Scholar]
- Feng L. et al. A. Experimental demonstration of a unidirectional reflectionless parity-time metamaterial at optical frequencies. Nat. Mater. 12, 108–113 (2013). [DOI] [PubMed] [Google Scholar]
- Menzel C. et al. Asymmetric transmission of linearly polarized light at optical metamaterials. Phys. Rev. Lett. 104, 253902 (2010). [DOI] [PubMed] [Google Scholar]
- Prodan E., Radloff C., Halas N. J. & Nordlander P. A hybridization model for the plasmon response of complex nanostructures. Science 302, 419–422 (2003). [DOI] [PubMed] [Google Scholar]
- Prodan E. & Nordlander P. J. C. P. Plasmon hybridization in spherical nanoparticles. J. Chem. Phys. 120, 5444–5454 (2004). [DOI] [PubMed] [Google Scholar]
- Zhang S., Genov D. A., Wang Y., Liu M. & Zhang X. Plasmon-induced transparency in metamaterials. Phys. Rev. Lett. 101, 047401 (2008). [DOI] [PubMed] [Google Scholar]
- Krauss T. F. Why do we need slow light? Nature Photon. 2, 448–450 (2008). [Google Scholar]
- Tucker R. S., Ku P. C. & Chang-Hasnain C. J. Slow-light optical buffers: capabilities and fundamental limitations. J. Lightwave Technol. 23, 4046–4066 (2005). [Google Scholar]
- Kang H. & Zhu Y. Observation of large Kerr nonlinearity at low light intensities. Phys. Rev. Lett. 91, 093601 (2003). [DOI] [PubMed] [Google Scholar]
- Corcoran B. et al. Green light emission in silicon through slow-light enhanced third-harmonic generation in photonic-crystal waveguides. Nature Photon. 3, 206–210 (2009). [Google Scholar]
- Wen H., Terrel M., Fan S. & Digonnet M. Sensing with slow light in fiber Bragg grating. IEEE Sens. J. I 12, 156–163 (2012). [Google Scholar]
- Liu N. et al. Planar metamaterial analogue of electromagnetically induced transparency for plasmonic sensing. Nano Lett. 10, 1103–1107 (2010). [DOI] [PubMed] [Google Scholar]
- Dong Z. G. et al. Enhanced sensing performance by the plasmonic analog of electromagnetically induced transparency in active metamaterials. Appl. Phys. Lett. 97, 114101 (2010). [Google Scholar]
- Boller K. J., Imamoglu A. & Harris S. E. Observation of electromagnetically induced transparency. Phys. Rev. Lett. 66, 2593–2596 (1991). [DOI] [PubMed] [Google Scholar]
- Fleischhauer M., Imamoglu A. & Marangos J. P. Electromagnetically induced transparency: optics in coherent media. Rev. Mod. Phys. 77, 633–673 (2005). [Google Scholar]
- Hau L. V., Harris S. E., Dutton Z. & Behroozi C. H. Light speed reduction to 17 meters per second in an ultracold atomic gas. Nature 397, 594–598 (1999). [Google Scholar]
- Liu C., Dutton Z., Behroozi Z. H. & Hau L. V. Observation of coherent optical information storage in an atomic medium using halted light pulses. Nature 409, 490–493 (2001). [DOI] [PubMed] [Google Scholar]
- Budker D., Kimball D., D. F., Rochester S. M. & Yashchuk V. V. Nonlinear magneto-optics and reduced group velocity of light in atomic vapor with slow ground state relaxation. Phys. Rev. Lett. 83, 1767–1770 (1999). [Google Scholar]
- Kash M. M. et al. Ultraslow Group Velocity and Enhanced Nonlinear Optical Effects in a Coherently Driven Hot Atomic Gas. Phys. Rev. Lett. 82, 5229–5232 (1999). [Google Scholar]
- Novikova I., Walsworth R. L. & Xiao Y. Electromagnetically induced transparency-based slow and stored light in warm atoms. Laser Photonics Rev. 6, 333–353 (2011). [Google Scholar]
- Shvets G. & Wurtele J. S., Transparency of Magnetized Plasma at the Cyclotron Frequency. Phys. Rev. Lett. 89, 115003 (2002). [DOI] [PubMed] [Google Scholar]
- Chen C. Y., Un I. W., Tai N. H. & Yen T. J. Asymmetric coupling between subradiant and superradiant plasmonic resonances and its enhanced sensing performance. Opt. Express 17, 15372–15380 (2009). [DOI] [PubMed] [Google Scholar]
- Wu C., Khanikaev A. B. & Shvets G. Broadband slow light metamaterial based on a double-continuum Fano resonance. Phys. Rev. Lett. 106, 107403 (2011). [DOI] [PubMed] [Google Scholar]
- Gan Q., Fu Z., Ding Y. J. & Bartoli F. J. Ultrawide-bandwidth slow-light system based on THz plasmonic graded metallic grating structures. Phys. Rev. Lett. 100, 256803 (2008). [DOI] [PubMed] [Google Scholar]
- Zhu Z. et al. Broadband plasmon induced transparency in terahertz metamaterials. Nanotechnology 24, 214003 (2013). [DOI] [PubMed] [Google Scholar]
- Kim J., Soref R. & Buchwald W. R. Multi-peak electromagnetically induced transparency (EIT)-like transmission from bull’s-eye-shaped metamaterial. Opt. Express 18, 17997–18002 (2010). [DOI] [PubMed] [Google Scholar]
- Zhang K. et al. Dual-mode electromagnetically induced transparency and slow light in a terahertz metamaterial. Opt. Lett. 39, 3539–3542 (2014). [DOI] [PubMed] [Google Scholar]
- Gu J. et al. Active control of electromagnetically induced transparency analogue in terahertz metamaterials. Nat. Commun. 3, 1151 (2012). [DOI] [PubMed] [Google Scholar]
- Miyamaru F. et al. W. Ultrafast optical control of group delay of narrow-band terahertz waves. Sci. Rep. 4 (2014). [DOI] [PMC free article] [PubMed] [Google Scholar]
- Wu J. et al. Superconducting terahertz metamaterials mimicking electromagnetically induced transparency. Appl. Phys. Lett 99, 161113 (2011). [Google Scholar]
- Papasimakis N. et al. Metamaterial with polarization and direction insensitive resonant transmission response mimicking electromagnetically induced transparency. Appl. Phys. Lett. 94, 211902 (2009). [Google Scholar]
- Meng F. Y., Wu Q., Erni D., Wu K. & Lee J. C. Polarization-independent metamaterial analog of electromagnetically induced transparency for a refractive-index-based sensor. Microwave Theory and Techniques, IEEE Transactions on 60, 3013–3022 (2012). [Google Scholar]
- Wang H., Brandl D. W., Le F., Nordlander P. & Halas N. J. Nanorice: a hybrid plasmonic nanostructure. Nano Lett. 6, 827–832 (2006). [DOI] [PubMed] [Google Scholar]
- Nordlander P., Oubre C., Prodan E., Li K. & Stockman M. I. Plasmon hybridization in nanoparticle dimers. Nano Lett. 4, 899–903 (2004). [Google Scholar]
- Liu N. et al. Plasmon Hybridization in Stacked Cut‐Wire Metamaterials. Adv. Mater. 19, 3628–3632 (2007). [Google Scholar]
- Halas N. J., Lal S., Chang W. S., Link S. & Nordlander P. Plasmons in strongly coupled metallic nanostructures. Chem. Rev. 111, 3913–3961 (2011). [DOI] [PubMed] [Google Scholar]
- Guo H. et al. Resonance hybridization in double split-ring resonator metamaterials. Opt. Express 15, 12095–12101 (2007). [DOI] [PubMed] [Google Scholar]
- Miroshnichenko A. E., Luk’yanchuk B., Maier S. A. & Kivshar Y. S. Optically induced interaction of magnetic moments in hybrid metamaterials. Acs Nano 6, 837–842 (2011). [DOI] [PubMed] [Google Scholar]
- Liu N., Kaiser S. & Giessen H. Magnetoinductive and electroinductive coupling in plasmonic metamaterial molecules. Adv. Mater. 20, 4521–4525 (2008). [Google Scholar]
- Singh R. et al. Probing the transition from an uncoupled to a strong near-field coupled regime between bright and dark mode resonators in metasurfaces. Appl. Phys. Lett. 105, 081108 (2014). [Google Scholar]
- Aydin K., Pryce I. M. & Atwater H. A. Symmetry breaking and strong coupling in planar optical metamaterials. Opt. Express 18, 13407–13417 (2010). [DOI] [PubMed] [Google Scholar]
- Ekmekci et al. Frequency tunable terahertz metamaterials using broadside coupled split-ring resonators. Phys. Rev. B. 83, 193103 (2011). [Google Scholar]
- Liu N., Liu H., Zhu S. & Giessen H. Stereometamaterials. Nature Photonics 3, 157–162 (2009). [Google Scholar]
- Yang Z. J., Zhang Z. S., Hao Z. H. & Wang Q. Q. Strong bonding magnetic plasmon hybridizations in double split-ring resonators. Opt. Lett. 37, 3675–3677 (2012). [DOI] [PubMed] [Google Scholar]
- Decker M., Linden S. & Wegener M. Coupling effects in low-symmetry planar split-ring resonator arrays. Opt. Lett. 34, 1579–1581 (2009). [DOI] [PubMed] [Google Scholar]
- Zhu M., Lin Y. S. & Lee C. Coupling effect combined with incident polarization to modulate double split-ring-resonator in terahertz frequency range. J. Appl. Phys. 116, 173106 (2014). [Google Scholar]
- Chowdhury D. R., O’Hara J. F., Taylor A. J. & Azad A. K. Orthogonally twisted planar concentric split ring resonators towards strong near field coupled terahertz metamaterials. Appl. Phys. Lett. 104, 101105 (2014). [Google Scholar]
- Hokmabadi M. P., Wilbert D. S., Kung P. & Kim S. M. Polarization-Dependent, Frequency-Selective THz Stereometamaterial Perfect Absorber. Phys. Rev. Applied 1, 044003 (2014). [Google Scholar]
Associated Data
This section collects any data citations, data availability statements, or supplementary materials included in this article.


