

Abstract
Objective
To determine whether the frequency of TDP-43 deposition in Alzheimer’s disease (AD) differs across pathologically defined AD subtypes (Hippocampal sparing [HpSp]; Typical and Limbic), and to further examine the relationship between TDP-43, pathological subtype, and clinical features in AD.
Methods
We identified all cases with pathologically-confirmed AD (NIA-Reagan intermediate-high probability, Braak stage IV–VI) independent of cognitive status (n=188). Neurofibrillary tangle counts were performed using thioflavin-S microscopy in hippocampus and three neocortical regions, and all cases were subtyped: HpSp AD Pathology (n=19); Typical AD Pathology (n=136); Limbic AD Pathology (n=33). TDP-43 immunoreactivity was performed in multiple brain regions to assess for the presence of TDP-43 and TDP-43 stage. All cases were clinically sub-classified at presentation as Amnestic AD Dementia versus Atypical AD Dementia. Statistical analysis was performed using linear and penalized logistic regression to assess associations with pathological subtype, and the effects of TDP-43, accounting for possible interactions between pathological subtype and TDP-43.
Results
TDP-43 deposition was frequent in Typical (59%) and Limbic AD pathologies (67%), but not HpSp AD Pathology (21%) (p=0.003). The observed associations of TDP-43 with greater memory loss, naming and functional decline, and smaller hippocampal volumes, closest to death, did not differ across AD pathological subtype. Clinical presentation was associated with pathological subtype (p=0.01), but not TDP-43 (p=0.69).
Interpretation
Although the frequency of TDP-43 deposition in AD varies by pathological subtype, the observed effects of TDP-43 on clinical/MRI features are consistent across pathological subtypes. Clinical presentation in AD is driven by pathological subtype, not by TDP-43.
Keywords: TDP-43, Alzheimer’s disease, hippocampal sparing, memory, amnestic, atypical
One of the two pathological hallmarks of Alzheimer’s disease (AD) is the tau immunoreactive neurofibrillary (NFT) tangle; the other being the senile plaque1. Neurofibrillary tangle deposition typically begins in the transentorhinal cortex, spreads into limbic regions such as the hippocampus, and finally into homotypic and idiotypic neocortices1. Such a stereotypic pattern of progression has been shown to account for approximately 75% of all AD cases; referred to as Typical AD Pathology. Two other patterns of NFT deposition have also been recently described, in which NFT deposition is either predominantly found in limbic regions, with relative sparing of neocortical regions (Limbic AD Pathology), or in which NFT deposition targets the neocortex, with relative sparing of the transentorhinal and limbic regions (Hippocampal-sparing (HpSp) AD Pathology))2. These three pathologically defined AD subtypes (Typical, Limbic and HpSp) have been shown to be associated with different clinical presentations2, and to have distinct regional patterns of brain atrophy on MRI3.
Over the past 8 years we and others have reported that another protein, the TAR DNA binding protein of 43 kDa (TDP-43), is also associated with AD4–10. The reported frequency of TDP-43 deposition in AD has, however, varied widely from center to center, with some centers reporting a frequency as low as 19%8 and others as high as 57%11. The reasons for such variability are unclear. One explanation for the variability is whether the amygdala is selected as the screening region for TDP-43 deposition. The amygdala is the first and most commonly affected region5, 7, 12 and hence studies that screened the amygdala tend to show higher frequencies of TDP-43 deposition than studies that did not screen the amygdala. With-that-said, we still observe wide variations across studies that screened the amygdala.
It has become apparent that TDP-43 plays an important role in the clinical features associated with AD6, 11, 13. In fact, TDP-43 is strongly associated with memory loss and smaller hippocampal volumes11, 13; two of the cardinal clinical features of AD. There are however, important questions that remain unanswered regarding TDP-43, pathological subtype, and clinical features in AD. For example, does the frequency of TDP-43 deposition differ across pathological subtypes when the amygdala is screened? Do the effects of TDP-43 on the clinical features of AD differ by pathological subtype, or are the effects consistent across subtypes? Is it TDP-43, pathological subtype, or both, that determines whether an AD subject has an amnestic presentation or presents as atypical AD?
In order to address these unsolved issues, we performed a clinico-imaging-pathological study investigating the relationships between AD pathological subtypes, TDP-43, and clinical features in AD; specifically assessing the relationships with amnestic vs atypical presentations. Given that TDP-43 is associated with memory loss11 and memory loss is associated with Typical and Limbic-, but not HpSp AD Pathology3, we hypothesize that (1) the frequency of TDP-43 deposition will be higher in Typical and Limbic AD pathologies than in HpSp AD Pathology, and (2) that an amnestic presentation in AD will be associated with AD pathological subtype and TDP-43.
METHODS
Subject selection
We identified all subjects from the Mayo Clinic, Rochester, MN neuropathological database that fulfilled inclusion criteria of intermediate-high probability AD based on NIA-Reagan criteria, had Braak neurofibrillary tangle stage IV–VI1, had an antemortem volumetric head MRI, had been prospectively recruited and followed longitudinally in the Mayo Clinic Alzheimer’s Disease Research Center (ADRC) or Alzheimer’s Disease Patient Registry (ADPR) (n=193). Five subjects who met inclusion criteria were excluded from the study due to poor MRI quality, leaving 188 subjects for analyses. All 188 subjects had undergone detailed clinical evaluations including neuropsychological testing, had consented to apolipoprotein E genotyping, and had brain autopsy. Of the 188 subjects, 175 were demented at the time of death based on DSM IV criteria (n=193)14. The remaining 13 subjects were cognitively normal at the time of death. All neuropathologic examinations were performed according to the recommendations of the Consortium to Establish a Registry for Alzheimer’s disease (CERAD)15.
Amnestic vs atypical AD determination
The medical records of all 175 demented cases were retrospectively reviewed in detail by an experienced behavioral neurologist (K.A.J) blinded to pathological subtype and TDP-43 status in order to determine whether the subject had had an amnestic or atypical clinical presentation. This clinical dichotomy was inspired by suggestions from the International Work Group that supports simplifying the clinical diagnosis of AD as typical or atypical16. In order to prevent confusion between clinical typical AD and pathological typical AD we classified the cases as Amnestic AD Dementia vs Atypical AD Dementia. A subject was classified as having Amnestic AD Dementia if at the time of presentation (Figure 1) the chief complaint was of memory loss and there was objective confirmation on neuropsychological testing that memory loss was the dominant feature of the presenting syndrome. A subject was classified as having Atypical AD Dementia if the chief complaint was something other than memory loss, such as visuo-spatial/perceptual, language, praxis, executive, or behavioral impairment, and there was objective evidence on neuropsychological testing that memory loss was not the most prominent feature of the presenting syndrome. We note that our criteria for Atypical AD Dementia do not require the preservation of memory performance. Of the 175 cognitively impaired subjects, 172 could be classified as Amnestic AD Dementia or Atypical AD Dementia. Three subjects could not be classified due to insufficient information in the medical records. Demographic, neuropsychological and neuropathological features of the 172 subjects in the amnestic and atypical AD dementia groups are shown in Table 1. As observed, the Amnestic AD Dementia group performed poorer on testing of memory compared to the Atypical AD Dementia group. On-the-contrary, the Atypical AD Dementia group showed trends for worse performance on non-memory tests compared to the Amnestic AD Dementia group.
Figure 1.
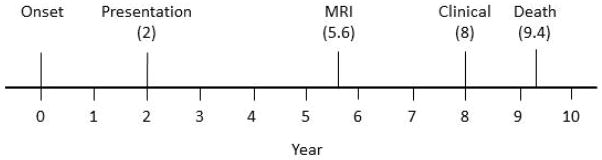
Timeline from onset to death showing key time points: onset; time of presentation; time at which the final MRI scan was performed before death and time at which the final clinical cognitive evaluation occurred before death.
Table 1.
Subject characteristics in Amnestic AD Dementia and Atypical AD Dementia subjects
| Amnestic AD Dementia (N = 136) | Atypical AD Dementia (N = 36) | P-value* | |
|---|---|---|---|
| Demographics | |||
| No. Female, n (%) | 82 (60%) | 14 (39%) | 0.02 |
| Education, yrs. | 13 [12, 16] (8, 20) | 15 [12, 16] (8, 20) | 0.46 |
| APOE ε 4 carrier, n (%) | 87 (64%) | 19 (53%) | 0.25 |
| Age at onset, yrs. | 76 [69, 82] (42, 96) | 62 [56, 73] (46, 91) | <0.001 |
| Total disease duration, yrs. | 10 [8, 13] (2, 27) | 8 [7, 10] (4, 12) | 0.003 |
| Age at death, yrs. | 86 [80, 92] (51, 104) | 71 [64, 82] (52, 98) | <0.001 |
| Time from presentation to death, yrs. | 7 [5, 9] (1, 16) | 5 [4, 7] (2, 10) | 0.003 |
| Mini-Mental State Exam score‡ | 25 [21, 27] (11, 30) | 22 [18, 25] (8, 29) | 0.01 |
| CDR Sum of Boxes‡ | 3 [2, 5] (0, 17) | 4 [2, 6] (0, 12) | 0.41 |
| Neuropsychological tests‡ | |||
| WMS logical memory delayed recall | 1 [0, 4] (0, 21) | 3 [1, 8] (0, 16) | 0.02 |
| Boston Naming Test | 44 [32, 52] (12, 59) | 45 [34, 52] (2, 58) | 0.92 |
| Controlled Oral Word Association Test | 26 [19, 35] (4, 68) | 24 [15, 30] (0, 49) | 0.09 |
| WAIS - block design | 12 [8, 18] (0, 36) | 6 [2, 19] (0, 31) | 0.14 |
| Pathological variables | |||
| AD subtype, n (%) |TDP+/n (%)† | <0.001 | ||
| Typical | 97 (71%) | 67/97 (69%) | 25 (69%) | 11/25 (44%) | |
| Limbic | 31 (23%) | 21/31 (68%) | 0 (0%) | 0/0 | |
| HpSp | 8 (6%) | 0/8 (0%) | 11 (31%) | 4/11 (36%) | |
| Braak stage, n (%) | 0.03 | ||
| 4 | 9 (7%) | 1 (3%) | |
| 5 | 41 (30%) | 4 (11%) | |
| 6 | 86 (63%) | 31 (86%) | |
| CERAD Frequent, n (%) | 95 (70%) | 32 (89%) | 0.02 |
| Infarction, n (%) | 33 (24%) | 3 (8%) | 0.04 |
| Hippocampal sclerosis positive, n (%) | 26 (19%) | 4 (11%) | 0.33 |
| Lewy bodies Positive, n (%) | 47 (35%) | 11 (31%) | 0.70 |
| TDP positive, n (%) | 88 (65%) | 15 (42%) | 0.02 |
| TDP stage, n (%) among TDP+ | 0.08 | ||
| Stage I | 19 (22%) | 1 (6.7%) | |
| Stage II | 25 (28%) | 4 (27%) | |
| Stage III | 27 (31%) | 5 (33%) | |
| Stage IV | 16 (18%) | 3 (20%) | |
| Stage V | 0 (0%) | 2 (13%) | |
Unless otherwise indicated values shown are median [quartiles] (range).
P-values are from Wilcoxon Rank Sum or Fisher’s Exact Tests.
Values to the left of the vertical bar are the number and percent in each group (Amnestic or atypical AD Dementia). The values shown to the right of the vertical bar are the fraction of subjects who are TDP positive and the percent positive.
WMS = Wechsler memory scale; WAIS = Wechsler Adult Intelligent Scale.
Data obtained at the time of presentation (see timeline figure 1)
This study was approved by the Mayo Clinic IRB. All subjects and/or their proxies provided written informed consent before participating in any research activity.
Pathological procedures
The details for the determination of categorization into Typical AD Pathology, Limbic AD Pathology and HpSp AD Pathology have previously been published2. Briefly, thioflavin-S fluorescence microscopy was utilized to quantitatively measure NFT densities with an Olympus BH2 fluorescence microscope (Center Valley, PA, USA). Neurofibrillary tangle counts included intracellular and extracellular tangles and were performed in the hippocampal CA1 region, subiculum, and in the middle frontal, inferior parietal, and superior temporal cortical regions. The final NFT density for each of the 5 regions was based on the average NFT density from the area with the highest density of pathology. An algorithm was utilized to classify subjects into Limbic AD Pathology and HpSp AD Pathology (Figure 2) using the hippocampal and cortical NFT counts, and the ratio of hippocampal-to-cortical counts, as previously described2. Cases not categorized as Limbic AD Pathology and HpSp AD Pathology were classified as Typical AD Pathology (Figure 2). Importantly, this algorithm was developed utilizing an independent cohort of almost 900 AD cases2.
Figure 2.

Thioflavin-S fluorescence photomicrograph of neurofibrillary tangles in all three AD pathologic variants. For each variant, compare the burden of neurofibrillary tangles in the hippocampus CA1 region versus the burden of neurofibrillary tangles in the frontal cortex (BA9/46). With Limbic AD pathology, greater burden of neurofibrillary tangles is observed in the hippocampus, while in Hippocampal Sparing AD pathology greater burden is observed in the frontal cortex. In Typical AD the burden of neurofibrillarly tangles in the hippocampus and frontal cortex are similar. Images are all X200 (Insets are X400). Scale bar in panel b represents 50 microns; scale bar in inset of panel b is 25 microns.
For this study, blocks from amygdala, hippocampus, lateral temporal cortex, middle frontal cortex and basal ganglia were sectioned and immunostained for TDP-43 (polyclonal antibody MC2085 that recognizes a peptide sequence in the 25-kDa C-terminal fragment17) with a DAKO-Autostainer (DAKO-Cytomaton, Carpinteria, CA) and 3, 3′-diaminobenzidine as the chromogen. Sensitivity of this antibody has been previously shown to be excellent11. Sections were lightly counterstained with Hematoxylin. Cases were considered TDP-positive if there were any TDP-43 immunoreactive neuronal cytoplasmic inclusions, dystrophic neurites, or neuronal intranuclear inclusions observed at 200X magnification, screening the entire region. Cases were considered negative if no TDP-43 immunoreactive neuronal cytoplasmic inclusions, dystrophic neurites, or neuronal intranuclear inclusions were observed in any of the regions screened (amygdala, subiculum and dentate gyrus of the hippocampus, lateral temporal cortex, middle frontal cortex and basal ganglia).
We also performed TDP-43 staging based on our previously published staging scheme5 as follows: Stage I, TDP-43 deposition is limited to the amygdala; Stage II, TDP-43 deposition extends into entorhinal cortex and/or subiculum; Stage III, TDP-43 deposition extends into hippocampus dentate granule cell layer and/or occipitotemporal cortex; Stage IV, TDP-43 extends into the inferior temporal cortex, and Stage V, TDP-43 deposition extends into frontal cortex and/or basal ganglia.
Volumetric measures from MRI
All 188 subjects in the study had completed an antemortem volumetric head MRI scan at a 1.5T magnetic field strength performed with a standardized protocol18. The MRI scan performed closest to death was used to provide the shortest interval to death (Figure 1). Grey matter volumes of the hippocampus, and lateral frontal, temporal and parietal lobes were calculated using atlas-based parcellation in SPM5 and the automated anatomic labelling atlas19, as previously described3, 20. Right and left volumes were averaged and scaled by total intracranial volume21 to correct for head size. Total intracranial volume was calculated by propagating a template-drawn mask to subject space, as previously described3.
Statistical Analysis
Demographic and clinical cognitive variables were compared between those with and without TDP-43 deposition in each of the three pathological subtypes of AD using Fishers Exact or Wilcoxon rank sum tests where appropriate. P < 0.05 was considered statistically significant. Linear regression adjusting for age at death was performed with the outcome being one of six clinical test scores [Mini-Mental Status Examination (MMSE)22, Clinical Dementia Rating Scale Sum of Boxes (CDR-SB)23, the Logical memory delayed recall subtest of the Wechsler Memory Scale24 (WMS memory), the Boston Naming Test (BNT)25, the Control Oral word Association Test (COWAT)26, and the block design subtest of the Wechsler Adult Intelligence Scale 27 (WAIS-block design)], and one of four brain volumes (hippocampus, lateral frontal, lateral temporal, and lateral parietal modelled as a percentage of TIV21) to evaluate mean values by TDP-43 status within each pathological subtype. All clinical cognitive scores were also obtained at the time point closest to death for which the data was available (mean time = 1.4 years before death; Figure 1). We report p-values for sequential F tests of age, pathological subtype controlling for age, TDP-43 deposition controlling for subtype and age, and the interaction between pathological subtype and TDP-43 deposition. We summarize the associations across these endpoints from an additive model with age, AD pathological subtype, and TDP-43 status in a table showing regression coefficients, 95% confidence intervals, and a Cohen’s d measure of the TDP-43 effect size. The latter was calculated from the regression-based estimated difference between the TDP+ and TDP− means scaled by the sample standard deviation28. We calculated a 95% confidence intervals for Cohen’s d using bootstrap methods with 10,000 replicates. The 95% confidence intervals in the table provide an indication of the precision of our estimates. Ninety-five percent confidence intervals that do not include the null value of zero are equivalent to a statistical test with p<0.05.
To investigate whether any CDR-SB finding was driven by the memory or the functional components of the CDR (orientation + judgment/problem solving +community affairs + home/hobbies + personal care), we performed linear regression as described above treating the memory and functional sub-scores as separate endpoints. We also performed Spearman rank correlations between the memory and functional sub-scores of the CDR-SB to determine the extent to which they provide independent information. Spearman rank correlations were also performed between WMS delayed recall and hippocampal volumes for all subjects, as well as subjects stratified by TDP-43 status (positive or negative), to determine whether the well-recognized brain behavioral relationship between memory and hippocampal volumes held true for our cohort. Penalized logistic regression was performed to evaluate the association between TDP-43 deposition within pathological subtype and the odds of an amnestic presentation. To address separation and the potential for sparse data bias in the logistic regression model we used data augmentation priors in which we incorporated background information by assuming that the true relative odds of an amnestic presentation for TDP+ versus TDP− was likely to be between 1/10 and 1029. This method is a generalization of the widely applied idea of adding two “successes” and two “failures” to more reliably estimate a binomial proportion30. All analyses were performed with R statistical software version 3.1.2 (R Foundation for Statistical Computing, Vienna, Austria).
RESULTS
Of the 188 pathologically characterized AD cases in this study, 19 (10%) were classified by the NFT count algorithm as HpSp AD Pathology, 136 (72%) as Typical AD Pathology and 33 (18%) as Limbic AD Pathology (Table 2). There was a difference in the frequency of TDP-43 deposition across the three AD subtypes (p=0.003) with HpSp AD Pathology having the lowest frequency (4/19, 21%) compared to Typical AD Pathology (80/136, 59%) and Limbic AD Pathology (22/33, 67%). There were some demographic differences by TDP-43, including age within the Typical AD Pathology subtype while hippocampal sclerosis was associated with TDP-43 in the Limbic AD Pathology subtype. Of the 13 subjects that were cognitively normal at death, 12 (92%) had Typical AD Pathology, and 11(85%) were TDP-43 negative. An Amnestic AD Dementia presentation was observed across all three pathological AD subtypes. Further, in the Limbic AD Pathology subtype there were no subjects with an Atypical AD Dementia syndrome. We also observed that all four HpSp TDP-43 positive subjects had an Atypical AD Dementia syndrome at presentation. TDP-43 stages varied across the AD pathological subtypes without any real discernable pattern, although, while stages IV and V were not common in the Typical and Limbic AD pathology subtypes (19% each), 2/4 of those with HpSp AD Pathology (50%) were stages IV and V.
Table 2.
Subject characteristics by pathological subtype of AD and TDP-43 status (unless otherwise indicated values shown are median (range)).
| Total N = 188 |
HpSp AD N = 19 |
Typical AD N = 136 |
Limbic AD N = 33 |
||||
|---|---|---|---|---|---|---|---|
|
| |||||||
| TDP+ N = 4 |
TDP− N = 15 |
TDP+ N = 80 |
TDP− N = 56 |
TDP+ N = 22 |
TDP− N = 11 |
||
| No. Female, n (%) | 107 (57%) | 1 (25%) | 6 (40%) | 49 (61%) | 29 (52%) | 14 (64%) | 8 (73%) |
| Education, yrs. | 14 (8, 20) | 16 (12, 18) | 16 (8, 20) | 12 (8, 20) | 15 (8, 20)* | 14 (8, 18) | 12 (8, 20) |
| APOE ε 4 carrier, n (%) | 110 (59%) | 1 (25%) | 11 (73%) | 50 (62%) | 24 (43%)* | 17 (77%) | 7 (64%) |
| Age at onset, yrs. | 74 (42, 96) | 69 (62, 76) | 59 (48, 79) | 76 (50, 96) | 68 (42, 87)*** | 78 (67, 88) | 79 (75, 93) |
| Age at death, yrs. | 85 (51, 104) | 79 (70, 88) | 68 (55, 86) | 86 (56, 104) | 81 (51, 100)** | 87 (76, 100) | 92 (84, 96) |
| Time from onset to death, yrs. | 9 (2, 27) | 10 (7, 12) | 8 (5, 13) | 9 (2, 27) | 10 (4, 20) | 11 (4, 19) | 8 (3, 16) |
| Cognitively normal at death, n (%) | 13 (7%) | 0 (0%) | 0 (0%) | 2 (2%) | 10 (18%)*** | 0 (0%) | 1 (9%) |
| Presentation, n (%) | |||||||
| Amnestic AD Dementia | 136 (74%) | 0 (0%) | 8 (53%) | 67 (84%) | 30 (56%) | 21 (100%) | 10 (91%) |
| Atypical AD Dementia | 36 (19%) | 4 (100%) | 7 (47%) | 11 (14%) | 14 (26%) | 0 (0%) | 0 (0%) |
| Braak stage, n (%) | |||||||
| 4 | 18 (10%) | 0 (0%) | 0 (0%) | 8 (10%) | 9 (16%) | 0 (0%) | 1 (9%) |
| 5 | 52 (28%) | 0 (0%) | 2 (13%) | 21 (26%) | 16 (29%) | 8 (36%) | 5 (45%) |
| 6 | 118 (63%) | 4 (100%) | 13 (87%) | 51 (64%) | 31 (55%) | 14 (64%) | 5 (45%) |
| CERAD Frequent, n (%) | 132 (70%) | 2 (50%) | 13 (87%) | 56 (70%) | 40 (71%) | 12 (55%) | 9 (82%) |
| Infarction, n (%) | 41 (22%) | 0 (0%) | 1 (7%) | 20 (25%) | 11 (20%) | 6 (27%) | 3 (27%) |
| Hippocampal sclerosis positive, n (%) | 33 (18%) | 2 (50%) | 1 (7%) | 15 (19%) | 5 (9%) | 10 (45%) | 0 (0%)* |
| Lewy bodies Positive, n (%) | 62 (33%) | 2 (50%) | 6 (40%) | 30 (38%) | 14 (25%) | 8 (36%) | 2 (18%) |
| TDP stage, n (%) | |||||||
| Stage I | 21 (20%) | 0 (0%) | - | 16 (20%) | - | 5 (24%) | - |
| Stage II | 30 (29%) | 1 (25%) | - | 27 (34%) | - | 2 (10%) | - |
| Stage III | 33 (31%) | 1 (25%) | - | 22 (28%) | - | 10 (48%) | - |
| Stage IV | 19 (18%) | 1 (25%) | - | 14 (18%) | - | 4 (19%) | - |
| Stage V | 2 (2%) | 1 (25%) | - | 1 (1%) | - | 0 (0%) | - |
Pairwise comparison within AD subtype;
p < 0.05,
p < 0.01.
p < 0.001. P-values were from Fishers Exact and Wilcoxon rank sum tests.
The effects of pathological subtype and TDP-43 on MMSE, CDR-SB, WMS memory, BNT, COWAT and WAIS-block design are shown in Figure 3. After controlling for age, there was no evidence for an association of pathological subtype with any of the clinical cognitive measures except for WMS memory. After controlling for age and pathological subtype, the presence of TDP-43 was associated with poorer performance on the WMS memory, BNT and CDR-SB. In fact the biggest TDP-43 effects sizes were observed with BNT and WMS memory (Table 3). When we separated the CDR-SB into memory vs functional components, we found TDP-43 to be associated with the memory component (p=0.04), as well as the non-memory functional component (p=0.06), although both components were strongly correlated (r=0.9; p<0.001). The effects of TDP-43 on WMS memory and BNT did not differ across the pathological subtypes. The effects of pathological subtype and TDP-43 on hippocampal, lateral frontal, lateral temporal and lateral parietal volumes are shown in Figure 4. After controlling for age, there were associations between AD pathological subtype and all four regional volumes. After controlling for age and pathological subtype, the presence of TDP-43 was associated with smaller hippocampal volumes. The only TDP-43 effect size of significance was with hippocampus, with an effect size of similar magnitude to the TDP-43 effect size on WMS memory (Table 3). The effect of TDP-43 on hippocampal volume did not differ across the pathological subtypes.
Figure 3.

Model summaries for the six clinical variables. Estimates and 95% CIs are shown for the mean within each subgroup. The p-values summarize sequential tests of (from left to right) the effect of age on the clinical variables, the effect of pathological subtype after accounting for age, the effect of TDP-43 after accounting for age and pathological subtype, and an interaction term between pathological subtype and TDP-43 and each clinical variable.
Table 3.
Summary of linear regression model coefficients and the TDP effect size expressed as Cohen’s d.
| Coefficient (95% CI) representing mean difference on measured scale* | |||||
|---|---|---|---|---|---|
| Endpoint | Age, 10-year increase | HpSp vs Typical | Limbic vs Typical | TDP+ vs TDP− | TDP effect size, Cohen’s d |
| Mental status | |||||
| MMSE | 2.0 (0.9, 3.1) | −0.0 (−3.7, 3.6) | −0.8 (−3.6, 2.1) | −1.3 (−3.5, 0.9) | −0.18 (−0.49, 0.14) |
| CDR-SB | −1.2 (−2.1, −0.2) | 0.6 (−2.7, 3.9) | 0.8 (−1.7, 3.3) | 1.8 (−0.2, 3.7) | 0.28 (−0.04, 0.60) |
| Neuropsychological testing | |||||
| Boston Naming | 0.0 (−2.0, 2.0) | −4.5 (−11.7, 2.7) | −1.6 (−6.8, 3.6) | −7.4 (−11.4, −3.4) | −0.55 (−0.85, −0.24) |
| WMS Logical Memory | 0.6 (−0.3, 1.4) | −1.0 (−3.9, 1.9) | −2.4 (−4.5, −0.3) | −2.4 (−4.0, −0.8) | −0.45 (−0.75, −0.13) |
| COWAT | 2.1 (0.5, 3.8) | −1.9 (−7.8, 4.0) | −0.0 (−4.3, 4.2) | −2.1 (−5.4, 1.2) | −0.20 (−0.52, 0.13) |
| WAIS Block Design | 1.6 (0.0, 3.1) | −4.1 (−9.8, 1.5) | −1.3 (−4.6, 1.9) | −1.4 (−4.0, 1.2) | −0.19 (−0.55, 0.15) |
| Regional volumes† | |||||
| Hippocampus | −0.00 (−0.01, 0.01) | 0.00 (−0.03, 0.04) | −0.04 (−0.06, −0.01) | −0.02 (−0.04, −0.01) | −0.38 (−0.67, −0.09) |
| Lateral frontal | 0.05 (−0.03, 0.14) | −0.31 (−0.60, −0.03) | 0.09 (−0.12, 0.31) | 0.02 (−0.15, 0.19) | 0.04 (−0.25, 0.34) |
| Lateral parietal | 0.07 (0.02, 0.12) | −0.26 (−0.44, −0.08) | 0.07 (−0.07, 0.20) | 0.03 (−0.08, 0.14) | 0.08 (−0.21, 0.35) |
| Lateral temporal | 0.13 (0.05, 0.21) | −0.38 (−0.65, −0.10) | 0.07 (−0.14, 0.27) | −0.09 (−0.25, 0.07) | −0.17 (−0.47, 0.13) |
95% CIs that do not include zero are significant at the p<0.05 level.
Regression estimates represent differences in terms of regional volume as a percentage of total intracranial volume.
Figure 4.

Model summaries for the four neuroimaging variables. Estimates and 95% CIs are shown for the mean within each subgroup. The p-values summarize sequential tests of (from left to right) the effect of age on the neuroimaging regions of interest, the effect of pathological subtype after accounting for age, the effect of TDP-43 after accounting for age and pathological subtype, and an interaction term between pathological subtype and TDP-43 and each neuroimaging variable.
The effect of pathological subtype and TDP-43 on clinical presentation is shown in Figure 5. After controlling for age, AD pathological subtype was associated with clinical presentation. After controlling for age and pathological subtype, TDP-43 was not associated with clinical presentation. We did not identify any interactions between the presence of TDP-43 and pathological subtype. In order to determine whether the lack of an association between TDP-43 and clinical presentation was due to the fact that TDP-43 was associated with both a memory and language measure (i.e., to adjust for a possible non-amnestic language association with TDP-43), additional analyses were undertaken. Ignoring age and AD pathologic subtype TDP-43 was associated with increased odds of an amnestic presentation (OR= 2.6 (95% CI: 1.2, 5.5)). However, after adjusting for age, the OR was 1.0 (95% CI: 0.4, 2.5). When we fitted a model with age, BNT and TDP-43 only, there was no association between clinical presentation and TDP-43 (p=0.70).
Figure 5.

Model summary for amnestic AD vs atypical AD status at presentation. The x axis shows the proportion of cases with an amnestic phenotype with estimates and 95% CIs shown. The p-values summarize sequential tests of (from left to right) the effect of age on phenotype, the effect of pathological subtype after accounting for age, the effect of TDP-43 after accounting for age and pathological subtype, and an interaction term between pathological subtype and TDP-43 and phenotype.
Hippocampal volume was associated with memory loss across all subjects (r=0.3; p<0.001), as well as in the TDP-43 positive (r=0.2; p=0.07) and TDP-43 negative subjects (r=0.3; p=0.02). However, neither hippocampal volume nor WMS memory at the time closest to death were associated with clinical presentation.
DISCUSSION
We have previously demonstrated that TDP-43 plays an important role in the clinical manifestation of AD by showing strong associations between the presence of TDP-43 and clinical and imaging features, such as memory loss and smaller hippocampal volumes. Independently, we have demonstrated that there are 3 distinct clinico-pathological subtypes of AD: HpSp AD Pathology, Typical AD Pathology and Limbic AD Pathology. In this study, we further our findings by demonstrating that the effect of TDP-43 on the clinical features associated with AD appears to be consistent across the three pathological subtypes. Additionally, we show that pathological subtype, and not TDP-43, determines whether a subject presents with an amnestic or atypical clinical phenotype.
One of the aims of this study was to determine whether the frequency of TDP-43 deposition differs across the pathological subtypes of AD when TDP-43 screening is performed in the amygdala. We were able to confirm our hypothesis that TDP-43 deposition would be higher in Typical and Limbic AD Pathology than HpSp AD Pathology. By screening the amygdala, however, we found the frequencies of TDP-43 deposition to be more than double those that we had previously reported when we did not screen the amygdala2. In Typical AD Pathology, for example, our largest group, 59% of the subjects were found to have TDP-43 compared to our previous report of 30%. Given that Typical and Limbic AD pathologies account for approximately 90% of all pathologically confirmed AD cases, it appears that TDP-43 deposition in AD is more the rule, than the exception. Our study also helps to answer the question as to why there is so much variability in the frequency of TDP-43 across different centers5. Centers with a higher proportion of HpSp AD Pathology will inevitably have a lower frequency of TDP-43 compared to centers with a lower proportion of HpSp AD Pathology.
Our second aim was to determine whether the effects of TDP-43 on the clinical and neuroimaging features of AD were being driven by one pathological subtype of AD. In order to achieve our aim, we first had to account for the potential confounding effect of age, given that age was not only different between TDP-43 positive and TDP-43 negative groups within pathological subtype, but age also differed across pathological subtypes (P<0.001). After accounting for age and AD pathological subtype we found TDP-43 to be associated with more functional impairment, greater memory loss and poorer naming. We did not find any evidence for TDP-43 to be associated with other cognitive domains suggesting that TDP-43 associations are specific to the domains of memory and language. We also investigated whether the observed association between TDP-43 and functional decline as measured by the CDR-SB was being driven by the memory component of the CDR. We found TDP-43 to be associated with the memory box score further emphasizing the strong association between TDP-43 and memory. However, because of the strong correlation between the CDR memory box and the CDR function boxes we were unable to confirm or exclude an association between TDP-43 and the non-memory functional components of the CDR.
As expected based on our previous study3, pathological subtype was associated with differences in volume of the hippocampus, lateral frontal, parietal and temporal lobes. These associations are consistent with the fact that the pathological subtypes of AD have distinct regional patterns of atrophy3, with, for example, HpSp AD Pathology showing greater cortical atrophy and less hippocampal atrophy than limbic AD Pathology. Given that pathological subtype is determined by the distribution of tau, it appears that tau has an effect on hippocampus, frontal, temporal and parietal tissue loss. On-the-contrary, after accounting for age and pathological subtype, the only region that was associated with the presence of TDP-43 was the hippocampus. This suggests that the effect of TDP-43 on tissue loss in AD is relatively focal, targeting the hippocampus. The fact that we did not see any interactions suggests that TDP-43 is associated with smaller hippocampal volumes regardless of pathological subtype.
Our last aim was to determine whether TDP-43, pathological subtype, or both, are associated with an amnestic vs atypical clinical presentation. After adjusting for age, syndromic presentation was associated with pathological subtype. However, after accounting for age and pathological subtype, we did not find any association between the presence of TDP-43 and syndromic presentation. This finding would appear to conflict with findings from previous studies that found TDP-43 to be associated with AD cases that had an amnestic presentation, sometimes referred to as dementia of the Alzheimer’s type (DAT), but not with AD cases that presented with an atypical phenotype (primary progressive aphasia [PPA])31, 32. We suspect that the association of TDP-43 with DAT, but not PPA, in those studies was confounded by pathological subtype. Specifically, DAT subjects would be more likely to have been classified as Typical AD Pathology or Limbic AD Pathology and hence would have higher frequencies of TDP-43 while PPA subjects with AD would be more likely to have been classified as HpSp AD Pathology and hence would have a lower frequency of TDP-43.
The two major findings from this study are 1) that TDP-43 is related to relatively greater memory loss and naming impairment regardless of pathological subtype, and 2) that pathological subtype, but not the presence or absence of TDP-43, is associated with the amnestic vs. atypical clinical presentation. One possible explanation for the lack of association between TDP-43 and clinical presentation is that TDP-43 had strong associations (largest effect sizes) with both memory and language measures, and hence TDP-43 is associated with important features of both clinical presentations. However, in our model with age and TDP-43 only, and in our model with age, TDP-43 and BNT we did not find any association between TDP-43 and clinical presentation. However, it is important to note that we did not find any association between clinical presentation and memory loss or hippocampal volume at the time closest to death. These findings suggest that although there is a clear distinction in clinical phenotypes at the time of presentation (amnestic vs atypical), this distinction blurs over time with disease progression. In our cohort, the time between clinical presentation and pathological determination of TDP-43 status was almost 7 ½ years. The strong association between clinical presentation and AD pathological subtype, but not TDP-43, is intriguing, and suggests, possibly, that the effects of TDP-43 on AD clinical features is a modification of the effects of tau. More specifically, that tau drives the presenting phenotype in AD which, after a period of time, begins to be modified by TDP-43.
We did not observe many differences between TDP-43 positive and TDP-43 negative subjects within the pathological subtypes of AD, possibly due to limited power in some groups. For example, TDP-43 positive subjects were significantly older at onset in the Typical AD subjects, but not in the smaller HpSp AD group, although the age difference was greater in HpSp AD Pathology compared to Typical AD Pathology (10-years vs 8-years). We did, however, take age into account in all of our analyses. Within the Typical AD Pathology subtype the presence of TDP-43 was associated with a higher frequency of being a carrier of the apolipoprotein E4 allele, an association we previously reported when all pathological subtypes of AD were combined11. However, there was no difference in the apolipoprotein E4 allele frequency across the pathological subtypes of AD (p=0.15) suggesting the associations of TDP-43 and apolipoprotein E4 are independent of pathological subtype. The difference in education by TDP-43 observed in the Typical AD Pathology group is of interest but of unclear significance.
Hippocampal sclerosis is strongly associated with TDP-4333, 34 and the effect of hippocampal sclerosis on TDP-43, and vice versa, is often difficult to tease apart. We and others, however, have demonstrated that the effect of TDP-43 on cognitive variables, including those assessed in this study, is not mediated by hippocampal sclerosis11, 35. In this study, hippocampal sclerosis did not differ across the pathological subtypes (p=0.12) and was only different between TDP-43 positive and negative subjects within the Limbic AD Pathology subtype. Hence, hippocampal sclerosis is unlikely to have confounded our findings.
We have previously published a staging scheme for TDP-43 deposition in AD5, referred to as the TAD staging scheme36. While we did not find significant evidence that the TAD staging scheme differed across AD pathological subtypes, we noted that all four HpSp AD subtype subjects were TDP-43 positive with an atypical clinical presentation, two of which were TAD stages IV and V. It is therefore possible that some of these four subjects had a frontotemporal lobar degeneration (FTLD-TDP) with coexisting AD pathology, as opposed to AD with TDP-43. Subjects in our cohort, however, did not have features suggestive of FTLD37. Additional analyses with a much larger cohort will be needed, however, to further investigate this issue. We also found associations between memory loss and smaller hippocampal volumes, independent of TDP-43 status, confirming the brain behavior relationship that would be expected in an AD cohort. The findings from this study have important consequences for studies addressing clinical, imaging, pathological, and even genetic features of AD and support the notion that future AD studies should take into account TDP-43 status and the pathological subtypes of AD.
Acknowledgments
We wish to thank Kris Johnson, Linda Rousseau, Virginia Phillips and Monica Casey Castanedes for pathological support, Dr.’s David Knopman, Bradley Boeve and Glenn Smith for the clinical evaluations, and Dr. Clifford R. Jack for laboratory support for the neuroimaging analyses.
Footnotes
AUTHORS CONTRIBUTIONS
KAJ was responsible for study concept and design, data interpretation and drafting the original report which was reviewed and revised by JLW, SDW, MEM, NT, AL, LP, MLS, RJI, JEP, RCP and DWD. KAJ, MEM, AL and DWD were responsible for acquisition of TDP-43 data and pathological classification. JLW and MLS were responsible for all neuroimaging analyses. SDW and NT were responsible for statistical analysis. LP was responsible for providing the TDP-43 antibodies utilized in this study. RCP and RJI were responsible for acquisition of clinical data. Pathological examinations were performed by DWD and JEP. Funding was obtained by KAJ, JLW and RCP.
CONFLICTS OF INTEREST
The work was supported by grants from the National Institutes of Health (R01 AG037491 (KAJ), R21-AG038736 (JLW), P50-AG016574 (RCP)). Dr. Petersen received personal fees from Pfizer and Janssen Alzheimer Immunotherapy outside the submitted work.
References
- 1.Braak H, Braak E. Neuropathological stageing of Alzheimer-related changes. Acta Neuropathol. 1991;82(4):239–59. doi: 10.1007/BF00308809. [DOI] [PubMed] [Google Scholar]
- 2.Murray ME, Graff-Radford NR, Ross OA, Petersen RC, Duara R, Dickson DW. Neuropathologically defined subtypes of Alzheimer’s disease with distinct clinical characteristics: a retrospective study. Lancet Neurol. 2011 Sep;10(9):785–96. doi: 10.1016/S1474-4422(11)70156-9. [DOI] [PMC free article] [PubMed] [Google Scholar]
- 3.Whitwell JL, Dickson DW, Murray ME, et al. Neuroimaging correlates of pathologically defined subtypes of Alzheimer’s disease: a case-control study. Lancet Neurol. 2012 Oct;11(10):868–77. doi: 10.1016/S1474-4422(12)70200-4. [DOI] [PMC free article] [PubMed] [Google Scholar]
- 4.Amador-Ortiz C, Lin WL, Ahmed Z, et al. TDP-43 immunoreactivity in hippocampal sclerosis and Alzheimer’s disease. Ann Neurol. 2007 May;61(5):435–45. doi: 10.1002/ana.21154. [DOI] [PMC free article] [PubMed] [Google Scholar]
- 5.Josephs KA, Murray ME, Whitwell JL, et al. Staging TDP-43 pathology in Alzheimer’s disease. Acta Neuropathol. 2014 Mar;127(3):441–50. doi: 10.1007/s00401-013-1211-9. [DOI] [PMC free article] [PubMed] [Google Scholar]
- 6.Josephs KA, Whitwell JL, Knopman DS, et al. Abnormal TDP-43 immunoreactivity in AD modifies clinicopathologic and radiologic phenotype. Neurology. 2008 May 6;70(19 Pt 2):1850–7. doi: 10.1212/01.wnl.0000304041.09418.b1. [DOI] [PMC free article] [PubMed] [Google Scholar]
- 7.Arai T, Mackenzie IR, Hasegawa M, et al. Phosphorylated TDP-43 in Alzheimer’s disease and dementia with Lewy bodies. Acta Neuropathol. 2009 Feb;117(2):125–36. doi: 10.1007/s00401-008-0480-1. [DOI] [PubMed] [Google Scholar]
- 8.Davidson YS, Raby S, Foulds PG, et al. TDP-43 pathological changes in early onset familial and sporadic Alzheimer’s disease, late onset Alzheimer’s disease and Down’s syndrome: association with age, hippocampal sclerosis and clinical phenotype. Acta Neuropathol. 2011 Dec;122(6):703–13. doi: 10.1007/s00401-011-0879-y. [DOI] [PubMed] [Google Scholar]
- 9.Uryu K, Nakashima-Yasuda H, Forman MS, et al. Concomitant TAR-DNA-binding protein 43 pathology is present in Alzheimer disease and corticobasal degeneration but not in other tauopathies. J Neuropathol Exp Neurol. 2008 Jun;67(6):555–64. doi: 10.1097/NEN.0b013e31817713b5. [DOI] [PMC free article] [PubMed] [Google Scholar]
- 10.Kadokura A, Yamazaki T, Lemere CA, Takatama M, Okamoto K. Regional distribution of TDP-43 inclusions in Alzheimer disease (AD) brains: their relation to AD common pathology. Neuropathology. 2009 Oct;29(5):566–73. doi: 10.1111/j.1440-1789.2009.01017.x. [DOI] [PubMed] [Google Scholar]
- 11.Josephs KA, Whitwell JL, Weigand SD, et al. TDP-43 is a key player in the clinical features associated with Alzheimer’s disease. Acta Neuropathol. 2014;127(6):811–24. doi: 10.1007/s00401-014-1269-z. [DOI] [PMC free article] [PubMed] [Google Scholar]
- 12.Hu WT, Josephs KA, Knopman DS, et al. Temporal lobar predominance of TDP-43 neuronal cytoplasmic inclusions in Alzheimer disease. Acta Neuropathol. 2008 Aug;116(2):215–20. doi: 10.1007/s00401-008-0400-4. [DOI] [PMC free article] [PubMed] [Google Scholar]
- 13.Wilson RS, Yu L, Trojanowski JQ, et al. TDP-43 pathology, cognitive decline, and dementia in old age. JAMA Neurol. 2013 Nov;70(11):1418–24. doi: 10.1001/jamaneurol.2013.3961. [DOI] [PMC free article] [PubMed] [Google Scholar]
- 14.American Psychiatric Association. American Psychiatric Association Diagnostic and Statistical Manual of Mental Disorders. 4. Washington, DC: American Psychiatric Association; 2000. text rev. [Google Scholar]
- 15.Mirra SS, Heyman A, McKeel D, et al. The Consortium to Establish a Registry for Alzheimer’s Disease (CERAD) Part II. Standardization of the neuropathologic assessment of Alzheimer’s disease. Neurology. 1991 Apr;41(4):479–86. doi: 10.1212/wnl.41.4.479. [DOI] [PubMed] [Google Scholar]
- 16.Dubois B, Feldman HH, Jacova C, et al. Advancing research diagnostic criteria for Alzheimer’s disease: the IWG-2 criteria. Lancet Neurol. 2014 Jun;13(6):614–29. doi: 10.1016/S1474-4422(14)70090-0. [DOI] [PubMed] [Google Scholar]
- 17.Zhang YJ, Xu YF, Cook C, et al. Aberrant cleavage of TDP-43 enhances aggregation and cellular toxicity. Proc Natl Acad Sci U S A. 2009 May 5;106(18):7607–12. doi: 10.1073/pnas.0900688106. [DOI] [PMC free article] [PubMed] [Google Scholar]
- 18.Jack CR, Jr, Lowe VJ, Senjem ML, et al. 11C PiB and structural MRI provide complementary information in imaging of Alzheimer’s disease and amnestic mild cognitive impairment. Brain. 2008 Mar;131(Pt 3):665–80. doi: 10.1093/brain/awm336. [DOI] [PMC free article] [PubMed] [Google Scholar]
- 19.Tzourio-Mazoyer N, Landeau B, Papathanassiou D, et al. Automated anatomical labeling of activations in SPM using a macroscopic anatomical parcellation of the MNI MRI single-subject brain. Neuroimage. 2002 Jan;15(1):273–89. doi: 10.1006/nimg.2001.0978. [DOI] [PubMed] [Google Scholar]
- 20.Whitwell JL, Jack CR, Jr, Przybelski SA, et al. Temporoparietal atrophy: a marker of AD pathology independent of clinical diagnosis. Neurobiol Aging. 2011 Sep;32(9):1531–41. doi: 10.1016/j.neurobiolaging.2009.10.012. [DOI] [PMC free article] [PubMed] [Google Scholar]
- 21.Whitwell JL, Crum WR, Watt HC, Fox NC. Normalization of cerebral volumes by use of intracranial volume: implications for longitudinal quantitative MR imaging. AJNR Am J Neuroradiol. 2001 Sep;22(8):1483–9. [PMC free article] [PubMed] [Google Scholar]
- 22.Folstein MF, Folstein SE, McHugh PR. “Mini-mental state” A practical method for grading the cognitive state of patients for the clinician. J Psychiatr Res. 1975 Nov;12(3):189–98. doi: 10.1016/0022-3956(75)90026-6. [DOI] [PubMed] [Google Scholar]
- 23.Morris JC. The Clinical Dementia Rating (CDR): current version and scoring rules. Neurology. 1993 Nov;43(11):2412–4. doi: 10.1212/wnl.43.11.2412-a. [DOI] [PubMed] [Google Scholar]
- 24.Wechsler D. Wechsler Memory Scale-Revised. New York: Psychological Corporation; 1987. [Google Scholar]
- 25.Kaplan E, Goodglass H, Weintraubb S. The Boston Namiing Test. Philadelphia: Lea & Febiger; 1983. [Google Scholar]
- 26.Benton AL. Multilingual Aphasia Examination. Iowa City: University of Iowa; 1989. K H. Manual. [Google Scholar]
- 27.Wechsler D. Wechsler Adult Intelligence Scale-III. New York: Psychological Corporation; 1997. [Google Scholar]
- 28.Cohen J. Statistical power analysis for the behavioral sciences. 2. New Jersey: Lawrence Erlbaum Associates; 1988. [Google Scholar]
- 29.Sullivan SG, Greenland S. Bayesian regression in SAS software. Int J Epidemiol. 2013 Feb;42(1):308–17. doi: 10.1093/ije/dys213. [DOI] [PubMed] [Google Scholar]
- 30.Agresti A, Coull BA. Approximate is Better than “Exact” for Interval Estimation of Binomial Proportions. The American Statistician. 1998;52(2):119–26. [Google Scholar]
- 31.Bigio EH, Mishra M, Hatanpaa KJ, et al. TDP-43 pathology in primary progressive aphasia and frontotemporal dementia with pathologic Alzheimer disease. Acta Neuropathol. 2010 Jul;120(1):43–54. doi: 10.1007/s00401-010-0681-2. [DOI] [PMC free article] [PubMed] [Google Scholar]
- 32.Josephs KA, Whitwell JL, Duffy JR, et al. Progressive aphasia secondary to Alzheimer disease vs FTLD pathology. Neurology. 2008 Jan 1;70(1):25–34. doi: 10.1212/01.wnl.0000287073.12737.35. [DOI] [PMC free article] [PubMed] [Google Scholar]
- 33.Murray ME, Cannon A, Graff-Radford NR, et al. Differential clinicopathologic and genetic features of late-onset amnestic dementias. Acta Neuropathol. 2014 Sep;128(3):411–21. doi: 10.1007/s00401-014-1302-2. [DOI] [PMC free article] [PubMed] [Google Scholar]
- 34.Nelson PT, Schmitt FA, Lin Y, et al. Hippocampal sclerosis in advanced age: clinical and pathological features. Brain. 2011 May;134(Pt 5):1506–18. doi: 10.1093/brain/awr053. [DOI] [PMC free article] [PubMed] [Google Scholar]
- 35.Nag S, Yu L, Capuano AW, et al. Hippocampal sclerosis and TDP-43 pathology in aging and Alzheimer’s Disease. Ann Neurol. 2015 Feb 23; doi: 10.1002/ana.24388. [DOI] [PMC free article] [PubMed] [Google Scholar]
- 36.Josephs KA, Nelson PT. Unlocking the mysteries of TDP-43. Neurology. 2015 Mar 3;84(9):870–1. doi: 10.1212/WNL.0000000000001322. [DOI] [PubMed] [Google Scholar]
- 37.Jung Y, Dickson DW, Murray ME, et al. TDP-43 in Alzheimer’s disease is not associated with clinical FTLD or Parkinsonism. J Neurol. 2014 Jul;261(7):1344–8. doi: 10.1007/s00415-014-7352-5. [DOI] [PMC free article] [PubMed] [Google Scholar]