Abstract
Purpose
To describe the optical coherence tomography (OCT) angiography features of diabetic retinopathy
Methods
Using a 70kHz OCT and the split-spectrum amplitude decorrelation angiography (SSADA) algorithm, 6 × 6 mm 3-dimensional angiograms of the macula of 4 patients with diabetic retinopathy were obtained and compared with fluorescein angiography (FA) for features catalogued by the Early Treatment of Diabetic Retinopathy Study.
Results
OCT angiography detected enlargement and distortion of the foveal avascular zone, retinal capillary dropout, and pruning of arteriolar branches. Areas of capillary loss obscured by fluorescein leakage on FA were more clearly defined on OCT angiography. Some areas of focal leakage on FA that were thought to be microaneurysms were found to be small tufts of neovascularization that extended above the inner limiting membrane.
Conclusion
OCT angiography does not show leakage, but can better delineate areas of capillary dropout and detect early retinal neovascularization. This new noninvasive angiography technology may be useful for routine surveillance of proliferative and ischemic changes in diabetic retinopathy.
Keywords: Diabetic retinopathy, OCT angiography, en face OCT
Diabetic retinopathy is a microangiopathy that causes capillary occlusion, vascular hyperpermeability, and neovascularization in the retinal vasculature.1 Detailed clinical examination for grading disease severity for risk of progression and vision loss is the standard of care2, but ophthalmic angiography has played a critical role in understanding and care of the disease. Early Treatment of Diabetic Retinopathy Study (ETDRS) examined the fluorescein angiographic features of the posterior pole of patients with non-proliferative diabetic retinopathy and correlated the specific features with their risk of disease progression. 3,4 Fluorescein angiography (FA) is also used to identify retinal neovascularization (RNV) in situations where clinical examination cannot detect RNV or distinguish from other anomalous appearing vessels on the retinal surface.
While angiography provides valuable additional information compared to clinical examination or fundus photography, it is not part of the routine diabetic eye examination. FA requires venipuncture and intravenous injection of a dye that has a moderate risk of nausea and a rare but well documented risk of anaphylaxis and death. 5 Also, a standard protocol FA acquires images over 10 minutes with repeated exposure to a very bright light source, 6 which can cause significant discomfort for patients.
Optical coherence tomography (OCT) angiography, a novel imaging technique that uses decorrelation between resampled images to detect flow to construct 2- and 3-dimensional images of blood flow within the eye, offers an alternative angiographic technique without some of the drawbacks of FA. Our group has developed the split-spectrum amplitude decorrelation algorithm (SSADA) for efficiently detecting flow signals for angiography. 7 Applying this algorithm, an OCT angiogram in areas up to 6 × 6 mm area can be acquired in 3.5 seconds without intravenous injection. This study describes features of diabetic retinopathy as seen on OCT angiography.
Method
Patients were selected from the Retina Division of the Casey Eye Institute for the diagnosis of proliferative diabetic retinopathy, clear media, and the ability to fixate. They underwent comprehensive ophthalmic examination and FA. Three dimensional (3D) OCT angiography scans were acquired over 6 × 6 mm regions using a commercially available 70 kHz OCT (RT-VUE XR, Optivue, Fremont, CA) with a scan pattern of 5 repeated B-scans at 216 raster positions and each B-scan consisting of 216 A-scans. Flow was detected with the highly efficient split-spectrum amplitude decorrelation angiography (SSADA) algorithm7,8 and motion artifact was removed by 3D orthogonal registration and merging of 2 scans. Retinal angiogram was created by projecting the flow signal internal to the Bruch’s membrane in en face orientation. The signal above the internal limiting membrane (ILM) was further segmented to isolate retinal neovascularization. Specific features seen on OCT angiogram were then compared to FA features of the same area. Images were examined for classic features of diabetic retinopathy, such as microaneurysms (MAs) and RNV, as well as angiographic characteristics described by the ETDRS Report No. 11, 4 including foveal avascular zone (FAZ) enlargement and irregularity, capillary drop out, and arteriolar abnormalities.
Patients were enrolled after obtaining an informed consent in accordance with a protocol approved by the Institutional Review Board at Oregon Health & Science University and in compliance with the Declaration of Helsinki.
Results
Four patients with proliferative diabetic retinopathy were imaged for the study. Their characteristics are summarized in Table 1.
Table 1.
Patient Characteristics
| Subject | Age | Gender | DM Type | Imaged Eye | Visual acuity |
|---|---|---|---|---|---|
| 1 | 41 | F | Type 2 | OD | 20/20 |
| 2 | 47 | M | Type 2 | OS | 20/40 |
| 3 | 28 | M | Type 1 | OS | 20/30+2 |
| 4 | 53 | F | Type 1 | OS | 20/50 |
Foveal Avascular Zone Size and Shape
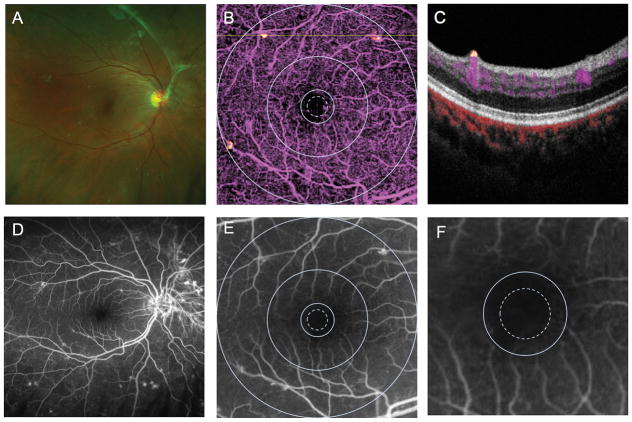
For all eyes imaged, the foveal avascular zone (FAZ) size and shape were gradable according to the ETDRS grading criteria using OCT angiography. The OCT angiogram disclosed the area of perifoveal capillary loss that corresponded well to FA. Figure 1 shows an OCT angiogram with superposed ETDRS grid that shows that the size of the FAZ is between 300 microns radius (dotted circle) and 500 micron (solid inner circle). At the same magnification, it was easier to grade the OCT angiogram for FAZ characteristics than the FA, as the capillaries were seen at a higher contrast on OCT angiogram.
Figure 1.
Right eye of a patient with diabetic retinopathy with wide-field scanning laser ophthalmoscopy color image (A) fluorescein angiogram (FA) (D). Panel B shows a 6 × 6 mm en face optical coherence tomography (OCT) retinal angiogram with ETDRS grid superposed showing FAZ enlargement temporally between the 300 (dotted) and 500 μm diameter circles. Panel C shows a cross sectional OCT angiogram corresponding to the dotted line on Panel B showing a small area of flow signal above the internal limiting membrane in yellow, consistent with neovascular tissue that was not clinically evident. Panels E and F are FA cropped to 6 × 6 mm with ETDRS superposed and a magnified FA showing FAZ enlargement temporally, respectively.
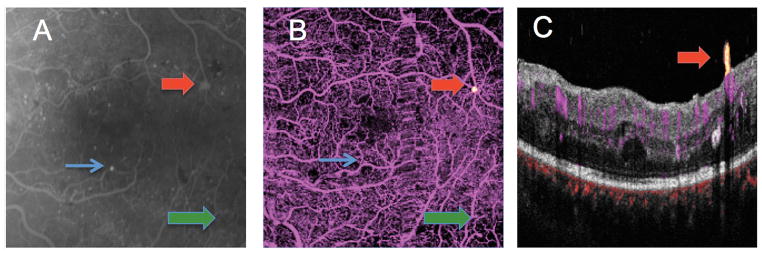
In one case, the foveal avascular zone was difficult to grade on FA as the capillary details were obscured by leakage even in early transit (Figure 2). With the OCT angiography, the details were not affected by leakage and the FAZ size and shape could be easily graded.
Figure 2.

6 × 6 mm macular images from the left eye of a patient with proliferative diabetic retinopathy (A) early frame fluorescein angiogram. Numerous microaneurysms are seen throughout the macula as punctate areas of hyperfluorescence. The green arrow points to an area of intraretinal microvascular abnormality (IRMA). The red arrow points to a small area of hyperfluorescence that leaked mildly in later frames. (B) En face OCT angiogram showing flow signal above the internal limiting membrane (ILM, yellow dot pointed out by red arrow), consistent with a tuft of neovascularization (NV). The area of IRMA was also identified by OCT angiogram (green arrow). The largest microaneurysm on FA (blue arrow) was not identifiable on the OCT angiogram. A vertical strip of blur temporal to the center represents motion artifact (?). (C) Cross-sectional OCT angiogram at the level of the NV (yellow) shows it to be anterior to the ILM. Retinal circulation is colored in magenta and choroidal circulation (below Bruch’s membrane) is colored red. Clinically, this appeared as a microaneurysm.
Capillary Dropout and Arteriolar Characteristics
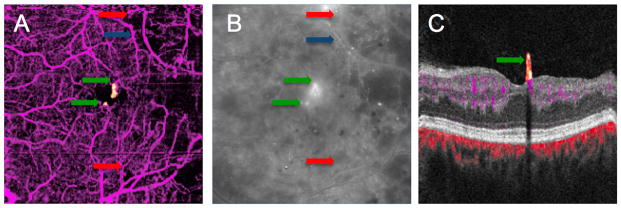
Areas of capillary drop out beyond the FAZ were readily identified with OCT angiogram in all eyes. Figure 3 demonstrates good correlation in the areas of capillary drop out between the OCT angiogram and the FA. In this case, OCT angiography identified additional areas of capillary drop out not seen on FA as early diffuse fluorescein leakage made some areas of capillary dropout indistinguishable from areas with intact capillaries in the FA. In other cases, areas of capillary drop out that were obvious on OCT angiogram were difficult to resolve with FA (Upper right hand corner of Figure 2 is an example.). In this series, OCT angiography was more consistent in demonstrating presence or absence of retinal capillaries than FA.
Figure 3.

OCT angiogram (A) and midphase FA (B) of a diabetic patient discloses areas of capillary dropout in the temporal macula with pruning of the arterioles. In the FA, diffuse leakage obscures an area of capillary drop out seen on OCT angiography (red arrows). An arteriole with wall staining (blue arrow) in the FA is shown to be a barely visible ghost vessel on OCT angiography. Focal areas of leakage near the fovea thought to be large microaneurysms on FA were shown to be NV on OCT angiography (green arrows).
An area of intraretinal microvascular abnormality (IRMA), characterized by dilated terminal vessels surrounded by an area of capillary loss was identified with OCT angiography as well as FA. The exact shape of the IRMA differed slightly between two images (Figure 2). Arteriolar narrowing and wall staining seen on FA was seen as extreme attenuation of vessel caliber on OCT angiography (Figure 3).
Microaneurysms and Neovascularization
OCT angiography with 6 × 6 mm field of view could not identify microaneurysms seen on the FA. (Figure 2). On the FA of one patient, areas of focal hyperfluorescence with leakage in the perifoveal area that were thought to be large microaneurysms were determined to be small tufts of neovascularization on OCT angiography. (Figure 3) With the segmentation of the flow signal at the level of the ILM and projecting the signal in the cross sectional orientation, it was evident that these lesions were vertical RNV protruding into the vitreous (Figures 1, 2, and 3). Clinically, these lesions appeared like microaneurysms.
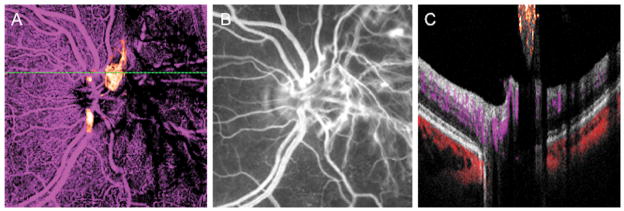
While RNV close to the ILM were readily identified, flow signal from the vessels that were highly elevated from the retinal surface displayed as shadows rather than flow signals because the most elevated portion of RNV outside the depth range of OCT imaging (Figure 4).
Figure 4.

A left eye with neovascularization of the disc (NVD). (A) En face OCT angiogram discloses flow in the abnormal vessels above the disc. The NVD was cropped outside of the OCT scan volume nasal to the disc and is seen as shadows rather than flow. (B) NVD is clearly seen on FA. Clinically the NVD appeared elevated above the retinal surface. (C) A cross-sectional OCT angiogram through the area of the NVD shows flow signal (orange) in the neovascular tissue that is close to the retinal surface. Further nasally, similar shadowing seen in panel A is displayed in cross section.
Features described in ETDRS that are inherently specific to fluorescein angiography and unlikely to have correlates in OCT angiography, such as retinal pigment epithelial defects, severity of late fluorescein leakage and determining their source were not evaluated for this study.
Discussion
OCT angiography can identify FAZ enlargement and irregularity, as well areas of capillary drop out. Kim et al. has demonstrated FAZ using 1.5 × 1.5 mm central foveal scan9 and Schwartz et al. demonstrated capillary drop out in a diabetic patient also using a 3 × 3 mm scan. 10 This is the first demonstration macular microvasculature in diabetic retinopathy using a larger 6 × 6 mm OCT angiogram. Unlike the FA, where capillary details are best seen in the transit phase, and thus cannot always provide reliable details of the FAZ of both eyes, 11 OCT angiography, not dependent on a dye injection, can potentially provide equally clear capillary details of both eyes. Diffuse fluorescein leakage from the choroidal and retinal circulation, microaneurysms and neovascularization that can obscure capillary details in an FA do not obscure those details in OCT angiography. Furthermore, the relative difficulty in resolving capillary details in lightly pigmented fundi do not pose a challenge in OCT angiography as the separation of the choroidal flush from the retinal circulation is not dependent on the degree of blocking of posterior fluorescence by the retinal pigmented epithelium. In this small series, OCT angiography was more consistent than FA in demonstrating capillary details.
Detection of retinal neovascularization on an FA depends on identifying characteristic vessels with profuse leakage in the later frames. With OCT angiography, RNV is detected by observing flow signal above the internal limiting membrane (ILM). We were able to identify lesions on FA that appeared indistinguishable from a microaneurysm to be RNV using OCT angiography, as the new vessels appeared as a punctate area hyperfluorescence with leakage. Understanding that FA does not always identify all NV may explain why some diabetics with vitreous hemorrhage do not have a definitely identified NV on their FA.
A limitation of OCT angiography is its small field of view. The largest view available currently (6 × 6 mm) is still significantly smaller than the standard photographic field (~ 20 degrees vs. 30 degrees in standard photographic field). The difference is more dramatic when compared to ultra wide-field angiography. Studies have suggested that ultra wide-field angiography may be more helpful in classifying diabetic retinopathy as more pathology is revealed compared to classic 7 ETDRS fields.12 Certainly, a wider field of view would increase the sensitivity of detecting neovascularization and reveal additional areas of capillary nonperfusion. 13 But a carefully graded FA involving only the standard fields 1 and 2 has been shown to valuable in assessing the risk of progression of disease, and the assessment of microvasculopathy in the posterior pole may still be useful. 3 The depth range of OCT imaging is a limitation as well because highly elevated RNV could be cropped and present as shadow rather than flow. These limitations could be eased in the future by the use of faster OCT technology and deeper range of imaging.
With the 6 × 6 mm OCT angiogram, it was difficult to identify microaneurysms. Higher resolution but smaller field (3 × 3 mm) OCT angiograms can identify some microaneurysms, but not reliably. 10 This difficulty is likely due to relatively low flow in microaneurysms and relatively low scan density used in OCT angiography. Identification of microaneursyms on angiogram may not have value in predicting the risk of progression, but their identification is a part of standard of care focal laser treatment for diabetic macular edema. 14,15 Identifying all leaking microaneurysms within 3000 microns from the center of the macula and treating those is a part of the standard protocol in treatment of diabetic macular edema, which requires at the minimal 6 × 6 mm field of view. With the arrival of anti-vascular endothelial growth factor therapy and demonstration of their superiority to focal laser therapy for center involving edema, 16 the indication for focal laser therapy as primary treatment for diabetic macular edema has narrowed. However, at the present, OCT angiography cannot replace the FA for the purpose of focal laser photocoagulation planning.
Other vascular features, such as arteriolar wall staining and intraretinal vascular abnormalities had divergent appearances on OCT angiography and FA. These differences, as well as the difficulty of identifying microaneurysms, is demonstrative of the fundamental difference in how the two technologies derive their signal for detection. The contrast in FA depends on the presence of dye, not on their movement. Therefore the pathology that causes accumulation of dye, such as a microaneurysm, is displayed with greater clarity. In OCT angiography, the contrast depends on movement or flow. Thus certain fluorescein angiographic features such as staining and leakage have no direct equivalence in OCT angiography. However, even in this small study, it is evident that the lack of leakage and staining is both a disadvantage and an advantage as it allows OCT angiography to detect features that could be obscured by leakage in FA. More study is needed to understand the value of these differences in everyday clinical settings.
While this study demonstrated that OCT angiography can detect many of the features of diabetic retinopathy seen on FA, the small number of patients and limited range of severity of disease makes it difficult to make conclusions about sensitivity or specificity of OCT angiography. Furthermore, the current technology has relatively low resolution (216 × 216 over 6 × 6 mm area), which yields pixel sizes that are larger than the capillary width. This makes comparison of the current generation of OCT angiogram to the standard photographs used in ETDRS Report No. 11 difficult, as the report used highly magnified views to examine capillary details. Consequently, rigorous qualitative grading of severity of retinopathy features using the ETDRS standards, with the possible exception of FAZ size and shape, is not possible with the current technology.
In summary, this study demonstrates the OCT angiographic features of diabetic retinopathy. Its rapid acquisition time, the absence of need for an intravenous dye, identification of small neovascular tufts and areas of capillary dropout not obscured by leakage are some of the advantages over fluorescein angiography. These advantages may make this technology useful for routine surveillance of diabetic retinopathy. Its current limitations are the small field of view, relatively low resolution, and difficulty in identification of microaneurysms over a large area.
Table 2.
Optical Coherence Tomography Angiographic Findings
| Subject | FAZ Size (μ) | Outline of FAZ | Capillary Drop Out | Neovascularization and Other Vascular Abnormalities | Figure |
|---|---|---|---|---|---|
| 1 | 300–500 | More than half | Central | Extensive NVD, small tufts of NVE along temporal arcades | 1, 4 |
| 2 | < 300 | Questionable | Superotemporal and inferotemporal | Isolated NVE temporally, IRMA infratemporally | 2 |
| 3 | 300–500 | Less than half | Central, and extensive loss throughout temporal macula | Perifoveal NVE and NVD (not shown) Arteriolar pruning temporally Arteriolar narrowing and staining superiorly |
3 |
| 4 | 300–500 | More than half | Central, superotemporal and inferotemporal | Extensive NVD, NVE inferiorly |
FAZ = foveal avascular zone, NVE = neovascularization elsewhere, IRMA = intraretinal microvascular abnormality, NVD = neovascularization at the disc
Summary Statement.
Optical coherence tomography angiography demonstrates neovascularization and capillary abnormalities critical in the management of diabetic retinopathy and shows promise as a dye-free alternative to fluorescein angiography.
Acknowledgments
Funding Support:
NIH: DP3 DK104397 and T32 EY23211
Others:
Research to Prevent Blindness
Oregon Clinical and Translational Research UL1TR000128
Footnotes
Meeting Presentation: The American Academy of Ophthalmology Annual Meeting, Chicago, Illinois, November 2014
The sponsor or funding organization had no role in the design or conduct of this research.
Financial Disclosure: David Huang, Carl Zeiss Meditec, Inc. (P), Optovue, Inc (F, I, P), Yali Jia, Optovue, Inc. (F, P), Andreas K. Lauer, Oxford Biomedica (C)
References
- 1.Antonetti D, Klein R, Gardner TW. Diabetic retinopathy. N Engl J Med. 2012;366(13):1227–1239. doi: 10.1056/NEJMra1005073. [DOI] [PubMed] [Google Scholar]
- 2.American Academy of Ophthalmology Retinal/Vitreous Panel. Preferred Practice Pattern Guidelines. Diabetic Retinopathy. San Francisco, CA: American Academy of Ophthalmology; 2014. pp. 1–65. Available at: www.aao.org/ppp. [Google Scholar]
- 3.Early Treatment Diabetic Retinopathy Study Research Group. Fluorescein Angiographic Risk Factors for Progression. Ophthalmology. 1991;98(Supplement):834–840. doi: 10.1016/S0161-6420(13)38015-4. [DOI] [PubMed] [Google Scholar]
- 4.Early Treatment Diabetic Retinopathy Study Research Group. Classification of Diabetic Retinopathy from Fluorescein Angiograms: ETDRS Report Number 11. Ophthalmology. 1991;98(Supplement):807–822. doi: 10.1016/S0161-6420(13)38013-0. [DOI] [PubMed] [Google Scholar]
- 5.Bloome MA. Fluorescein angiography: risks. Vision Res. 1980;20(12):1083–1097. doi: 10.1016/0042-6989(80)90045-0. [DOI] [PubMed] [Google Scholar]
- 6.University of Wisconsin Fundus Photograph Reading Center. Standard Fluorescein Angiography (FA-D) 2012. pp. 1–10. [Google Scholar]
- 7.Jia Y, Tan O, Tokayer J, et al. Split-spectrum amplitude-decorrelation angiography with optical coherence tomography. Opt Express. 2012;20(4):4710–4725. doi: 10.1364/OE.20.004710. [DOI] [PMC free article] [PubMed] [Google Scholar]
- 8.Jia Y, Bailey ST, Wilson DJ, et al. Quantitative optical coherence tomography angiography of choroidal neovascularization in age-related macular degeneration. Ophthalmology. 2014;121(7):1435–1444. doi: 10.1016/j.ophtha.2014.01.034. [DOI] [PMC free article] [PubMed] [Google Scholar]
- 9.Kim DY, Fingler J, Zawadzki RJ, et al. Noninvasive imaging of the foveal avascular zone with high-speed, phase-variance optical coherence tomography. Investigative Ophthalmology & Visual Science. 2012;53(1):85–92. doi: 10.1167/iovs.11-8249. [DOI] [PMC free article] [PubMed] [Google Scholar]
- 10.Schwartz DM, Fingler J, Kim DY, et al. Phase-variance optical coherence tomography: a technique for noninvasive angiography. Ophthalmology. 2014;121(1):180–187. doi: 10.1016/j.ophtha.2013.09.002. [DOI] [PMC free article] [PubMed] [Google Scholar]
- 11.Mansour AM, Schachat A, Bodiford G, Haymond R. Foveal avascular zone in diabetes mellitus. Retina. 1993;13(2):125–128. doi: 10.1097/00006982-199313020-00006. [DOI] [PubMed] [Google Scholar]
- 12.Wessel MM, Aaker GD, Parlitsis G, Cho M, D’Amico DJ, Kiss S. Ultra-wide-field angiography improves the detection and classification of diabetic retinopathy. Retina. 2012;32(4):785–791. doi: 10.1097/IAE.0b013e3182278b64. [DOI] [PubMed] [Google Scholar]
- 13.Kim DY, Kim J-G, Kim YJ, Joe SG, Lee JY. Ultra-widefield fluorescein angiographic findings in patients with recurrent vitreous hemorrhage after diabetic vitrectomy. Investigative Ophthalmology & Visual Science. 2014;55(11):7040–7046. doi: 10.1167/iovs.14-15112. [DOI] [PubMed] [Google Scholar]
- 14.Diabetic Retinopathy Clinical Research Network. A randomized trial comparing intravitreal triamcinolone acetonide and focal/grid photocoagulation for diabetic macular edema. Ophthalmology. 2008;115(9):1447–9. 1449.e1–10. doi: 10.1016/j.ophtha.2008.06.015. [DOI] [PMC free article] [PubMed] [Google Scholar]
- 15.Kylstra JA, Brown JC, Jaffe GJ, et al. The importance of fluorescein angiography in planning laser treatment of diabetic macular edema. Ophthalmology. 1999;106(11):2068–2073. doi: 10.1016/S0161-6420(99)90485-2. [DOI] [PubMed] [Google Scholar]
- 16.Elman MJ, Aiello LP, Beck RWR, et al. Randomized Trial Evaluating Ranibizumab Plus Prompt or Deferred Laser or Triamcinolone Plus Prompt Laser for Diabetic Macular Edema. Ophthalmology. 2010;117(6):1064–1077. e35. doi: 10.1016/j.ophtha.2010.02.031. [DOI] [PMC free article] [PubMed] [Google Scholar]


