

Abstract
Amino acid analysis is a powerful bioanalytical technique for many biomedical research endeavors, including cancer, emergency medicine, nutrition and neuroscience research. In the present study, we present a three minute analytical method for underivatized amino acid analysis that employs ultra-high performance liquid chromatography and high resolution quadrupole orbitrap mass spectrometry. This method has demonstrated linearity (mM to nM range), reproducibility (intra-day<5%, inter-day<20%), sensitivity (low fmol) and selectivity. Here, we illustrate the rapidity and accuracy of the method through comparison with conventional liquid chromatography-mass spectrometry methods. We further demonstrate the robustness and sensitivity of this method on a diverse range of biological matrices. Using this method we were able to selectively discriminate murine pancreatic cancer cells with and without knocked down expression of Hypoxia Inducible Factor 1α; plasma, lymph and bronchioalveolar lavage fluid samples from control versus hemorrhaged rats; and muscle tissue samples harvested from rats subjected to both low fat and high fat diets. Furthermore, we were able to exploit the sensitivity of the method to detect and quantify the release of glutamate from sparsely isolated murine taste buds. Spiked in light or heavy standards (13C6-arginine, 13C6-lysine, 13C515N2-glutamine) or xenometabolites were used to determine coefficient of variations, confirm linearity of relative quantitation in four different matrices, and overcome matrix effects for absolute quantitation. The presented method enables high-throughput analysis of low abundance samples requiring only one percent of the material extracted from 100,000 cells, 10 μl of biological fluid, or 2 mg of muscle tissue.
Keywords: QExactive, biofluid, cell extract, tissue extract, amino acids, mass spectrometry, PLS-DA
Introduction
Amino acid analysis is a critical research endeavor that has attracted a great deal of interest since the late 1950's when Stein and Moore established an analytical workflow to detect and quantify amino acid mixtures from protein hydrolysates (Manning 1993). While historically employed to determine amino acid composition of proteins and peptides, this technique has recently seen expanded utility resulting from the increasingly documented connections between amino acid metabolism and biological responses. In cancer research, for example, glutamine (Cardaci and Ciriolo 2012), serine (D'Alessandro and Zolla 2013), glycine (Amelio et al. 2014) and tryptophan metabolism (Platten et al. 2012) now represent novel targets for drug therapeutics. Additionally, stem cells feed on threonine to promote energy metabolism and mediate epigenetic regulatory post-translational modifications of histones (Chen and Wang 2014), thus providing additional areas for therapeutic intervention. In the fields of transfusion medicine and red blood cell storage, glutamine, glutamate and cysteine are emerging as potential contributors to age-dependent impairments in anti-oxidant potential (Droge 2005) and the accumulation of storage lesions in the blood bank (D'Alessandro et al. 2015a). In the field of neurobiology, glutamate, tryptophan, and tyrosine can directly mediate stress responses such as ischemia/reperfusion injury and mood disorders (D'Alessandro et al. 2014b) since they are precursors to γ-aminobutyric acid, serotonin/melatonin and catecholamines. In the field of food science, glutamate has been associated with the umami taste and improved sensory appreciation of meat and beverages (Yamaguchi and Ninomiya 2000). Examples of the connections between amino acid metabolism and biological responses are therefore both plentiful and diverse.
A long list of methods for amino acid analysis have been published over the last fifty years (Rutherfurd and Gilani 2009). The technique was pioneered by Moore et al. (Moore et al. 1958), with the original iteration achieving amino acid separation on a sulfonated cation-exchange resin. The separated amino acids were then detected by calorimetry using a post-column reaction with ninhydrin. More recent methods rely upon reversed-phase derivatization through different approaches, such as the use of phenylisothiocyanate (Heinrikson and Meredith 1984), ion chromatography coupled with post-column derivatization that uses ninhydrin(Bidlingmeyer et al. 1984), fluorescamine (Stein et al. 1973), or o-phthalaldehyde/2-mercaptoethanol (Benson and Hare 1975; Dorresteijn et al. 1996), or cation-exchange solid-phase extraction followed by propyl chloroformate derivatization and analysis by gas chromatography/mass spectrometry (GC/MS)(Kaspar et al. 2008; Badawy 2012). Alternatively, pre-column derivatization methods have been proposed through the use of o-phthaldialdehyde, 9-fluorenylmethyl chloroformate, phenyl isothiocyanate, 1-dimethylaminonaphthalene-5-sulphonyl chloride (dansyl-chloride), N-alkylnicotinic acid, 3-aminopyridyl-N-hydroxysuccinimidyl carbamate or N-hydroxysuccinimide (Fürst et al. 1990; Yang et al. 2006; Shimbo et al. 2009).
Recent improvements in capillary electrophoresis, high performance liquid chromatography (HPLC), and mass spectrometry (MS) technologies have revolutionized the field of metabolomics, consequently providing oppotunities for the development of derivatization-free amino acid analysis (Armstrong et al. 2007; Hirayama and Soga 2012). These methods make use of the improved chromatographic selectivity of sub 2 μm resin particles that offer increased surface area to volume ratios (Armstrong et al. 2007), and reversed-phase ion-pairing chromatography by perfluorinated carboxylic acids (Piraud et al. 2005). In parallel, advances in mass spectrometry technologies now provide enhanced sensitivity down to the low nM range for small molecules, primarily due to the use of such targeted approaches as multiple reaction monitoring (MRM) available on triple quadrupole (Piraud et al. 2005) and ion trap mass analyzers (D'Alessandro et al. 2011), and hybrid quadrupole time of flight (TOF) or Orbitrap mass analyzers.
While these methods are simple, selective, and sensitive, they often rely on sample preparation kits that require amino acid derivatization and subsequent analysis by GC/MS and LC/MS in 6, 10 and 15 mins (Kaspar et al. 2008; Shimbo et al. 2009; Badawy 2012; Salazar et al. 2012). Despite increasing the time and effort required for sample preparation, chemical derivatization makes amino acid assignment and quantitation down to the μM level amenable to routine analysis. Additional LC/MS methods for the detection of underivatized amino acids have been described that rely on 12 to 15 min analytical times and multiple reaction monitoring (MRM) for amino acid detection ((Thiele et al. 2012; Zhou et al. 2013; Yao et al. 2013; Buiarelli et al. 2013; Le et al. 2014)).
Although automated sample preparation and derivatization of biofluid extracts improves efficiency, analytical run time is a critical factor for translational applications of amino acid analysis such as clinical biochemistry (D'Alessandro et al. 2012b) and drug development (D'Alessandro and Zolla 2013). In the present study, we have harnessed the improved resolving power of ultra-high performance liquid chromatography (UHPLC) to optimize a highly sensitive three minute method for amino acid analysis (3AA). Such method is enhanced by both the chromatographic selectivity of 1.7 μm C18 particles and accurate intact mass determination within a sub 5 ppm range of error using a hybrid quadrupole Orbitrap mass spectrometer. This method has demonstrated linearity (mM to nM range), reproducibility (intra-day < 5%, inter-day <20%), sensitivity (down to the nM level) and selectivity using commercially available underivatized standards. Although this method is affected by matrix composition, linearity and reproducibility of relative and absolute quantitation are not compromised, as demonstrated in four different matrices of clinical relevance (red blood cells, plasma, bronchioalveolar lavage fluid and mesenteric lymph) by spiked in supplementation of light and heavy standards (13C6-arginine, 13C6-lysine, 13C515N2-glutamine) or xenometabolites (5-fluorouracil) at different concentrations. Furthermore, this method is quite robust and has been successfully employed to analyze amino acid content in different biological matrices including biofluids, cell extracts, and tissue extracts. Briefly, we provide evidence to support the utility of accurate amino acid quantitation in biological matrices as a high throughput discovery mode analysis aimed at rapidly discriminating phenotypes through unsupervised statistical analyses such as Principal Component Analysis (PCA).
Materials and Methods
Sample preparation
Biofluids
Rat plasma samples were kindly provided by Drs. Hunter Moore and Anthony W. Bacon (University of Colorado Denver). Briefly Trauma was induced in Sprague Dawley rats through laparotomy and bowel crush, as previously reported (D'Alessandro et al. 2015b). Sham shock (SS – no hemorrhage) or hemorrhagic shock (HS) was induced by controlled hemorrhage until rat achieves mean arterial pressure (MAP) equal to 25 mm Hg (MAP 25). Matched plasma, mesenteric lymph and bronchioalveolar lavage fluid (BALF) samples (100 μl) were collected before (pre) and immediately after 30 mins of trauma/hemorrhagic shock (at MAP 25) (post), either in presence or absence of mesenteric lymph diversion (MLD). Ten μl of each plasma were extracted in 490 μl of ice cold extraction buffer (methanol:acetonitrile:water 5:3:2 v/v), vortexed for 10 mins at 4 °C. Proteins and lipids were subsequently pelleted through centrifugation for 10 mins at 10,000g at 4°C and supernatants collected for subsequent analysis.
Taste bud releasates were kindly provided by Dr. Aurelie Vandenbeuch (University of Colorado Denver). Samples were harvested from isolated mouse tongue epithelium cells stimulated in vitro with KCl in PBS buffer, as previously reported (Vandenbeuch et al. 2010).
Cell extracts
Pancreatic cancer (Panc-1) cells (107 cells, biological triplicates) were kindly provided by Dr. Agnieszka Kendrick (University of Colorado, Denver). Cells were grown in DMEM, 10% fetal bovine serum, 1% pennycilin/streptomcyin, 1% non-essential amino acids and harvested at 90% confluence in 60 mm dishes.
Murine Pan02 pancreatic adenocarcinoma cancer cells and shHIF1α knock downs were kindly provided by Dr. Jeniann Yi (University of Colorado Denver – CO, USA). The Pan02 murine pancreas adenocarcinoma cell line (National Cancer Institute, Bethesda, MD) was modified using short-hairpin RNA targeting the HIF1α gene (Sigma Aldrich) via lentiviral transduction to create Pan02-SH+ cells lacking HIF1α activity. Cells were cultured in RPMI + 10% FBS and 1% penicillin/streptomycin (Cellgro) to 50% confluence, then exposed to the shRNA/lentiviral particles. Transduced cells were selected using puromycin at a concentration of 3 ug/ml. Successful knockdown of HIF1α activity using two distinct vectors confirmed using real-time polymerase chain reaction (RT-PCR) at both room temperature and simulated hypoxia. Five biological replicates were obtained for wild-type or shHIF1α (two different clones, hereby referred to as shHIF1 and shHIF2) with cell counts as low as 3.7×10⁵.
All cell pellets were stored at -80°C and were extracted immediately before analysis in ice-cold lysis/extraction buffer (methanol:acetonitrile:water 5:3:2 v/v) at a ratio of 2×10⁶ cells/ml (Maddocks et al. 2013; D'Alessandro et al. 2014a). Samples were then agitated at 4°C for 30 mins and centrifuged at 10,000g for 10 mins at 4°C. Protein and lipid pellets were discarded, while supernatants were stored at -80°C prior to analyses.
Tissue extracts
Five mg of tissue biopsies were obtained from Drs. Bryan Bergman, Sean Newsom (University of Colorado Denver – CO, USA) and Drs. Gregory D. Cartee and Carlos M. Castorena (University of Michigan). Animals used in this study were part of a larger, recently published investigation (Castorena et al. 2014). All procedures for animal care were approved by the University of Michigan Committee on Use and Care of Animals. Eight week old male Wistar rats (initial body weight ∼200-250g; Harlan, Indianapolis, IN) were individually housed and provided with standard rodent chow (Low Fat Diet; LFD: 14% kcal fat, 58% kcal carbohydrate, 28% kcal protein; Lab Diet no. 5001, PMI Nutritional International, Brentwood, MO) or high fat diet [HFD: 60% kcal fat, 20% kcal carbohydrate, 20% kcal protein; Research Diets (D12492), New Brunswick, NJ] and water ad libitum for 2wk. Rats were fasted at ∼1900h on the night before the terminal experiment. At ∼12:00h the next day, fasted animals (for ∼17h) from both groups were anesthetized(Castorena et al. 2014), and tissues were harvested and then immediately frozen in liquid N2. Frozen skeletal muscle samples were weighed (5 mg) and homogenized in 1 ml of ice cold extraction buffer (methanol:acetonitrile:water 5:3:2 v/v) for 2 mins at 30 Hz in TissueLyser (QIAGEN -Valencia, CA, USA). Homogenized samples were vortexed for 30 mins at 4°C. Samples were then centrifuged for 10 mins at 10,000g at 4°C. The supernatants were then collected for the analysis, while Bradford assays were performed on the pellets, as to determine the comparability of the extracted samples and eventually normalize results on protein concentrations.
Amino acid standard characterization
To determine linearity and sensitivity of the approach, we weighed and progressively diluted down to the nM level a subset of amino acid standards, including commercially available L-glutamic acid, and glycine (49621, G8898, - SIGMA Aldrich, St. Louis, MO, USA), MSMLS standard compound library (IROATech, Bolton, MA, USA) and EZ faast amino acid standards (Standard dilution SD1, SD2, SD3 - AG0-7184 – Phenomenex, Torrance, CA, USA). A total of thirty five different amino acids were tested using commercially available standards (SD1, SD2, SD3 – Phenomenex, Torrance, CA, USA). To determine reproducibility of the approach, we diluted the SD1 mixture a final concentration of 50 nM for each amino acid with 18 mΩ H2O and analyzed 10 μl injections five consecutive times. To validate separation of L-leucine and L-isoleucine, 99% pure amino acids were weighed and used to prepare standard solutions of 1 μM (L0029 – TCI America, Portland, OR, USA, 166170050 – Acros Organics, New Jersey, USA). Leu and Ile standards were thus analyzed both independently and as a 1:1 mixture. To test retention time reproducibility against standards, samples were either dried under vacuum and resuspended in water or directly analyzed in the lysis/extraction buffer.
One to ten μl of standards at different concentrations, 5 μl of biofluid (either plasma or taste bud releasates), 20 μl of cell, or 10 μl of tissue extracts were injected into a UHPLC system (Ultimate 3000, Thermo, San Jose, CA, USA) and separated through a 3 min isocratic elution on a Kinetex XB-C18 column (150 × 2.1 mm i.d., 1.7 μm particle size – Phenomenex, Torrance, CA, USA) at 250 μl/min (mobile phase: 5% acetonitrile, 95% 18 mΩ H2O, 0.1% formic acid; column temperature: 25°C).
Comparison against two conventional metabolomics methods
Technical consistency (i.e. reproducibility and linearity) of the 3AA method was compared to two conventional chromatographic separations used for small molecule and amino acid analyses. Pancreatic cancer cell extracts (biological triplicates) either undiluted or diluted five-fold, were analyzed using (i) the 3AA method, as well as (ii) a 15 min gradient on a Kinetex HILIC column (150 × 2.1 mm i.d., 1.7 μm particle size – Phenomenex, Torrance, CA, USA) and (iii) a 23 min gradient on an Acquity UHPLC BEH Amide Column (2.1×100 mm, 1.7μm – Waters, Milford, MA, USA). In (ii), samples were analyzed on the Kinetex HILIC at 350 μl/min (mobile phases: A: ACN; B: 18 mΩ H2O, 20 mM (NH4)2CO3, 0.1% NH4OH; gradient: 1.5 min hold at 5% B; 5-60% B in 8.5 min; 60-95% B in 0.5 min at 0.5 ml/min; 95% hold for 2 min; 95-5% B in 0.5 min; 5 hold for 2 min; column temperature: 25°C). In (iii), samples were analyzed on the Acquity UHPLC BEH Amide Column (2.1×100 mm, 1.7μm – Waters, Milford, MA, USA) at 500 μl/min (mobile phases: A: 18 mΩ H2O, 20 mM (NH4)2CO3 pH 4.00; B: acetonitrile; gradient: 3 min hold 85% B; 85-30% B in 9 min; 30-2% B in 3 min; 2-85% of B in 1 min; 85% equilibration for 7 min; column temperature: 60°C).
The UHPLC system was coupled online with a QExactive mass spectrometer (Thermo, San Jose, CA, USA), scanning in Full MS mode (2 μscans) at 70,000 resolution from 60-900 m/z, with 4 kV spray voltage, 15 sheath gas and 5 auxiliary gas, operated in positive ion mode. Calibration was performed before each analysis using a positive calibration mix (Piercenet – Thermo Fisher, Rockford, IL, USA). Limits of detection (LOD) were characterized by determining the smallest injected amino acid amount required to provide a signal to noise (S/N) ratio greater than three using < 5 ppm error on the accurate intact mass. Based on a conservative definition for Limit of Quantitation (LOQ), these values were calculated to be three fold higher than determined LODs.
MS data acquired from the QExactive was converted from .raw file format to.mzXML format using MassMatrix (Cleveland, OH, USA). Amino acid assignments were performed using MAVEN (Princeton, NJ, USA). The MAVEN software platform provides tools for peak picking, feature detection and metabolite assignment against the KEGG pathway database. Assignments were further confirmed using a process for chemical formula determination using isotopic patterns and accurate intact mass (Clasquin et al. 2012). Analyte retention times were confirmed by comparison with external standard retention times, as indicated above.
Relative quantitation was performed by exporting integrated peak areas values into Excel (Microsoft, Redmond, CA, USA) for statistical analysis including T-Test and ANOVA (significance threshold for p-values < 0.05) and unsupervised Principal Component Analysis (PCA) (Pan et al. 2007; Fonville et al. 2010), calculated through the MultiBase macro (freely available at www.NumericalDynamics.com).
Matrix effects: spiked in standards at different concentrations
The effect of matrix-dependent ion suppression was tested by injecting the amino acid standards (SD1) at different amounts (0.5, 2.5 and 5 pmol injected), either alone or as incremental additions to a complex matrix of three freshly withdrawn packed red blood cell extracts. Briefly, whole blood was collected kindly donated by three healthy donor volunteers, in compliance with the declaration of Helsinki, and red blood cells were sorted from plasma and buffy coat through centrifugation (1500 g × 10 min at 4°C). Additionally, to further test intra-day reproducibility of sample processing, analytical runs, and coefficients of variation (CV - standard deviation/mean) for relative quantitation, a xenometabolite (5-fluorouracil - F6627 SIGMA Aldrich, St. Louis, MO, USA) was added to the lysis buffer used to extract the same samples at a final concentration of 25 μM.
Absolute quantitation using heavy labeled amino acids
To overcome matrix effects and achieve absolute quantitation, three heavy labeled amino acid standards (13C6-arginine, 13C6-lysine, 13C515N2 –glutamine – 99 atom% 13C; 95% compound purity - SIGMA Aldrich, St. Louise, MO, USA) were spiked in in the lysis/extraction buffer at a final concentration of 10 μM. This supplemented buffer was used to extract matched plasma, BALF, and mesenteric lymph from control, trauma sham shock (T/SS) or hemorrhagic shock (T/HS) rats prior to or after shock, in presence or absence of MLD, as described above. Each condition contained two biological replicates and a 1:1 ratio of the replicates at each time point. Peak areas for heavy labeled standards in each sample were used to calculate inter-run CVs.
To demonstrate linearity of this approach, an additional 1:1 biological replicate ratio was prepared with heavy labeled standards added to a final concentration of 20 μM. Ratios of heavy labeled standard peak areas from the 1:1 ratio with either 10 or 20 μM standards were used to calculate linearity of quantitation and CVs of fold changes (expected fold change values = 2.00).
Heavy to light isotopologue ratios for each one of the three amino acid standards were used to determine absolute quantities of arginine, lysine, and glutamine in the two biological replicates, as well as the 1:1 mixture (with a conversion factor of either 10 or 20 μM, depending on the concentration of the heavy labeled standards).
Results and discussion
Selectivity, linearity, sensitivity and reproducibility of the approach
In Figure and Table 1, we report an overview of retention times for 32 representative basic (blue), acidic (red), neutral (yellow), aromatic (pink), imino (light blue) and non-essential (green) amino acids along the three min isocratic run. While extracted ion chromatograms (XIC) for a representative class of amino acids are depicted in Figure 1, XICs for the entire set of profiled amino acids are depicted in Supplementary Figure 1. Basic and neutral amino acids were weakly retained by the column, with basic amino acids eluting within a 10 s time window around the first min of the elution. Neutral and acidic amino acids eluted from 1.10 to 1.80 mins, and aromatic compounds eluted near the end of the run (2.8 to 2.9 mins). Mean peak width was 3 s for most amino acids, while approximately 6-8 s for basic amino acids. Narrow peak width resulting from the isocratic elution increased the signal to baseline ratios, thereby LOD and LOQ in comparison to the 15 min HILIC and 23 min Amide HILIC analysis. Selectivity of the approach is further demonstrated by the ability to independently identify both leucine and isoleucine with baseline separation using both commercially available standard mix and single standards (Figure 1 and 2, Table 1), even though separation of alloisoleucine was not achieved. Other isobaric compounds could be independently resolved including 4-aminobutanoate and L-amino-isobutanoate, sarcosine and alanine (unique retention times indicated in Table 1), providing additional supporting evidence of the specificity of the approach. Accurate intact mass enabled assignment and quantitation of co-eluting amino acids (Table 1). Reproducibility of the approach is illustrated by the CV for each amino acid measured though five consecutive analyses of SD1 (500 fmol injections - Supplementary Table 1). CV was lower than 5% for every amino acid (3.92 ± 0.01%) with the exception of L-alanine (6.81%) (Supplementary Table 1). Inter-day variability, calculated using three injections of SD1on three consecutive days, resulted in CVs <20% (13.7 + 10.8% - Supplementary Table 2).
Table 1. Amino Acid standards.
| # | Mix | Compound | KEGG Cmpd ID | Parent Ion | Accuracy (ppm) | Median Rt | Log LIN | R2 | LOQ | LOD |
|---|---|---|---|---|---|---|---|---|---|---|
| 1 | SD1 | L-2-Aminoadipate | C00956 | 162.0761 | 0.5 | 1.26 | 4 | 0.99 | 750 fmol | 250 fmol |
| 2 | SD1 | L-Alanine | C00041 | 90.0555 | 5 | 1.30 | 4 | 0.96 | 300 fmol | 100 fmol |
| 3 | SD1 | L-Arginine | C00062 | 175.1190 | 0.5 | 1.10 | 4 | 0.96 | 75 fmol | 25 fmol |
| 4 | SD1 | L-Aspartate | C00049 | 134.0446 | 1.25 | 1.30 | 5 | 1.00 | 7.5 pmol | 2.5 pmol |
| 5 | SD1 | L-3-Amino-isobutanoate | C03284 | 104.0711 | 3.5 | 1.18 | 4 | 0.97 | 4.5 pmol | 1.5 pmol |
| 6 | SD1 | L-Cysteine | C00097 | 122.0271 | 1 | 1.26 | 3 | 0.99 | <1 fmol | < 1 fmol |
| 7 | SD1 | L-Cystine | C00491 | 241.0311 | 0.6 | 1.16 | 4 | 0.98 | <1 fmol | < 1 fmol |
| 8 | SD1 | L-Citrulline | C00327 | 174.0874 | 0.35 | 1.27 | 3 | 0.99 | <1 fmol | < 1 fmol |
| 9 | SD1 | 4-Aminobutanoate | C00334 | 104.0711 | 3.5 | 1.21 | 4 | 0.97 | 4.5 pmol | 1.5 pmol |
| 10 | SD1 | L-Glutamate | C00025 | 148.0604 | 0.25 | 1.20 | 4 | 1.00 | 61 fmol | 20.3 fmol |
| 11 | SD1 | Glycine | C00037 | 76.0400 | 10 | 1.14 | 4 | 0.99 | 390 pmol | 130 pmol |
| 12 | SD1 | L-Histidine | C00135 | 156.0765 | 1 | 1.22 | 4 | 0.99 | 2 pmol | 750 fmol |
| 13 | SD1 | trans-L-3-Hydroxyproline | C05147 | 132.0656 | 3 | 1.22 | 3 | 0.99 | 2 pmol | 750 fmol |
| 14 | SD1 | L-Isoleucine | C00407 | 132.1020 | 0.5 | 1.78 | 4 | 0.98 | 480 fmol | 160 fmol |
| 15 | SD1 | L-Leucine | C00123 | 132.1020 | 0.5 | 1.72 | 4 | 0.99 | 420 fmol | 140 fmol |
| 16 | SD1 | L-Lysine | C00047 | 147.1128 | 0.5 | 1.05 | 3 | 0.98 | 750 fmol | 250 fmol |
| 17 | SD1 | L-Methionine | C00073 | 150.0584 | 1 | 1.64 | 4 | 0.99 | <1 fmol | < 1 fmol |
| 18 | SD1 | N(pi)-Methyl-L-histidine | C01152 | 170.0924 | 3.5 | 1.04 | 3 | 0.95 | 1.5 pmol | 500 fmol |
| 19 | SD1 | L-Ornithine | C00077 | 133.0973 | 2 | 1.03 | 3 | 0.99 | 22.5 pmol | 7.5 pmol |
| 20 | SD1 | L-Phenylalanine | C00079 | 166.0863 | 0.5 | 2.92 | 4 | 0.99 | 480 fmol | 160 fmol |
| 21 | SD1 | L-Proline | C00148 | 116.0709 | 2.5 | 1.25 | 4 | 0.99 | 7.5 pmol | 2.5 pmol |
| 22 | SD1 | Sarcosine | C00213 | 90.0555 | 5 | 1.16 | 3 | 0.99 | 600 fmol | 200 fmol |
| 23 | SD1 | L-Serine | C00065 | 106.0501 | 4.5 | 1.24 | 3 | 0.99 | 7.5 pmol | 2.5 pmol |
| 24 | SD1 | L-Threonine | C00188 | 120.0656 | 3 | 1.29 | 4 | 1.00 | 1.3 pmol | 430 fmol |
| 25 | SD1 | L-Tyrosine | C00082 | 182.0812 | 0.25 | 1.79 | 4 | 1.00 | <1 fmol | < 1 fmol |
| 26 | SD1 | L-Valine | C00183 | 118.0866 | 3 | 1.41 | 4 | 1.00 | 15 pmol | 5 pmol |
| 27 | SD2 | L-Asparagine | C00152 | 133.0609 | 1.5 | 1.21 | 4 | 0.99 | 7.5 pmol | 2.5 pmol |
| 28 | SD2 | L-Glutamine | C00064 | 147.0765 | 0.3 | 1.19 | 4 | 0.98 | 15 pmol | 5 pmol |
| 29 | SD2 | L-Tryptophan | C00078 | 205.0973 | 0.3 | 2.79 | 3 | 0.99 | <1 fmol | < 1 fmol |
| 30 | SD3 | 5-Hydroxy-L-lysine | C16741 | 163.1076 | 1 | 1.03 | 4 | 0.99 | 780 fmol | 260 fmol |
| 32 | SD3 | Cystathionine | C00542 | 223.0745 | 4.5 | 1.13 | 4 | 0.99 | <1 fmol | < 1 fmol |
| 33 | SD3 | Pro-HYP | C10H16N2O4 | 229.1181 | 0.5 | 1.18 | 4 | 0.99 | <1 fmol | < 1 fmol |
| 34 | SD3 | Gly-Pro | C7H12N2O3 | 171.0765 | 1 | 1.42 | 4 | 0.99 | 750 fmol | 250 fmol |
| 35 | SD3 | Thioproline | C6H12SNO3 | 173.0920 | 4.5 | 1.25 | 4 | 0.99 | 6 pmol | 2 pmol |
Figure 1. Extracted Ion Chromatograms of amino acids.
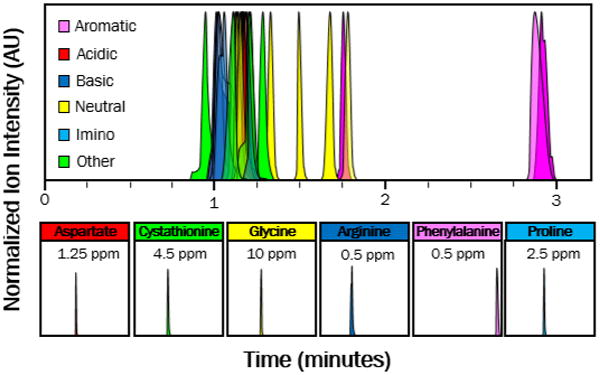
Extracted Ion Chromatograms (XIC) for 32 representative amino acids assayed in this study have been overlaid to demonstrate chromatographic separation (top). Amino acid categories are color coded as follows: aromatic (pink), acidic (red), basic (blue), neutral (yellow), imino (light blue), or other (green) amino acids. Six representative XICs are presented to illustrate peak shape (bottom). Parts per million (ppm) values used to detect each amino acid are provided for each XIC.
Figure 2. Resolution of leucine and isoleucine.
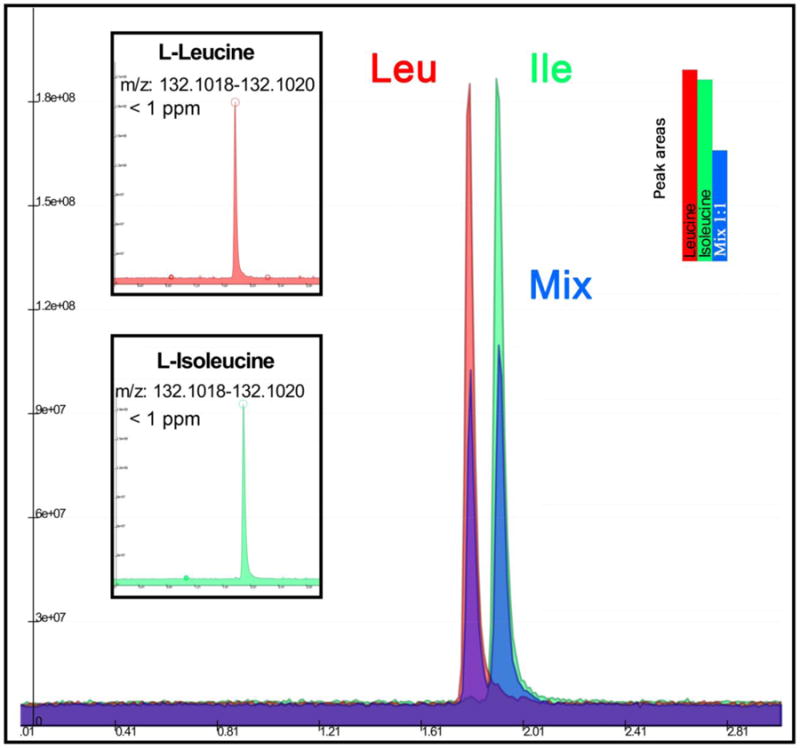
Individual Extracted Ion Chromatograms for leucine (red), isoleucine (green), and a mixture (blue) (1μM stocks of 99% pure standards and a 1:1 mixture, respectively) were overlaid to show resolution of the isobaric amino acids over the 3 min isocratic run at sub 1 ppm error on the intact mass.
In Table 1 we report the compound name, along with the KEGG pathway compound ID, the MS polarity in which all the amino acids were detected (positive), the observed parent ion, retention times, logarithms of linearity for quantitative analysis, quadratic correlation coefficients (R2 – also highlighted in Supplementary Figure 2), LOQ and LOD values. The highest LOQ and LOD values were observed for glycine (390 and 130 pmol, respectively), while many metabolites showed linearity over three to five (logarithmic) orders of concentrations, down to the lowest tested injection amount (1 fmol). Importantly, this range is relevant to biological contexts, where metabolite quantities are often in the range of mM to μM concentrations (Armstrong et al. 2007).
The linearity of quantitation over several orders of magnitude down to even low fmol levels (exemplified by L-glutamate in Figure 3.A and B) expands the capability of this analytical platform to analyze and determine absolute quantitation of extremely dilute or scarce samples. One interesting example of a dilute sample is the neurological releasate from taste buds. A role for glutamate as an efferent neurotransmitter in taste buds has been recently proposed (Vandenbeuch et al. 2010), though only indirect evidence has been provided due to the lack of analytical capability to directly identify this compound in such a dilute sample. While our analysis of neurological releasates (glutamate release from taste buds - Figure 3.A – box) exemplifies the capability of 3AA to assess low-level metabolites, it suggests that the described approach might enable the analysis of other clinically relevant low volume/abundance matrices. Such matrices could include blastocyst fluid, as previously described (D'Alessandro et al. 2012a), and stem cell populations that currently require pooling from different sources for analysis due to low abundance, which limits the biological readout of stem cell studies (Panopoulos et al. 2012).
Figure 3. Glutamate quantitation.
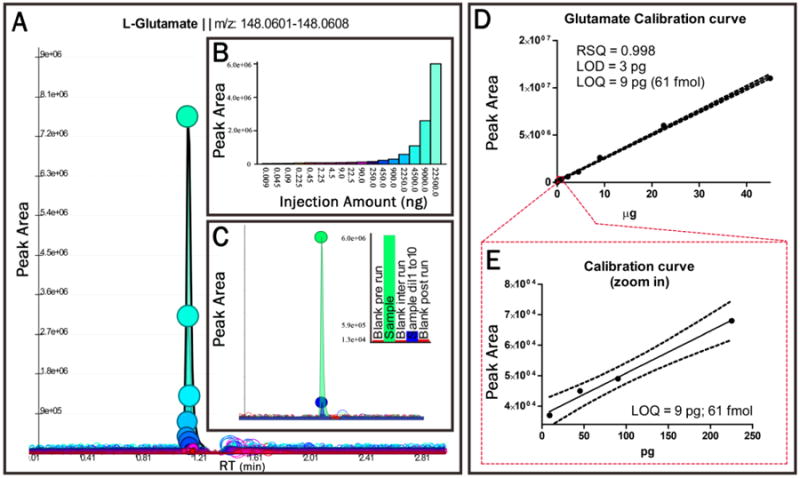
In Panel A, Extracted Ion Chromatograms are shown for 1 μl injections of L-glutamate ranging from 22.5 μg/μl (153 nmol injected) down to 9 pg/μl (61 fmol injected); the latter injection represents the limit of quantitation (3 × Limit of Detection) for this amino acid with the present analytical set up. Peak apexes are indicated by circles filled with colors specific for each injection amount. These colors are referenced in Panel B, which describes the peak area for each injection amount as a bar graph. Panel C shows the absence of L-glutamate carry over between injections, by showing the corresponding peak areas for the sample injection, a 1:10 dilution of the sample (in methanol:acetonitrile:water 5:3:2 v/v), and blank runs carried out throughout the analysis (pre-run, inter-run, post-run). The representative bar graphs for L-glutamate peak area in the inset are ordered chronologically from left to right. Panel D depicts the calibration curve for L-glutamate. Panel E depicts the calibration curve for the 4 lowest injection amounts to show linearity down to Limit of Quantitation using an error of 2.5 ppm in positive ion mode.
Despite the absence of a gradient, no carry-over of any analyte was observed when testing simple or complex biological matrices, including taste bud releasate (Figure 3.A box) and cell extracts (Supplementary Figure 3). Carry over effects were not observed in any of the tested matrices, whether the samples were resuspended in water or directly injected in the organic sample extraction buffer (methanol:acetonitrile:water). Retention times of amino acids in the samples were consistent with analytical standards only when injecting samples resuspended in water. However, direct injection of samples in the organic extraction/lysis buffer resulted in a minor reduction in retention times (-6% median deviation – 3.6 s– Supplementary Table 3), while accuracy was not affected (<5 ppm error on the accurate intact mass). Despite this observation, since this method has been provided to provide a high throughput platform for amino acid analysis, it is worth noting that the implementation of an extra drying/resuspension step would represent a burden in terms of sample processing time.
Notably, results obtained with the 3AA method were consistent with those collected using a longer HILIC gradient, a method that represents one of the current standards of practice in the field of polar compound metabolomics (Cubbon et al. 2010) (Supplementary Figure 3). Although less stable than RP approaches, the polar compound-friendly chemistry of HILIC makes it an eligible strategy to analyze polar matrices such as biofluids and cell extracts, as extensively reviewed by Cubbon and colleagues (Cubbon et al. 2010). Therefore the ability of the RP-based 3AA method to replicate results determined using a HILIC-based method establishes 3AA as a more efficient, alternative method for the rapid analysis of amino acid content for high throughput discovery mode purposes.
Robustness of the method in different biological matrices
As a proof of principle, the applicability of this method for general discovery through relative quantitation was tested with three unique biological matrices, including biological fluids (plasma), cell extracts (Pan02 cancer cells) and muscle tissue extracts (Figure 4). All 20 of the classic amino acids were detected in each matrix, showing the general utility of the method for rapid application to diverse biological samples. Relative quantities of amino acids determined in these matrices were used to run unsupervised statistical analyses such as PCA and PLS-DA, with the goal of discriminating sample groups into clusters (Figure 4 -Sample Plot) based on the relative contribution of each amino acid (Principal Components, PCs, depicted in the Loading Plot).
Figure 4. Three minute amino acid analysis is predictive of biological phenotypes by PCA in three different biological matrices.
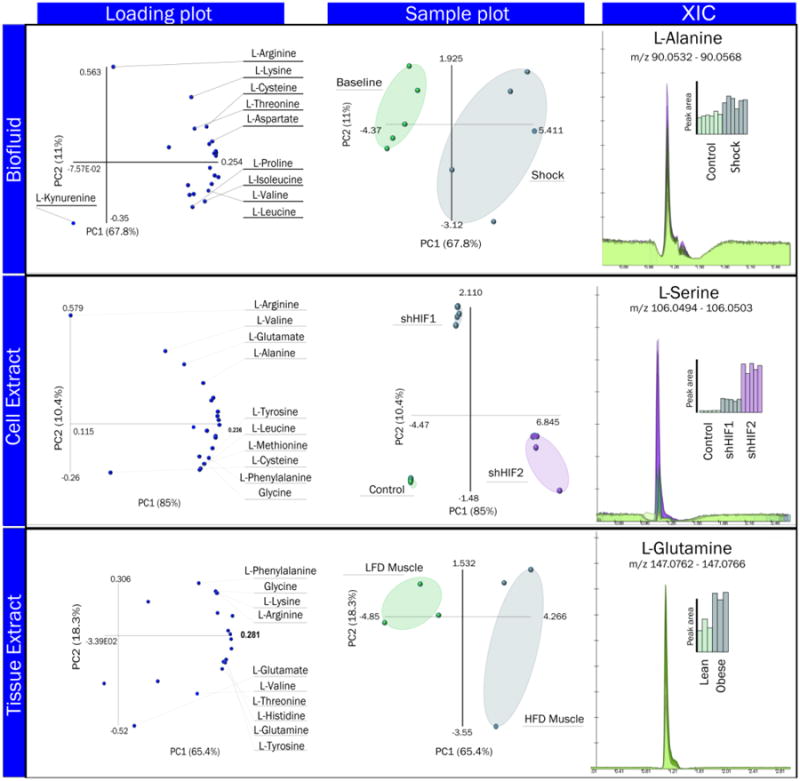
From left to right, panels indicate the principal amino acid contributors (Loading Plot, left), the sample clustering pattern resulting from an unsupervised Principal Component Analysis (Sample Plot, center) and the extracted ion chromatogram (XIC) for a representative amino acid in each group (XIC, right). Bar graph colors in the XIC right panel inset correspond to sample cluster colors in the center Sample Plot panel and indicate peak area quantities for the biological replicates in different conditions. Experimental mass to charge ratio (m/z) windows for detection are provided in the XIC right panel inset for each amino acid to illustrate high mass accuracy. From top to bottom, examples are provided for representative amino acid analyses of biofluid extracts (rat plasma extracts under control – baseline – conditions, or in response to trauma/hemorrhagic shock-shock), cell extracts (Pan02 cancer cell lines, five replicates, control versus two different HIF1α knock down clones), and tissue extracts (skeletal muscle biopsies from three rats subjected to low fat diet (LFD) or high fat diet (HFD)), respectively. XICs were obtained from the MAVEN software. PCA plots were prepared using the Excel macro Multibase. The total figure was assembled using Adobe Photohoshop CS6.
Plasma is a key biofluid in clinical and biomedical research settings, as it is used as a proxy for monitoring systemic health (Dunn et al. 2014). In the emergency care setting, plasma metabolic profiles have been recently investigated to monitor the severity of trauma in rats (D'Alessandro et al. 2015b) and humans (Peltz et al. 2015). In particular, trauma and hemorrhagic shock have been associated with increased proteolysis, and plasma amino acid accumulation (Peltz et al. 2015). Here, amino acid analysis of plasma extracts in a rat model of trauma/hemorrhagic shock discriminated the pre-shock baseline samples from shock (Figure 4.A – top panel). Many amino acids showed the same increasing trend in response to trauma/hemorrhagic shock, illustrated by the Loading Plot (Figure 4.A - top panel). Alanine levels, which increase in both the shock and resuscitation time points, are depicted in the Extracted Ion Chromatogram (XIC) in the right hand panel of Figure 4.A. This particular finding has biological relevance to trauma/hemorrhagic shock response; the conversion of pyruvate to alanine by glutamate-pyruvate transaminase could affect the process of converting pyruvate to lactate by lactate dehydrogenase. Importantly, lactate is known to be a key driver of ketoacidosis in response to trauma (Husain et al. 2003) and thus this finding may offer insight into the rate of lactate accumulation during trauma/hemorrhagic shock.
In cell extracts, a key matrix for example in the field of cancer research, quantitation of amino acids such as L-serine allowed for discrimination between control cells (blue bar plots) and two different clones of cells with HIF1α knock down(red and green bar plots - Figure 4, middle panels). Serine metabolism is emerging as a key pathway in cancer cells(Maddocks et al. 2013), in the light of recent evidence linking serine metabolism to p53-family modulated responses(Maddocks et al. 2013; Amelio et al. 2013; D'Alessandro et al. 2014a). Serine anabolism stems from a branch of aerobic glycolysis often referred to as the Warburg effect (D'Alessandro and Zolla 2013), which is the main energy-generating pathway in rapidly proliferating cancer cells.
Providing further evidence for the utility of the 3AA method, relative amino acid quantitation from tissue extracts could independently cluster biological triplicates of muscle tissue samples obtained from rats subjected to low fat diet (LFD) versus high fat diet (HFD) (Figure 4, lower panels). Glutamine (Figure 4, lower right panel) was found to contribute to the discriminating pattern between LFD (green bars) and HFD muscle samples (blue bars). Interestingly, previous studies on diabetes, insulin-resistance, and its effect on rat liver and muscles have suggested a role for L-glutamine supplementation in the induction of insulin resistance in the adipose tissue, while promoting insulin signaling in muscles and liver(Prada et al. 2007).
Of note, all of the samples described herein were prepared from either 10 μl of biofluid, 5 mg of muscle tissue, or 3.6×10⁵ cells and injection volumes represented 0.5%, 1% and 11% of the total extraction volumes, respectively. The small fraction of the sample required for analysis demonstrates the sensitivity of this method, which is a requirement to perform amino acid analyses on samples with limited quantities. Through extrapolation, this method could provide comprehensive amino acid analysis from nanoliters of biofluids, micrograms of tissue, and 104 cells from culture. Sample preparation and handling methods are currently being optimized for sample sources with such low abundance.
Quantitation and matrix effects
To further validate the 3AA method, we compared results for the undiluted or five-fold diluted pancreatic cancer cell extract samples (biological triplicates) from the 3AA method as well as two UHPLC/MS methods using either normal or Amide HILIC (Yuan et al. 2012) with 15 or 23 min separations, respectively (Supplementary Figure 3). Relative quantitation results from all platforms were comparable, as depicted using heat map plots in Supplementary Figure 3. The C18 and Amide HILIC method showed the most consistent results in terms of relative quantitation (red = five-fold ± 0.5 increase – Supplementary Figure 3). Importantly, the length of the analysis using the 3AA analytical method is five- to eight-fold shorter than the normal and Amide HILIC runs. Therefore, this improvement in workflow efficiency opens up new opportunities in clinical biochemistry (D'Alessandro et al. 2012b) and drug discovery (D'Alessandro and Zolla 2013) whereby rapid readouts will enhance patient care, drug development, testing, and screening.
Because of the rapid separation times of this method and the complexity of the assayed samples, the effects of matrix composition on ionization were tested to confirm linearity of the quantitative approach. These experiments were carried out with the addition of a standard mix at different concentrations (0, 0.5, 2.5 and 5 pmol injected) into the complex matrix of red blood cell extracts (Supplementary Table 4). Red blood cells interact closely with the plasma metabolome and the metabolic complexity of these cells has been recently appreciated by our (D'Alessandro et al. 2014c) and other groups (Zhang et al. 2011). Median Pearson's correlation coefficients for quantitative analysis of all tested amino acids averaged above 0.95 (0.98 and 0.99 in two out of three samples – Supplementary Table 4), showing linearity of quantitation in real samples. However, signal suppression (2.59 ± 0.66 fold – Supplementary Table 4) was observed in comparison to the same standard mixture injected in the absence of background matrix, suggesting that absolute quantification of amino acids in a real matrix should be performed by establishing calibration curves in the matrix in question.
In the light of the observed matrix effects, a stable isotope dilution approach was employed by adding heavy labeled internal standards (13C6-arginine, 13C6-lysine, 13C515N2-glutamine) and xenometabolites (5-fluorouracil) to the lysis/extraction buffer. This enriched buffer was thus used to process matched plasma, BALF and mesenteric lymph samples from trauma rats either undergoing sham or hemorrhagic shock (T/SS or T/HS), in presence and absence of mesenteric lymph diversion (MLD) to prevent distal organ injury after trauma/hemorrhagic shock (Stringham et al. 2014). Peak areas of heavy labeled standards and xenometabolites were used to determine reproducibility of the analyses in complex matrices (CVs<10%, Supplementary Figure 4, Supplementary Table 5). Ratios of the 1:1 mixtures of biological samples extracted in lysis buffer either containing 10 or 20 μM concentrations of heavy labeled standards were used to confirm linearity of relative quantitation (Supplementary Table 5). Calculated fold changes were highly precise (average CVs<10%) and mostly accurate (median of all fold changes = 2.07). However, two exceptions were observed in that heavy labeled arginine in BALF was underestimated and heavy labeled glutamine in lymph was overestimated (Supplementary Table 5). This finding is consistent with the anticipated matrix dependency of matrix effects. Therefore, even though in 7 out 9 cases no preliminary optimization was necessary, future applications will require identification of the linear range of quantification in the matrix being studied.
Finally, heavy to light isotopologue ratios for each standard amino acid were used to determine absolute concentrations in each tested sample (n = 2, plus two 1:1 mixtures with 10 and 20 μM spiked in samples - Supplementary Table 5). Here we show that, despite the influence of biological variability on experimental measurements, calculated CVs were <15% for arginine and lysine and <10% for glutamine in each one of the assayed matrices. While no previous data were available for amino acid concentrations in lymph and BALF to the best of our knowledge, the concentrations of arginine, lysine and glutamine in rat plasma were consistent with the literature (Morrison et al. 1961; Yang et al. 2002; Hiscock and Pedersen 2002).
Conclusion
The rapidly expanding field of metabolomics has shown increasing potential for translational applications in the clinical setting. The feasibility of using metabolomics as a readout in these applications depends on the capacity to analyze a biologically-relevant sub-portion of the metabolome in a robust, quantitative, fast, and reproducible fashion. In particular, rapidity is a key factor to analyze clinical samples from large cohorts of patients, which helps to cope with biological variability-associated issues by increasing the number of observations. In light of the increasingly consolidated focus of amino acids in several research areas including cancer metabolism, neurobiology, fertility research, nutrition, and food chemistry, amino acid analysis represents a key method in the clinical and research setting. Here we describe a three minute method for amino acid analysis (3AA) via UHPLC/MS. This method is fast, reproducible, sensitive, linear, and has been validated through the use of underivatized commercially available standard mixtures, injected either alone or in combination with background matrix to test linearity of quantitation in the presence of matrix-dependent ion suppression effects. In cases where biological matrices give rise to isobaric species with similar retention times, product ion transitions can be monitored for further selectivity. We conclude that the method is amenable for high throughput fast amino acid analysis in routine samples for biological and clinical research (e.g. biofluids, cell and tissue extracts). While in most of these applications relative quantitation might be sufficient for discovery mode applications, here we show two approaches for absolute quantitation through the use of exogenously added light or heavy labeled internal standards This method surpasses the rapidity of chemical derivatization-based approaches while maintaining sensitivity and selectivity as demonstrated by unambiguous assignment of amino acids with sub 5 ppm accuracy, retention time and isotopic pattern distributions to determine elemental composition. Rapidity and accuracy of relative quantitation were superior to normal and Amide HILIC runs. Taken together, our method represents a very robust and sensitive tool for amino acid analyses.
Supplementary Material
Extracted Ion Chromatograms (XIC) for 32 representative amino acids assayed in this study have been overlaid to demonstrate chromatographic separation (top). Amino acid categories are color coded as follows: aromatic (pink), acidic (red), basic (blue), neutral (yellow), imino (light blue), or other (green) amino acids. All the single XICs are presented to illustrate peak shape (bottom). Parts per million (ppm) error value windows on the intact mass needed to detect each amino acid are provided for each XIC.
Extracted Ion Chromatograms for 15 representative amino acids are depicted in each panel. The inset depicts peak areas for each injection amount, with the RSQ value indicated beneath the bar graph. A mass-to-charge window used for detection is indicated next to the amino acid name to highlight high mass accuracy of the platform.
Pancreatic cancer cell extracts were compared using the three min C18 method and two conventional HILIC or Amide column 15 min methods. Raw samples were either not-diluted prior to injection (ND) or injected upon a five-fold dilution. Raw values were Z-score normalized for each amino acid (intra row) and plotted as heat maps (blue to red = one to five fold-increase in amino acid level intra-row) using the software GENE E (Broad Institute). Consistently, undiluted samples were detected to have higher levels of amino acids through all three methods, but the C18 three min method was the one showing the average of the medians of amino acid fold changes across replicates closer to five (red columns for ND samples).
in thirty five different rat plasma samples. Coefficients of variation (CVs) were calculated (standard deviation/mean) to test technical reproducibility of the approach.
Acknowledgments
The Authors are grateful to Drs. Anthony W. Bacon, Aurelie Vandenbeuch, Bryan Bergman, Craig Jordan, Carlos M. Castorena, Gregory D. Cartee, Jeniann Yi, Hunter Moore, Sean Newsom, Agnieszka Kendrick for providing the biological samples, as detailed in the paper. The authors would also like to thank Dr. Robert Hodges for helpful discussions. Research reported in this publication was supported by the National Institute of General Medical Sciences of the National Institutes of Health under Award Numbers P50GM049222, R33CA183685 and T32GM008315, and Grant #P50 GM049222 from NIGMS, NIH (CS). The content is solely the responsibility of the authors and does not necessarily represent the official views of the National Institutes of Health.
Abbreviations
- 3AA
three minute method for amino acid analysis
- BALF
bronchioalveolar lavage fluid
- CV
coefficient of variation
- GC/MS
gas chromatography/mass spectrometry
- HFD
high fat diet
- HIF1α
hypoxia-inducible factor 1α
- HILIC
hydrophilic interaction liquid chromatography
- HPLC
high performance liquid chromatography
- LC/MS
- LFD
low fat diet
- LOD
limit of detection
- LOQ
limit of quantification
- MAP
mean arterial pressure
- MLD
mesenteric lymph diversion
- MRM
multiple reaction monitoring
- MS
mass spectrometry
- m/z
mass to charge ratio
- PCA
principal component analysis
- PLS-DA
partial least-square discriminant analysis
- SD
standard dilution
- S/N
signal to noise ratio
- T/HS
trauma/hemorrhagic shock
- T/SS
trauma/sham shock
- TOF
time of flight
- UHPLC
ultra-high performance liquid chromatography
- XIC
extracted ion chromatogram
Footnotes
Explanation of Author Contributions ADA and TN designed the experiments, set up the analytical workflow, and performed the experiments, prepared figures and tables. KCH designed and supervised the experiments, provided economic/technical support and technical/chemical expertise. ADA, TN and KCH wrote and revised the paper.
Conflict of interest All the authors disclose no conflict of interests.
References
- Amelio I, Cutruzzolá F, Antonov A, et al. Serine and glycine metabolism in cancer. Trends Biochem Sci. 2014;39:191–198. doi: 10.1016/j.tibs.2014.02.004. [DOI] [PMC free article] [PubMed] [Google Scholar]
- Amelio I, Markert EK, Rufini A, et al. p73 regulates serine biosynthesis in cancer. Oncogene. 2014;33(42):5039–5046. doi: 10.1038/onc.2013.456. [DOI] [PubMed] [Google Scholar]
- Armstrong M, Jonscher K, Reisdorph NA. Analysis of 25 underivatized amino acids in human plasma using ion-pairing reversed-phase liquid chromatography/time-of-flight mass spectrometry. Rapid Commun Mass Spectrom RCM. 2007;21:2717–2726. doi: 10.1002/rcm.3124. [DOI] [PubMed] [Google Scholar]
- Badawy AAB. The EZ:Faast family of amino acid analysis kits: application of the GC-FID kit for rapid determination of plasma tryptophan and other amino acids. Methods Mol Biol Clifton NJ. 2012;828:153–164. doi: 10.1007/978-1-61779-445-2_14. [DOI] [PubMed] [Google Scholar]
- Benson JR, Hare PE. O-phthalaldehyde: fluorogenic detection of primary amines in the picomole range. Comparison with fluorescamine and ninhydrin. Proc Natl Acad Sci U S A. 1975;72:619–622. doi: 10.1073/pnas.72.2.619. [DOI] [PMC free article] [PubMed] [Google Scholar]
- Bidlingmeyer BA, Cohen SA, Tarvin TL. Rapid analysis of amino acids using pre-column derivatization. J Chromatogr B Biomed Sci App. 1984;336:93–104. doi: 10.1016/s0378-4347(00)85133-6. [DOI] [PubMed] [Google Scholar]
- Buiarelli F, Gallo V, Di Filippo P, et al. Development of a method for the analysis of underivatized amino acids by liquid chromatography/tandem mass spectrometry: application on Standard Reference Material 1649a (urban dust) Talanta. 2013;115:966–972. doi: 10.1016/j.talanta.2013.07.009. [DOI] [PubMed] [Google Scholar]
- Cardaci S, Ciriolo MR. Deprive to kill: glutamine closes the gate to anticancer monocarboxylic drugs. Autophagy. 2012;8:1830–1832. doi: 10.4161/auto.21795. [DOI] [PMC free article] [PubMed] [Google Scholar]
- Castorena CM, Arias EB, Sharma N, Cartee GD. Postexercise improvement in insulin-stimulated glucose uptake occurs concomitant with greater AS160 phosphorylation in muscle from normal and insulin-resistant rats. Diabetes. 2014;63:2297–2308. doi: 10.2337/db13-1686. [DOI] [PMC free article] [PubMed] [Google Scholar]
- Chen G, Wang J. Threonine metabolism and embryonic stem cell self-renewal. Curr Opin Clin Nutr Metab Care. 2014;17:80–85. doi: 10.1097/MCO.0000000000000007. [DOI] [PubMed] [Google Scholar]
- Clasquin MF, Melamud E, Rabinowitz JD. LC-MS data processing with MAVEN: a metabolomic analysis and visualization engine. Curr Protoc Bioinforma Ed Board Andreas Baxevanis Al. 2012;Chapter 14 doi: 10.1002/0471250953.bi1411s37. Unit14.11. [DOI] [PMC free article] [PubMed] [Google Scholar]
- Cubbon S, Antonio C, Wilson J, Thomas-Oates J. Metabolomic applications of HILIC-LC-MS. Mass Spectrom Rev. 2010;29:671–684. doi: 10.1002/mas.20252. [DOI] [PubMed] [Google Scholar]
- D'Alessandro A, Amelio I, Berkers CR, et al. Metabolic effect of TAp63α: enhanced glycolysis and pentose phosphate pathway, resulting in increased antioxidant defense. 2014a;5(17):7722–7733. doi: 10.18632/oncotarget.2300. [DOI] [PMC free article] [PubMed] [Google Scholar]
- D'Alessandro A, Cervia D, Catalani E, et al. Protective effects of the neuropeptides PACAP, substance P and the somatostatin analogue octreotide in retinal ischemia: a metabolomic analysis. Mol Biosyst. 2014b;10(6):1290–1304. doi: 10.1039/c3mb70362b. [DOI] [PubMed] [Google Scholar]
- D'Alessandro A, Gevi F, Palini S, et al. A mass spectrometry-based targeted metabolomics strategy of human blastocoele fluid: a promising tool in fertility research. Mol Biosyst. 2012a;8:953–958. doi: 10.1039/c1mb05358b. [DOI] [PubMed] [Google Scholar]
- D'Alessandro A, Gevi F, Zolla L. A robust high resolution reversed-phase HPLC strategy to investigate various metabolic species in different biological models. Mol Biosyst. 2011;7:1024–1032. doi: 10.1039/c0mb00274g. [DOI] [PubMed] [Google Scholar]
- D'Alessandro A, Giardina B, Gevi F, et al. Clinical metabolomics: the next stage of clinical biochemistry. Blood Transfus Trasfus Sangue. 2012b;10(Suppl 2):s19–24. doi: 10.2450/2012.005S. [DOI] [PMC free article] [PubMed] [Google Scholar]
- D'Alessandro A, Kriebardis AG, Rinalducci S, et al. An update on red blood cell storage lesions, as gleaned through biochemistry and omics technologies. Transfusion. 2015a;55(1):205–19. doi: 10.1111/trf.12804. [DOI] [PubMed] [Google Scholar]
- D'Alessandro A, Moore HB, Moore EE, et al. Early hemorrhage triggers metabolic responses that build up during prolonged shock. Am J Physiol - Regul Integr Comp Physiol. 2015b doi: 10.1152/ajpregu.00030.2015. ajpregu.00030.2015. [DOI] [PMC free article] [PubMed] [Google Scholar]
- D'Alessandro A, Nemkov T, Kelher M, et al. Routine storage of red blood cell (RBC) units in additive solution-3: a comprehensive investigation of the RBC metabolome. Transfusion. 2014c doi: 10.1111/trf.12975. [DOI] [PMC free article] [PubMed] [Google Scholar]
- D'Alessandro A, Zolla L. Proteomics and metabolomics in cancer drug development. Expert Rev Proteomics. 2013;10:473–488. doi: 10.1586/14789450.2013.840440. [DOI] [PubMed] [Google Scholar]
- Dorresteijn RC, Berwald LG, Zomer G, et al. Determination of amino acids using o-phthalaldehyde-2-mercaptoethanol derivatization effect of reaction conditions. J Chromatogr A. 1996;724:159–167. [Google Scholar]
- Droge W. Oxidative stress and ageing: is ageing a cysteine deficiency syndrome? Philos Trans R Soc B Biol Sci. 2005;360:2355–2372. doi: 10.1098/rstb.2005.1770. [DOI] [PMC free article] [PubMed] [Google Scholar]
- Dunn WB, Lin W, Broadhurst D, et al. Molecular phenotyping of a UK population: defining the human serum metabolome. Metabolomics. 2014;11:9–26. doi: 10.1007/s11306-014-0707-1. [DOI] [PMC free article] [PubMed] [Google Scholar]
- Fonville JM, Richards SE, Barton RH, et al. The evolution of partial least squares models and related chemometric approaches in metabonomics and metabolic phenotyping. J Chemom. 2010;24:636–649. [Google Scholar]
- Fürst P, Pollack L, Graser TA, et al. Appraisal of four pre-column derivatization methods for the high-performance liquid chromatographic determination of free amino acids in biological materials. J Chromatogr. 1990;499:557–569. doi: 10.1016/s0021-9673(00)97000-6. [DOI] [PubMed] [Google Scholar]
- Heinrikson RL, Meredith SC. Amino acid analysis by reverse-phase high-performance liquid chromatography: Precolumn derivatization with phenylisothiocyanate. Anal Biochem. 1984;136:65–74. doi: 10.1016/0003-2697(84)90307-5. [DOI] [PubMed] [Google Scholar]
- Hirayama A, Soga T. Amino acid analysis by capillary electrophoresis-mass spectrometry. Methods Mol Biol Clifton NJ. 2012;828:77–82. doi: 10.1007/978-1-61779-445-2_8. [DOI] [PubMed] [Google Scholar]
- Hiscock N, Pedersen BK. Exercise-induced immunodepression– plasma glutamine is not the link. J Appl Physiol. 2002;93:813–822. doi: 10.1152/japplphysiol.00048.2002. [DOI] [PubMed] [Google Scholar]
- Husain FA, Martin MJ, Mullenix PS, et al. Serum lactate and base deficit as predictors of mortality and morbidity. Am J Surg. 2003;185:485–491. doi: 10.1016/s0002-9610(03)00044-8. [DOI] [PubMed] [Google Scholar]
- Kaspar H, Dettmer K, Gronwald W, Oefner PJ. Automated GC–MS analysis of free amino acids in biological fluids. J Chromatogr B. 2008;870:222–232. doi: 10.1016/j.jchromb.2008.06.018. [DOI] [PubMed] [Google Scholar]
- Le A, Ng A, Kwan T, et al. A rapid, sensitive method for quantitative analysis of underivatized amino acids by liquid chromatography-tandem mass spectrometry (LC-MS/MS) J Chromatogr B Analyt Technol Biomed Life Sci. 2014;944:166–174. doi: 10.1016/j.jchromb.2013.11.017. [DOI] [PubMed] [Google Scholar]
- Maddocks ODK, Berkers CR, Mason SM, et al. Serine starvation induces stress and p53-dependent metabolic remodelling in cancer cells. Nature. 2013a;493:542–546. 3. doi: 10.1038/nature11743. [DOI] [PMC free article] [PubMed] [Google Scholar]
- Manning JM. The contributions of Stein and Moore to protein science. Protein Sci Publ Protein Soc. 1993;2:1188–1191. doi: 10.1002/pro.5560020715. [DOI] [PMC free article] [PubMed] [Google Scholar]
- Moore S, Spackman DH, Stein WH. Chromatography of Amino Acids on Sulfonated Polystyrene Resins. An Improved System. Anal Chem. 1958;30:1185–1190. [Google Scholar]
- Morrison AB, Middleton EJ, McLaughlan JM. Blood Amino Acid Studies: Ii. Effects of Dietary Lysine Concentration, Sex, and Growth Rate on Plasma Free Lysine and Threonine Levels in the Rat. Can J Biochem Physiol. 1961;39:1675–1680. doi: 10.1139/o61-185. [DOI] [PubMed] [Google Scholar]
- Panopoulos AD, Yanes O, Ruiz S, et al. The metabolome of induced pluripotent stem cells reveals metabolic changes occurring in somatic cell reprogramming. Cell Res. 2012;22:168–177. doi: 10.1038/cr.2011.177. [DOI] [PMC free article] [PubMed] [Google Scholar]
- Pan Z, Gu H, Talaty N, et al. Principal component analysis of urine metabolites detected by NMR and DESI-MS in patients with inborn errors of metabolism. Anal Bioanal Chem. 2007;387:539–549. doi: 10.1007/s00216-006-0546-7. [DOI] [PubMed] [Google Scholar]
- Peltz E, D'Alessandro A, Moore E, et al. Pathologic metabolism: An exploratory study of the plasma metabolome of critical injury. J Trauma Acute Care Surg. 2015 doi: 10.1097/TA.0000000000000589. [DOI] [PMC free article] [PubMed] [Google Scholar]
- Piraud M, Vianey-Saban C, Petritis K, et al. Ion-pairing reversed-phase liquid chromatography/electrospray ionization mass spectrometric analysis of 76 underivatized amino acids of biological interest: a new tool for the diagnosis of inherited disorders of amino acid metabolism. Rapid Commun Mass Spectrom. 2005;19:1587–1602. doi: 10.1002/rcm.1957. [DOI] [PubMed] [Google Scholar]
- Platten M, Wick W, Van den Eynde BJ. Tryptophan catabolism in cancer: beyond IDO and tryptophan depletion. Cancer Res. 2012;72:5435–5440. doi: 10.1158/0008-5472.CAN-12-0569. [DOI] [PubMed] [Google Scholar]
- Prada PO, Hirabara SM, de Souza CT, et al. L-glutamine supplementation induces insulin resistance in adipose tissue and improves insulin signalling in liver and muscle of rats with diet-induced obesity. Diabetologia. 2007;50:1949–1959. doi: 10.1007/s00125-007-0723-z. [DOI] [PubMed] [Google Scholar]
- Rutherfurd SM, Gilani GS. Amino acid analysis. Curr Protoc Protein Sci Editor Board John E Coligan Al. 2009;Chapter 11 doi: 10.1002/0471140864.ps1109s58. Unit 11.9. [DOI] [PubMed] [Google Scholar]
- Salazar C, Armenta JM, Cortés DF, Shulaev V. Combination of an AccQ·Tag-ultra performance liquid chromatographic method with tandem mass spectrometry for the analysis of amino acids. Methods Mol Biol Clifton NJ. 2012;828:13–28. doi: 10.1007/978-1-61779-445-2_2. [DOI] [PubMed] [Google Scholar]
- Shimbo K, Oonuki T, Yahashi A, et al. Precolumn derivatization reagents for high-speed analysis of amines and amino acids in biological fluid using liquid chromatography/electrospray ionization tandem mass spectrometry. Rapid Commun Mass Spectrom. 2009;23:1483–1492. doi: 10.1002/rcm.4026. [DOI] [PubMed] [Google Scholar]
- Stein S, Böhlen P, Stone J, et al. Amino acid analysis with fluorescamine at the picomole level. Arch Biochem Biophys. 1973;155:203–212. doi: 10.1016/s0003-9861(73)80022-0. [DOI] [PubMed] [Google Scholar]
- Stringham JR, Moore EE, Gamboni F, et al. Mesenteric lymph diversion abrogates 5-lipoxygenase activation in the kidney following trauma and hemorrhagic shock. J Trauma Acute Care Surg. 2014;76:1214–1221. doi: 10.1097/TA.0000000000000231. [DOI] [PMC free article] [PubMed] [Google Scholar]
- Thiele B, Stein N, Oldiges M, Hofmann D. Direct analysis of underivatized amino acids in plant extracts by LC-MS-MS. Methods Mol Biol Clifton NJ. 2012;828:317–328. doi: 10.1007/978-1-61779-445-2_25. [DOI] [PubMed] [Google Scholar]
- Vandenbeuch A, Tizzano M, Anderson CB, et al. Evidence for a role of glutamate as an efferent transmitter in taste buds. BMC Neurosci. 2010;11:77. doi: 10.1186/1471-2202-11-77. [DOI] [PMC free article] [PubMed] [Google Scholar]
- Yamaguchi S, Ninomiya K. Umami and Food Palatability. J Nutr. 2000;130:921S–926S. doi: 10.1093/jn/130.4.921S. [DOI] [PubMed] [Google Scholar]
- Yang WC, Mirzaei H, Liu X, Regnier FE. Enhancement of amino acid detection and quantification by electrospray ionization mass spectrometry. Anal Chem. 2006;78:4702–4708. doi: 10.1021/ac0600510. [DOI] [PubMed] [Google Scholar]
- Yang XD, Ma JYC, Barger MW, Ma JKH. Transport and Utilization of Arginine and Arginine-Containing Peptides by Rat Alveolar Macrophages. Pharm Res. 2002;19:825–831. doi: 10.1023/a:1016132200104. [DOI] [PubMed] [Google Scholar]
- Yao X, Zhou G, Tang Y, et al. Direct determination of underivatized amino acids from Ginkgo biloba leaves by using hydrophilic interaction ultra high performance liquid chromatography coupled with triple quadrupole mass spectrometry. J Sep Sci. 2013;36:2878–2887. doi: 10.1002/jssc.201201045. [DOI] [PubMed] [Google Scholar]
- Yuan M, Breitkopf SB, Yang X, Asara JM. A positive/negative ion-switching, targeted mass spectrometry-based metabolomics platform for bodily fluids, cells, and fresh and fixed tissue. Nat Protoc. 2012;7:872–881. doi: 10.1038/nprot.2012.024. [DOI] [PMC free article] [PubMed] [Google Scholar]
- Zhang Y, Dai Y, Wen J, et al. Detrimental effects of adenosine signaling in sickle cell disease. Nat Med. 2011;17:79–86. doi: 10.1038/nm.2280. [DOI] [PMC free article] [PubMed] [Google Scholar]
- Zhou G, Pang H, Tang Y, et al. Hydrophilic interaction ultra-performance liquid chromatography coupled with triple-quadrupole tandem mass spectrometry for highly rapid and sensitive analysis of underivatized amino acids in functional foods. Amino Acids. 2013;44:1293–1305. doi: 10.1007/s00726-013-1463-7. [DOI] [PubMed] [Google Scholar]
Associated Data
This section collects any data citations, data availability statements, or supplementary materials included in this article.
Supplementary Materials
Extracted Ion Chromatograms (XIC) for 32 representative amino acids assayed in this study have been overlaid to demonstrate chromatographic separation (top). Amino acid categories are color coded as follows: aromatic (pink), acidic (red), basic (blue), neutral (yellow), imino (light blue), or other (green) amino acids. All the single XICs are presented to illustrate peak shape (bottom). Parts per million (ppm) error value windows on the intact mass needed to detect each amino acid are provided for each XIC.
Extracted Ion Chromatograms for 15 representative amino acids are depicted in each panel. The inset depicts peak areas for each injection amount, with the RSQ value indicated beneath the bar graph. A mass-to-charge window used for detection is indicated next to the amino acid name to highlight high mass accuracy of the platform.
Pancreatic cancer cell extracts were compared using the three min C18 method and two conventional HILIC or Amide column 15 min methods. Raw samples were either not-diluted prior to injection (ND) or injected upon a five-fold dilution. Raw values were Z-score normalized for each amino acid (intra row) and plotted as heat maps (blue to red = one to five fold-increase in amino acid level intra-row) using the software GENE E (Broad Institute). Consistently, undiluted samples were detected to have higher levels of amino acids through all three methods, but the C18 three min method was the one showing the average of the medians of amino acid fold changes across replicates closer to five (red columns for ND samples).
in thirty five different rat plasma samples. Coefficients of variation (CVs) were calculated (standard deviation/mean) to test technical reproducibility of the approach.