

Abstract
Background
Autism Spectrum Disorder (ASD) is characterized by social impairments that have been related to deficits in social attention, including diminished gaze to faces. Eye-tracking studies are commonly used to examine social attention and social motivation in ASD, but they vary in sensitivity. In this study, we hypothesized that the ecological nature of the social stimuli would affect participants' social attention, with gaze behavior during more naturalistic scenes being most predictive of ASD vs. typical development.
Methods
81 children with and without ASD participated in three eye-tracking tasks that differed in the ecological relevance of the social stimuli. In the “Static Visual Exploration” task, static images of objects and people were presented; in the “Dynamic Visual Exploration” task, video clips of individual faces and objects were presented side-by-side; in the “Interactive Visual Exploration” task, video clips of children playing with objects in a naturalistic context were presented.
Results
Our analyses uncovered a three-way interaction between Task, Social vs. Object Stimuli, and Diagnosis. This interaction was driven by group differences on one task only – the Interactive task. Bayesian analyses confirmed that the other two tasks were insensitive to group membership. In addition, ROC analyses demonstrated that, unlike the other two tasks, the Interactive task had significant classification power.
Conclusions
The ecological relevance of social stimuli is an important factor to consider for eye-tracking studies aiming to measure social attention and motivation in ASD.
Keywords: Social attention, Autism Spectrum Disorder, Eye-tracking, Social motivation, Methodology, Face processing
Autism spectrum disorder (ASD) is characterized by social and communication deficits, which have been related to impairments in social attention and reduced responsiveness to social reward (Chevallier, Kohls, Troiani, Brodkin, & Schultz, 2012; Dichter, Richey, Rittenberg, Sabatino, & Bodfish, 2012; Kohls, Chevallier, Troiani, & Schultz, 2012). Specifically, an extensive body of literature suggests that people with ASD attend less to faces than typically developing (TD) individuals (e.g., Dawson, Webb, & McPartland, 2005; Klin, Jones, Schultz, Volkmar, & Cohen, 2002; for reviews, see Falck-Ytter, Bölte & Gredebäck, 2013; Guillion, Hadjikhani, Baduel & Roge, 2014), and concomitantly, that they have unusually high interest in certain categories of objects (e.g., trains) (Sasson & Touchstone, 2014; South, Ozonoff, & McMahon, 2005; for reviews, see Boyd, Conry, Mancil, Nakao & Alter, 2007; Turner-Brown, Lam, Holtzclaw, Dichter & Bodfish, 2011).
Eye-tracking is a common method for examining social perception and social preferences in ASD, but eye-tracking studies vary in how well they measure social attention, and how sensitive they are to ASD deficits. Until relatively recently, most eye-tracking studies in ASD have used static images. Some of these studies using static scenes found differences between ASD and TD participants, such as reduced gaze to the eyes (Dalton et al., 2005; Pelphrey et al., 2002; Spezio, Adolphs, Hurley, & Piven, 2007), some found no group differences (Bar-Haim, Shulman, Lamy, & Reuveni, 2006; Van der Geest, Kemner, Camfferman, Verbaten, & Van Engeland, 2002; Van der Geest, Kemner, Verbaten, & Van Engeland, 2002), and yet others revealed more nuanced effects where visual attention was similar across groups in basic experimental conditions but differed in conditions involving gaze following (Fletcher-Watson, Leekam, Benson, Frank, & Findlay, 2009; Freeth, Chapman, Ropar, & Mitchell, 2010).
Overall, it thus appears that static stimuli do not consistently produce group differences, which might indicate that they are not optimally sensitive. Recently, it has been suggested that scenes depicting ecological social interactions might be better at evoking robust social responses (Falck-Ytter & von Hofsten, 2010; Saitovitch et al., 2013). In line with this idea, Hanley and colleagues manipulated the ecological validity of static social stimuli by comparing acted vs. posed faces presented in isolation vs. within a social scene (Hanley, McPhillips, Mulhern, & Riby, 2012). In a sample of 14 children with ASD, they found diminished attention to salient facial cues, such as direct gaze, in the ASD group when more ecologically valid images were shown (i.e., acted faces embedded within a social scene).
Aside from ecological validity, static stimuli may not be as effective as dynamic stimuli at eliciting individual differences in social attention. Recent studies in animal research have indeed demonstrated the importance of stimulus type by comparing different visual rewards in monkeys (constant still pictures, changing still pictures, and action movies) and found that, although all visual stimuli can serve as effective rewards, movies have the highest reinforcement potential (Blatter & Schultz, 2006). In line with the idea that dynamic stimuli are more potent stimuli, robust group differences between ASD and TD children have been identified when participants are presented with dynamic videos of cartoons or human actors (Riby & Hancock, 2009) and functional neuroimaging data have confirmed that there are more differences between ASD and TD groups in the functionally localized lateral region of the right fusiform gyrus, including the fusiform face area, in response to dynamic rather than static social stimuli (Weisberg et al., 2012).
In addition, characteristics of dynamic stimuli may vary in their ability to attract consistent viewer attention (e.g., how realistic and complex/interesting the social scenes are) (Hanley et al., 2012). Work addressing this aspect of eye-tracking paradigms started in the past few years. One study with a sample of 12 children with ASD demonstrated that deficits in attending to faces were dependent on stimuli being realistic (i.e., dynamic stimuli depicting individuals interacting together) and that they were far less clear when social stimuli were either static or presented outside of an interactive context (Speer, Cook, McMahon, & Clark, 2007). In another study on toddlers with ASD, Chawarska et al. found that social attention in ASD was specifically impaired in the context of rich social scenes involving salient dyadic cues such as eye contact and communicative cues, but between-group differences were not found when such cues were absent (Chawarska, Macari, & Shic, 2012).
In the current study, we extended this prior work by comparing social attention to three types of eyetracking stimuli in a large sample of school-age participants with ASD. Here, and throughout the manuscript, the term social attention is used in the colloquial sense to refer to gaze patterns to social stimuli. We hypothesized that the nature of the social stimuli would have an impact on participants' social response, such that highly ecological, dynamic stimuli depicting social interaction would be optimal to demonstrate meaningful differences in social attention between ASD and TD controls. In order to explore this question, we capitalized on existing data collected in our center on a large group of participants who took part in one to three eye-tracking experiments using several types of stimuli. These experiments included static vs. dynamic stimuli and more vs. less interactive settings. This large dataset allowed us to aggregate a subset of participants who had taken part in all three experiments. By comparing the same ASD and TD subjects across three experiments, we a) directly investigated the impact of stimulus type on a task's ability to capture individual variation in social attention, and b) estimated the efficacy of various stimulus types to distinguish between diagnostic groups.
Methods
Participants
Our sample was drawn from a larger pool of 6- to 17-year-olds who volunteered to participate in a study investigating behavioral, brain, and genetic correlates of social deficits in ASD. Current diagnosis of autism was confirmed by expert clinical judgment, based on parent-reported developmental history (Autism Diagnostic Interview-Revised: ADI-R; Rutter et al., 2003) and symptom presentation (Autism Diagnostic Observation Schedule: ADOS; Lord et al., 2000). For the ADOS, 76.3% of the ASD sample was assessed with Module 3, 15.3% with Module 4, 5.1% with Module 1, and 3.4% with Module 2. In the current study, ASD participants were only included if they met the following criteria: an ADOS score above cut-off for ASD (Lord et al., 2002), no uncorrected auditory or visual impairment, no known genetic conditions, no history of traumatic brain injury, no evidence of birth related injury, and no other significant medical or neurological abnormality. The mean social-communication total ADOS score was 11.68, SD = 3.51, Range = 7-20. All assessment measures were administered, scored, and interpreted by a clinical psychologist or supervised doctoral-level psychology trainee who met all requirements for research reliability. Members of the TD group were evaluated by licensed clinical psychologists who ruled out the presence of DSM-IV-TR Axis I disorders based on clinical judgment, review of the child's medical history form, and parent interview. All participants were native speakers of English. A final inclusion criterion was that participants had to have participated in all three eye-tracking experiments, and to have passed quality control procedures for each.
Our final sample included a total of 81 children: 59 diagnosed with an ASD (4 females) and 22 control participants (0 female). The two groups differed on chronological age and full-scale IQ, according to the Differential Abilities Scales-II (DAS-II; Elliott, 2007); see Table 1. Although eight of the 59 ASD participants had Full Scale IQs under 70, all completed the tasks without difficulty. The groups did not differ on gender ratio, Fisher's exact test, p = .57. All participants and parents received oral feedback at the time of the visit, as well as a written report, and compensation for time and travel. The Institutional Review Board at The Children's Hospital of Philadelphia approved all procedures related to this project.
Table 1. Participant characteristics.
| ASD (n=59) | TDC (n=22) | ||
|---|---|---|---|
|
| |||
| Mean(SD) | Mean(SD) | Significance | |
| Age in years | 12.2 (3.3) | 14.9 (1.7) | t(79) = 3.73, p < .001 |
| FSIQ | 95.1 (23.3) | 118.9 (18.1) | t (79) = 4.37, p < .001 |
| Sex | M=55, F=4 | M=22, F=0 | p = .57 |
Materials
Three eye-tracking experiments were included in the present study. First, a “Static Visual Exploration” task displayed static images of objects and people. Second, a “Dynamic Visual Exploration” task simultaneously played four dynamic video clips of individual faces and objects. Finally, an “Interactive Visual Exploration” task presented highly ecological video clips of children playing together (see Figure 1).
Figure 1.
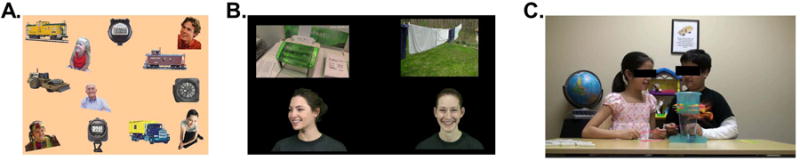
Representative stimuli for each task: (A) “Static Visual Exploration” task, (B) “Dynamic Visual Exploration” task, and (C) “Interactive Visual Exploration” task.
“Static Visual Exploration” task
The Static Visual Exploration task included 12 arrays containing 12 static pictures of objects and/or people (see Figure 1A) (task based on: Sasson, Turner Brown, Holtzclaw, Lam, & Bodfish, 2008). Half of the arrays contained only pictures of objects, while the other half contained pictures of people with clearly visible smiling faces and pictures of objects. All pictures were public domain photographs obtained from the Internet, and were selected for being relatively similar in complexity and size. Half of the object pictures were selected from nine categories previously demonstrated to be a common focus of circumscribed interests to individuals with ASD: trains, vehicles, planes, blocks, home electronics, computer equipment, road signs, and sporting equipment (South et al., 2005). The other half of the object pictures was selected from eight categories that were not known to be common circumscribed interest objects and was thus less likely to be compelling to individuals with ASD: clothing, furniture, plants, school supplies, bathroom supplies, gloves, hats, and bags. The task used here slightly differed from the visual exploration task in Sasson et al. (2008) in several ways: each array included 12 images compared to the 24 included in the original task, food items from the original task were replaced with other object images, and the proportion of object categories (circumscribed interest versus non-circumscribed interest) differed slightly across arrays. Each picture array was presented for 10 seconds followed by a one second crosshair appearing at the center of the screen. The picture arrays were shown in a fixed order and the total length of the experiment was approximately 5 minutes. Areas of Interest (AoIs) were drawn around each image of people (Social category) and objects (Object Category).
“Dynamic Visual Exploration” task
The Dynamic Visual Exploration task included 12 arrays of silent video clips of people and objects (see Figure 1B) (Parish-Morris et al., 2013). Each array contained 4 video clips playing concurrently, one in each quadrant of the screen. In order to minimize the predictability of the display, a jitter was introduced so that the videos were not consistently placed exactly in the center of each quadrant. The four videos shown on the screen in each trial consisted of two emotional faces (one gazing directly at the camera, one averted) and two objects (one related to circumscribed interests, one not; see Parish-Morris et al., 2013 for full description of included social and object stimuli). Face clips displayed emotions, which were the same within trial, but different across trials. Face and object clip locations were pseudo-randomized. Each video array was presented for 15 seconds followed by a one second crosshair appearing at the center of the screen. Each video clip lasted 3.75 seconds and was looped 4 times during the 15-second trial, so that children could look at each of the four clips and still get all of the visual information available in each clip. The video arrays were shown in a fixed order and the total length of the experiment was approximately 3.5 minutes. AoIs were drawn around each video clip of people (Social category) and objects (Object category).
“Interactive Visual Exploration” task
The Interactive Visual Exploration task included 22 silent video clips of 11 sibling pairs of school-aged children playing with objects at a table or on the floor (see Figure 1C). Each sibling pair was filmed in various playrooms where objects (e.g., paintings, toys, light switches) were visible in the background, with various toys (e.g., playing cards, paper and pencil, “barrel of monkeys” game) on table and floor available for play by the children. The children were videotaped as they were playing. Each sibling pair was filmed once while engaging in parallel play and once while playing cooperatively. The videos were naturalistic in that no specific guidelines were provided to the children apart from instructions to use only non-verbal communication and to not look into the camera. Clips were taken from longer original recordings, and were chosen to maximize social salience (i.e., clips where the siblings appeared natural, spontaneous, and frequently displayed of social communication). Each video clip was presented for 15 seconds followed by a one second crosshair appearing at the center of the screen. The video clips were shown in a fixed order and the total length of the experiment was approximately 5.5 minutes. AoIs were drawn around faces (Social category) and background objects (Object category; background objects were defined as any object in the scene that was not being interacted with).
Procedure
At the beginning of each study visit, parents provided informed consent for their child. The DAS-II and the ADOS were then administered to the child while parents completed the ADI-R. After a lunch break, children completed the eye-tracking and other behavioral tasks. Eye-tracking took place in a quiet room containing a chair and a 30-inch computer monitor on an adjustable table. A Tobii X120 gaze tracker recorded participants' looking patterns at a rate of 60Hz from a seated distance of approximately 60cm. Participants were calibrated at the beginning of each experiment using a standard five-point calibration procedure. If calibration quality was poor for any of these points, the calibration process was repeated. Before each task, participants were informed that they would see pictures or videos, and were asked to watch the screen while remaining still.
Eye-tracking parameters
Gaze data was exported from Tobii using the I-VT fixation filter. Fixation parameters were as follows: Gap fill-in using linear interpolation was enabled, with a maximum gap length of 75 ms. An average of the right and left eyes was used to calculate fixation. Noise reduction was disabled, and the velocity calculator was set at 20 ms. Adjacent fixations were merged, with the maximum time between merged fixations set to 75 ms and the maximum angle between merged fixations set to .5 degrees. Merging fixations close in time and proximity prevents longer fixations from being separated into shorter fixations because of data loss or noise. Fixations shorter than 30 ms that did not meet criteria for merging were discarded. Fixation data on social and object AoIs were then aggregated across trials from each of the three tasks for subsequent analysis.
Analyses
Data were analyzed using SPSS-20. Effect sizes (partial eta-squared, ηp2 for F statistics and Cohen's d for t-tests) are reported together with p-values for significant main effects and interactions. Following Cohen (1988), a ηp2 value / d value between 0.01/.20 and 0.06/.50 reflects a small effect, between 0.06/.50 and 0.14/.80 is a medium effect, and > 0.14/.80 represents a large effect. All p-values are for a two-tailed test.
Our analyses aim to characterize how patterns of eye gaze to Social vs. Object AoIs vary by diagnostic group (ASD vs. TD) and by task (Static, Dynamic, Interactive). Because all three tasks include empty background information (see Figure 1) that does not fall into either AoI category, fixation time combined between Social and Object AoIs does not equate to total fixation time on screen.
Our analyses focus on “Total Fixation Duration” for each stimulus type, which is the sum total duration of fixations (defined as >30 ms) within a given AoI category (e.g., social stimuli) and which is often used as an index to measure preference for one stimulus type over another. In order to account for individual differences in overall looking and differences in AoI size, and to retain all collected data rather than implement an exclusionary gaze time threshold that may produce selection biases, we chose to calculate the “Proportion of Total Fixation Duration” for each task by dividing the fixation time participants devoted to each AoI group (i.e., Social vs. Object) by their total fixation time on the entire screen. This metric therefore indicates the percentage of on screen fixation time each participant directed to each AoI group, and retains comparability with previously published research (Parish-Morris et al., 2013)i. Finally, based on these calculated proportions, we also computed a Social Prioritization score by subtracting the proportion of fixation time devoted to Social AoIs minus the proportion of fixation time devoted to Object AoIs, which is a relevant summary score. Importantly, because each task consisted of more than just Social and Object AoIs (e.g., empty backgrounds), the proportion of fixation time to the Social AoI is not simply the inverse of proportion of fixation time to the Object AoI (and vice versa).
Given the observed group difference in age and IQ, we first assessed whether these variables had an impact on Social Prioritization. Age did not correlate with Social Prioritization across the sample as a whole, or within each group independently, on any of the three tasks, suggesting that these tasks were appropriate choices for testing and producing stable results within the broad age range examined here. Full Scale IQ, however, correlated with Social Prioritization for the ASD group on the static task (r = -.31, p = .016) and the Dynamic Non-Interactive Task (r = -.26, p = .044) but not the Dynamic Interactive task, indicating that their cognitive ability related to task performance on two of the three tasks. In contrast, IQ did not correlate with Social Prioritization for the TD group for any of the three tasks. A standard approach in case of between-group IQ differences is to covary IQ in an ANCOVA. This common practice increases Type 2 error, however, especially in cases where the correlation between IQ and the dependent variable is not homogeneous across groups (Dennis et al., 2009; Miller & Chapman, 2001). Since the field usually provides ANCOVA results for situations like ours, we ran all analyses with and without covarying IQ and found that the pattern of significant and non-significant effects did not differ. We also re-ran all analyses after excluding the eight participants with ASD with Full Scale IQs under 70, and the results did not differ. In what follows, we report the results of the ANOVA, which are more reliable in this context.
Results
A repeated-measures ANOVA with Task (Static, Dynamic, Interactive) and Stimulus-Category (Social, Object) as within-group variables and with Diagnostic Group (ASD vs. TD) as a between-groups variable was used to investigate the potential effect of task on group differences in looking to social vs. object stimuli (see descriptive statistics in Table 2). Importantly, because the collective size of the social and object AoIs differs both across and within the three tasks, any main effects of Task and Stimulus Category and the interaction between them are not interpretable. For instance, because the object AoIs collectively comprise much more of the screen on the static and the dynamic non-interactive tasks relative to the dynamic interactive task, the lower proportion of object attention by both groups in the dynamic interactive task (see Table 2) may be driven by the smaller object AoIs on this task rather than reflecting an effect of the task itself. Thus, because such differences render main and interactive effects of Task and Stimulus Category uninterpretable, and because the primary purpose of this study is to examine the effects of stimulus type on social attention in ASD, we focus on reporting and interpreting interactions involving Diagnostic group.
Table 2. Average percentage of on screen fixation time to Social and Object Areas of Interest (AoI) for each task and each group. Standard Deviations are displayed in brackets. Social and Object do not add up to 100 because the tasks also include content (e.g., empty background) that do not fall into either AoI category.
| Static Task | Dynamic Task | Interactive Task | ||||
|---|---|---|---|---|---|---|
| Social | Object | Social | Object | Social | Object | |
| ASD | 0.20 (0.07) | 0.62 (0.13) | 0.35 (0.21) | 0.60 (0.20) | 0.19 (0.12) | 0.09 (0.05) |
| TDC | 0.24 (0.04) | 0.67 (0.05) | 0.42 (0.14) | 0.55 (0.14) | 0.27 (0.14) | 0.07 (0.04) |
As predicted, we found a Group × Task × Stimulus Category interaction, F(2, 78) = 4.07, p = .021, ηp2 = .094. To investigate the origins of this three-way interaction, we ran post hoc two-way ANOVAs with Stimulus Category (Social, Object) as a within-group variable and Diagnostic Group (ASD vs. TD) as a between-groups variable for each task separately. These analyses revealed that the Group × Stimulus-Category interaction was not significant for the Static task, F(1, 79) = 0.22, p = .64, ηp2 = .003, or for the Dynamic task, F(1, 79) = 1.29, p = .26, ηp2 = .016, but was highly significant for the Interactive task, F(1,79) = 8.35, p = .005, ηp2 = .096. These analyses reveal that the Interactive task was the only one that differed between the ASD and the TD group. Post hoc tests revealed that the interaction in the Interactive task was due to the ASD group spending less time looking at social stimuli, t(79) = -2.69, p = .009, and marginally more time looking at object stimuli, t(79) = 1.90, p = .061, than the TD group.
We recognize, however, that the statistically non-significant results obtained in the Static and Dynamic tasks are not proof that there is no effect. That is, null effects might count in favor of the null hypothesis or they might indicate that the data is insensitive (and should not count one way or another). In order to tease apart these two interpretations, we computed a Bayes Factor (BF) for each task comparing the two groups on their Social Prioritization score. Typically, a BF of greater than 3 is considered to provide substantial evidence against the null, a BF of less than 1/3 is considered to provide substantial evidence in favor of the null, and a BF in between 1/3 and 3 indicates data insensitivity (see Dienes, 2008, 2011, for explanations of Bayes Factors and free online software). In other words, Bayesian statistics allow us to test the weight of evidence in favor of the null model, which, in our case, would be that there is no difference in the Social Prioritization index between ASD and TD participants.
Calculating a BF requires specification of the population mean and standard deviation given a theoretical model (the null model in our case). To establish the null distribution, diagnostic labels were permuted 10,000 times. After each permutation, the mean and standard deviation of the Social Prioritization index were extracted. Collectively, the extracted values allowed us to compute unique and objective estimates of the mean and standard deviation of the null distribution. In line with our parametric statistics, the BF of the Interactive task was 5.94. The BFs of the Static and Dynamic tasks, BF = 0.98 and BF = 0.76 respectively, indicate that the data cannot be taken as evidence for the null hypothesis but should rather be interpreted as insensitive.
Finally, we were interested in comparing the diagnostic utility of each task. We therefore used Receiver Operating Characteristic (ROC) analyses on the Social Prioritization score. The area under the ROC curve was .448 for the Static task (95% CI = .320 to .576, p = .47), .623 for the Dynamic task (95% CI = .495 to .751, p = .089), and .721 for the Interactive task (95% CI = .589 to .853, p = .002; see Figure 2). The area under the ROC curve for the Interactive task was significantly higher than that under the ROC curve of the Static task, z = 2.90, p < .004, but not of the Dynamic task, z = 1.10, p = .27. There was a trend for the area under the ROC curve for the Dynamic task to be higher than that under the ROC curve of the Static task, z = 1.76, p = .078. Taken together, these results suggest that the Interactive was the only task that could adequately distinguish groups.
Figure 2.
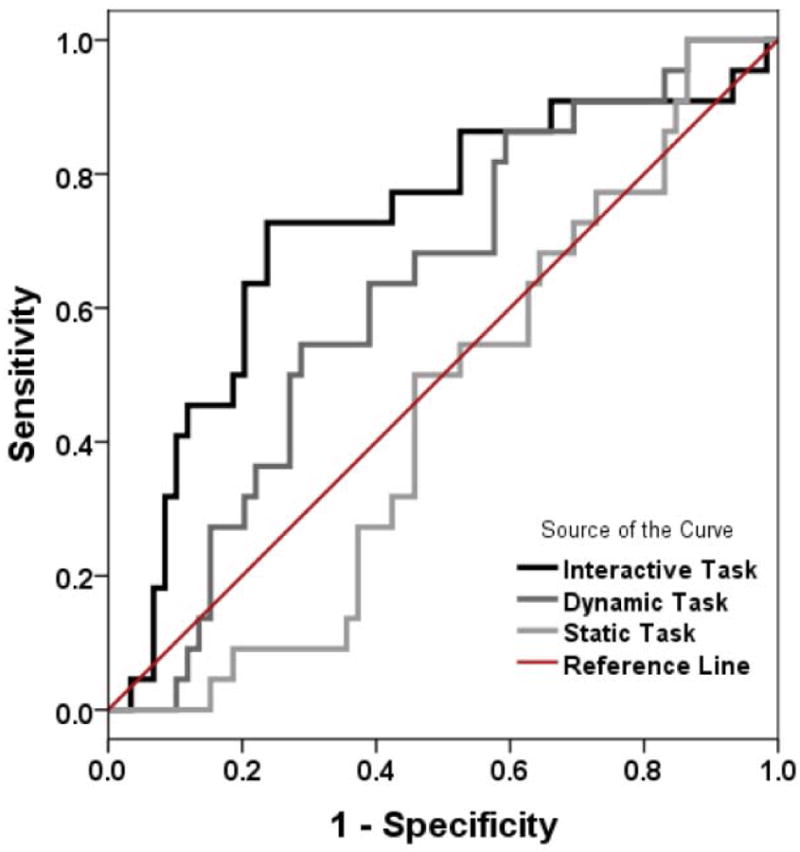
Receiver operating characteristic (ROC) curves comparing the sensitivity and specificity of the Face prioritization index in the Interactive task (black), the Dynamic task (dark gray) and the Static task (light gray).
Discussion
Our comparison of three eye-tracking experiments revealed that all social stimuli are not equally good at differentiating social attention in ASD from typical development. In particular, we found that differences in social attention among individuals with ASD were only apparent when participants watched dynamic social stimuli depicting interaction. Bayesian statistics confirmed that the Interactive task was the only one that proved sensitive and provided helpful insight in determining that the null effects observed in the Static and Dynamic tasks should not be taken as evidence in favor of the null hypothesis but rather indicated that the data was insensitive for detecting group differences. Finally, ROC analyses using Total Fixation Duration to faces revealed that visual attention during the Interactive Visual Exploration task was the best tool to distinguish the ASD and TD groups. Our results are in line with recent work demonstrating that ASD participants fail to increase their fixations as social stimuli increase in salience (Birmingham, Cerf, & Adolphs, 2011; Horlin et al., 2013). Together with the present findings, this literature suggests that ASD is associated with impaired endogenous modulation of social attention under more naturalistic conditions.
The present findings have methodological as well as theoretical implications, as research on social perception in ASD has been both extremely prolific and yet inconsistent. In particular, links between deficits in social functioning and basic impairment in social reward sensitivity appear to be smaller than expected. In response to this, several authors have pointed out that the use of static social stimuli might have caused these relatively small effects and have emphasized the need to focus on more ecologically valid stimuli (Chevallier et al., 2012; Kohls et al., 2012). More generally, researchers in social neuroscience have recently argued in favor of an empirical approach to concerns about ecological validity (Risko, Laidlaw, Freeth, Foulsham, & Kingstone, 2012). These approaches involve the systematic comparison of different types of social stimuli ranging in how much they approximate real social interaction. They reveal that, depending on the task at hand, stimulus type may have a drastic impact on the conclusions that can be drawn from a particular study. Our study adds to this growing literature by being the first to compare various types of eyetracking stimuli in a large sample of participants and supports the conclusion that ecological validity is a key factor to consider for eyetracking studies in ASD.
In addition, it is important to note that interactive and dynamic stimuli might be best at predicting how children actually behave in real-world situations, which are more similar to an “Interactive task” than to a “Static task” (Noris, Nadel, Barker, Hadjikhani, & Billard, 2012). Indeed, people or faces depicted in isolation are “social” only in the sense that they represent social beings, but they are not social in the sense of depicting social behavior. Relatively similar “social attention” to static or even dynamic displays of a social individual but reduced attention to social interaction might suggest a greater deficit in ASD in attending to social actions rather than just social beings. Employing more ecological stimuli in future research thus has the potential to reduce the gap between children's performance in lab-based settings and their actual social skills in everyday life (see e.g., Klin, Jones, Schultz, & Volkmar, 2003).
Although the present study only found evidence of reduced social attention by the ASD group in the task depicting dynamic interaction, many previous tasks using static and dynamic non-interactive stimuli have found such effects (for reviews, see Falck-Ytter, Bölte & Gredebäck, 2013; Guillion, Hadjikhani, Baduel & Roge, 2014). Thus, ecological validity is likely not the only factor implicated in whether or not tasks are sensitive for eliciting social attention differences in ASD, and it is possible that the static and dynamic non-interactive tasks used may have been lacking on these factors. For instance, the static visual exploration task in this study did not elicit reduced social attention in the ASD group despite being based upon a prior task that found such effects (Sasson et al., 2008; Sasson, Elison, Turner-Brown, Dichter, & Bodfish, 2011). However, the task used here differed in that it was simplified to include only 12 images per array compared to the 24 included in the original task, and a recent study found social attention differences in ASD when 24 items were included but not 12 (Wang, Xu, Jiang, Zhao, Hurlemann & Adolphs, 2014). Further, the social attention outcome variable used here differed from the varied metrics of visual attention included in the Sasson studies. Thus, seemingly small changes in task construction and the outcome variables pursued appear capable of producing differences on task results.
It is also important to highlight that the three tasks used here varied on more than just their relative ecological validity. In particular, our visual stimuli differed on motion, use of gestures, communicative intentions between people, amount, type and ratio of social and object content, and task repetition and duration. Future work should investigate which of these and other factors is key to eliciting deficits in social attention. Based on the current study, we can merely conclude that there is something about the interactive scenes included in this study that makes them more compelling and better at distinguishing groups than the other two tasks used here. Arguably, since the dynamic and the interactive tasks both contained motion, it is unlikely that this factor alone is responsible for the greater sensitivity of the interactive task. Animal work suggests that continuing animation with coherent motion sequences contributes particularly well to the reward potential of a visual stimulus (Blatter & Schultz, 2006; Schultz, 2006), and that pictures containing social gestures of conspecifics have an especially high reinforcement effect (Butler & Woolpy, 1963; Humphrey, 1972). Future work may more systematically examine which properties of the interactive task underlie its increased ability to discriminate groups. Further, the size of the AOIs for social and object stimuli varied in size between tasks, precluding the interpretation of main effects of task and stimulus category, as well as a possible task by stimulus category interactions. Given the aims of the study, we thus chose to focus our analyses on group effects both within and between tasks, which are not confounded by varying AOI sizes. However, future studies interested in absolute differences in social and object attention between and within tasks varying on ecological validity may want to use equivalent AOI sizes across tasks and content categories, or to standardize AOI sizes within analyses. Comparing across tasks that are identical except in their degree of ecological validity would allow us to more definitively determine how much this factor alone affects social attention patterns in ASD.
In conclusion, the use of eye-tracking paradigms to evaluate various gaze behaviors is growing across multiple fields of study. It is important to note, therefore, that not all eye-tracking paradigms are equally good at measuring social attention in ASD. Dynamic stimuli appear to be better than static images for measuring social response, and, in particular, highly ecological paradigms presenting actual interactive scenes were found to be optimal stimuli.
Acknowledgments
This study was funded by grants from the Pennsylvania Department of Health (SAP # 4100047863) and the National Institute of Mental Health (RC1MH08879) awarded to the last author. The first author was also partially supported by the Fondation Roger de Spoelberch, ANR-10-LABX-0087 IEC and by ANR-10-IDEX-0001-02 PSL*. Finally, the authors wish to warmly thank all the children and families who took part in this study and Valentin Wyart for his valuable statistical input.
Footnotes
After passing through the I-VT fixation filter, the average usable percentage of gaze data (total fixation duration on the full screen divided by the total length of the experiment) did not differ between groups for the Static Visual Exploration Task or the Interactive Visual Exploration task (both ps = ns). In one task (Dynamic Visual Exploration), children with ASD contributed slightly less useable gaze data than TD (70% vs 77%). To determine whether overall attention to the screen had an impacted on the results, we conducted an analysis covarying total fixation to the fullscreen. This analysis produced the same pattern of results, which confirms that our use of proportions is appropriate here.
References
- Bar-Haim Y, Shulman C, Lamy D, Reuveni A. Attention to Eyes and Mouth in High-Functioning Children with Autism. Journal of Autism and Developmental Disorders. 2006;36(1):131–137. doi: 10.1007/s10803-005-0046-1. [DOI] [PubMed] [Google Scholar]
- Birmingham E, Cerf M, Adolphs R. Comparing social attention in autism and amygdala lesions: Effects of stimulus and task condition. Social Neuroscience. 2011;6(5-6):420–435. doi: 10.1080/17470919.2011.561547. [DOI] [PMC free article] [PubMed] [Google Scholar]
- Blatter K, Schultz W. Rewarding properties of visual stimuli. Experimental Brain Research. 2006;168(4):541–546. doi: 10.1007/s00221-005-0114-y. [DOI] [PubMed] [Google Scholar]
- Boyd BA, Conroy MA, Mancil GR, Nakao T, Alter PJ. Effects of circumscribed interests on the social behaviors of children with autism spectrum disorders. Journal of Autism and Developmental Disorders. 2007;37(8):1550–1561. doi: 10.1007/s10803-006-0286-8. [DOI] [PubMed] [Google Scholar]
- Butler RA, Woolpy JH. Visual attention in the rhesus monkey. Journal of Comparative and Physiological Psychology. 1963;56(2):324. doi: 10.1037/h0046717. [DOI] [PubMed] [Google Scholar]
- Chawarska K, Macari S, Shic F. Context modulates attention to social scenes in toddlers with autism. Journal of Child Psychology and Psychiatry. 2012;53(8):903–913. doi: 10.1111/j.1469-7610.2012.02538.x. [DOI] [PMC free article] [PubMed] [Google Scholar]
- Chevallier C, Kohls G, Troiani V, Brodkin ES, Schultz RT. The social motivation theory of autism. Trends in Cognitive Sciences. 2012 doi: 10.1016/j.tics.2012.02.007. [DOI] [PMC free article] [PubMed] [Google Scholar]
- Dalton KM, Nacewicz BM, Johnstone T, Schaefer HS, Gernsbacher MA, Goldsmith HH, et al. Davidson RJ. Gaze fixation and the neural circuitry of face processing in autism. Nature Neuroscience. 2005;8(4):519–526. doi: 10.1038/nn1421. [DOI] [PMC free article] [PubMed] [Google Scholar]
- Dawson G, Webb S, McPartland J. Understanding the nature of face processing impairment in autism: Insights from behavioral and electrophysiological studies. Developmental Neuropsychology. 2005;27(3):403–424. doi: 10.1207/s15326942dn2703_6. [DOI] [PubMed] [Google Scholar]
- Dennis M, Francis DJ, Cirino PT, Schachar R, Barnes MA, Fletcher JM. Why IQ is not a covariate in cognitive studies of neurodevelopmental disorders. Journal of the International Neuropsychological Society: JINS. 2009;15(3):331–343. doi: 10.1017/S1355617709090481. [DOI] [PMC free article] [PubMed] [Google Scholar]
- Dichter GS, Richey JA, Rittenberg AM, Sabatino A, Bodfish JW. Reward Circuitry Function in Autism During Face Anticipation and Outcomes. Journal of Autism and Developmental Disorders. 2012;42(2):147–160. doi: 10.1007/s10803-011-1221-1. [DOI] [PMC free article] [PubMed] [Google Scholar]
- Dienes Z. Understanding psychology as a science: An introduction to scientific and statistical inference. 2008 Retrieved from http://philpapers.org/rec/DIEUPA.
- Dienes Z. Bayesian versus orthodox statistics: Which side are you on? Perspectives on Psychological Science. 2011;6(3):274–290. doi: 10.1177/1745691611406920. [DOI] [PubMed] [Google Scholar]
- Elliott C. Differential Ability Scales-II (DAS-II) San Antonio, Texas: The Psychological Corporation; 2007. Retrieved from http://www.pearsonassessments.com/HAIWEB/Cultures/en-us/Productdetail.htm?Pid=015-8338-820. [Google Scholar]
- Falck-Ytter T, Bölte S, Gredebäck G. Eye tracking in early autism research. Journal of Neurodevelopmental Disorders. 2013;528(1) doi: 10.1186/1866-1955-5-28. [DOI] [PMC free article] [PubMed] [Google Scholar]
- Falck-Ytter T, von Hofsten C. How special is social looking in ASD: a review. Progress in Brain Research. 2010;189:209–222. doi: 10.1016/B978-0-444-53884-0.00026-9. [DOI] [PubMed] [Google Scholar]
- Fletcher-Watson S, Leekam SR, Benson V, Frank MC, Findlay JM. Eye-movements reveal attention to social information in autism spectrum disorder. Neuropsychologia. 2009;47(1):248–257. doi: 10.1016/j.neuropsychologia.2008.07.016. [DOI] [PubMed] [Google Scholar]
- Freeth M, Chapman P, Ropar D, Mitchell P. Do gaze cues in complex scenes capture and direct the attention of high functioning adolescents with ASD? Evidence from eye-tracking. Journal of Autism and Developmental Disorders. 2010;40(5):534–547. doi: 10.1007/s10803-009-0893-2. [DOI] [PubMed] [Google Scholar]
- Guillon Q, Hadjikhani N, Baduel S, Rogé B. Visual social attention in autism spectrum disorder: Insights from eye tracking studies. Neuroscience & Biobehavioral Reviews. 2014;42:279–297. doi: 10.1016/j.neubiorev.2014.03.013. [DOI] [PubMed] [Google Scholar]
- Hanley M, McPhillips M, Mulhern G, Riby DM. Spontaneous attention to faces in Asperger Syndrome using ecologically valid static stimuli. Autism. 2012 doi: 10.1177/1362361312456746. Retrieved from http://aut.sagepub.com/content/early/2012/09/11/1362361312456746.abstract. [DOI] [PubMed]
- Horlin C, Falkmer M, Fitzgerald P, Leung D, Ordqvist A, Falkmer T. The influence of static versus naturalistic stimuli on face processing in children with and without Asperger syndrome or high-functioning autism. Research in Autism Spectrum Disorders. 2013;7(12):1617–1624. [Google Scholar]
- Humphrey NK. “Interest” and ‘pleasure’: two determinants of a monkey's visual preferences. Perception. 1972;1:395–416. doi: 10.1068/p010395. [DOI] [PubMed] [Google Scholar]
- Klin A, Jones W, Schultz R, Volkmar F. The enactive mind, or from actions to cognition: lessons from autism. Philosophical Transactions: Biological Sciences. 2003;358(1430):345–360. doi: 10.1098/rstb.2002.1202. [DOI] [PMC free article] [PubMed] [Google Scholar]
- Klin A, Jones W, Schultz R, Volkmar F, Cohen D. Visual Fixation Patterns During Viewing of Naturalistic Social Situations as Predictors of Social Competence in Individuals With Autism. Archives of General Psychiatry. 2002;59(9):809–816. doi: 10.1001/archpsyc.59.9.809. [DOI] [PubMed] [Google Scholar]
- Kohls G, Chevallier C, Troiani V, Schultz RT. Social ‘wanting’ dysfunction in autism: neurobiological underpinnings and treatment implications. J Neurodevelopmental Disord. 2012;4(10) doi: 10.1186/1866-1955-4-10. Retrieved from http://www.biomedcentral.com/content/pdf/1866-1955-4-10.pdf. [DOI] [PMC free article] [PubMed] [Google Scholar]
- Miller GA, Chapman JP. Misunderstanding analysis of covariance. Journal of Abnormal Psychology. 2001;110(1):40. doi: 10.1037//0021-843x.110.1.40. [DOI] [PubMed] [Google Scholar]
- Noris B, Nadel J, Barker M, Hadjikhani N, Billard A. Investigating gaze of children with ASD in naturalistic settings. PloS One. 2012;7(9):e44144. doi: 10.1371/journal.pone.0044144. [DOI] [PMC free article] [PubMed] [Google Scholar]
- Parish-Morris J, Chevallier C, Tonge N, Letzen J, Pandey J, Schultz RT. Visual attention to dynamic faces and objects is linked to face processing skills: a combined study of children with autism and controls. Frontiers in Psychology. 2013;4 doi: 10.3389/fpsyg.2013.00185. Retrieved from http://www.ncbi.nlm.nih.gov/pmc/articles/PMC3622030/ [DOI] [PMC free article] [PubMed] [Google Scholar]
- Pelphrey KA, Sasson NJ, Reznick JS, Paul G, Goldman BD, Piven J. Visual scanning of faces in autism. Journal of Autism and Developmental Disorders. 2002;32(4):249–261. doi: 10.1023/a:1016374617369. [DOI] [PubMed] [Google Scholar]
- Riby D, Hancock PJ. Looking at movies and cartoons: eye-tracking evidence from Williams syndrome and autism. Journal of Intellectual Disability Research. 2009;53(2):169–181. doi: 10.1111/j.1365-2788.2008.01142.x. [DOI] [PubMed] [Google Scholar]
- Risko EF, Laidlaw KE, Freeth M, Foulsham T, Kingstone A. Social attention with real versus reel stimuli: toward an empirical approach to concerns about ecological validity. Frontiers in Human Neuroscience. 2012;6 doi: 10.3389/fnhum.2012.00143. Retrieved from http://www.ncbi.nlm.nih.gov/pmc/articles/PMC3360477/ [DOI] [PMC free article] [PubMed] [Google Scholar]
- Saitovitch A, Bargiacchi A, Chabane N, Philippe A, Samson Y, Zilbovicius M. Studying Gaze abnormalities in autism, Which type of stimulus to use. Open Journal of Psychiatry. 2013;3:32–38. [Google Scholar]
- Sasson NJ, Touchstone EW. Visual attention to competing social and object images by preschool children with autism spectrum disorder. Journal of Autism and Developmental Disorders. 2014;44:584–592. doi: 10.1007/s10803-013-1910-z. [DOI] [PubMed] [Google Scholar]
- Sasson NJ, Elison JT, Turner-Brown LM, Dichter GS, Bodfish JW. Brief report: Circumscribed attention in young children with autism. Journal of Autism and Developmental Disorders. 2011;41(2):242–247. doi: 10.1007/s10803-010-1038-3. [DOI] [PMC free article] [PubMed] [Google Scholar]
- Sasson NJ, Turner Brown LM, Holtzclaw TN, Lam KSL, Bodfish JW. Children with autism demonstrate circumscribed attention during passive viewing of complex social and nonsocial picture arrays. Autism Research. 2008;1(1):31–42. doi: 10.1002/aur.4. [DOI] [PMC free article] [PubMed] [Google Scholar]
- Schultz W. Behavioral theories and the neurophysiology of reward. Annu Rev Psychol. 2006;57:87–115. doi: 10.1146/annurev.psych.56.091103.070229. [DOI] [PubMed] [Google Scholar]
- South M, Ozonoff S, McMahon WM. Repetitive behavior profiles in Asperger syndrome and high-functioning autism. Journal of Autism and Developmental Disorders. 2005;35(2):145–158. doi: 10.1007/s10803-004-1992-8. [DOI] [PubMed] [Google Scholar]
- Speer LL, Cook AE, McMahon WM, Clark E. Face processing in children with autism Effects of stimulus contents and type. Autism. 2007;11(3):265–277. doi: 10.1177/1362361307076925. [DOI] [PubMed] [Google Scholar]
- Spezio ML, Adolphs R, Hurley RS, Piven J. Abnormal use of facial information in high-functioning autism. Journal of Autism and Developmental Disorders. 2007;37(5):929–939. doi: 10.1007/s10803-006-0232-9. [DOI] [PubMed] [Google Scholar]
- Turner-Brown LM, Lam KSL, Holtzclaw TN, Dichter GS, Bodfish JW. Phenomenology and measurement of circumscribed interests in autism spectrum disorders. Autism. 2011;15(4):437–456. doi: 10.1177/1362361310386507. [DOI] [PMC free article] [PubMed] [Google Scholar]
- Van der Geest JN, Kemner C, Camfferman G, Verbaten MN, Van Engeland H. Looking at images with human figures: comparison between autistic and normal children. Journal of Autism and Developmental Disorders. 2002;32(2):69–75. doi: 10.1023/a:1014832420206. [DOI] [PubMed] [Google Scholar]
- Van der Geest JN, Kemner C, Verbaten MN, Van Engeland H. Gaze behavior of children with pervasive developmental disorder toward human faces: a fixation time study. Journal of Child Psychology and Psychiatry. 2002;43(5):669–678. doi: 10.1111/1469-7610.00055. [DOI] [PubMed] [Google Scholar]
- Wang S, Xu J, Jiang M, Zhao Q, Hurlemann R, Adolphs R. Autism spectrum disorder, but not amygdala lesions, impairs social attention in visual search. Neuropsychologia. 2014;63:259–274. doi: 10.1016/j.neuropsychologia.2014.09.002. [DOI] [PMC free article] [PubMed] [Google Scholar]
- Weisberg J, Milleville SC, Kenworthy L, Wallace GL, Gotts SJ, Beauchamp MS, Martin A. Social perception in autism spectrum disorders: impaired category selectivity for dynamic but not static images in ventral temporal cortex. Cerebral Cortex. 2012 doi: 10.1093/cercor/bhs276. Retrieved from http://cercor.oxfordjournals.org/content/early/2012/09/26/cercor.bhs276.short. [DOI] [PMC free article] [PubMed]
- Wolf JM, Tanaka JW, Klaiman C, Cockburn J, Herlihy L, Brown C, et al. Specific impairment of face-processing abilities in children with autism spectrum disorder using the Let's Face It! skills battery. Autism Research. 2008;1(6):329–340. doi: 10.1002/aur.56. [DOI] [PMC free article] [PubMed] [Google Scholar]