Abstract
Purpose
13C magnetic resonance spectroscopy (MRS) of human brain at 7 Tesla (T) may pose patient safety issues due to high RF power deposition for proton decoupling. The purpose of present work is to study the feasibility of in vivo 13C MRS of human brain at 7 T using broadband low RF power proton decoupling.
Methods
Carboxylic/amide 13C MRS of human brain by broadband stochastic proton decoupling was demonstrated on a 7 T scanner. RF safety was evaluated using the finite-difference time-domain method. 13C signal enhancement by nuclear Overhauser effect (NOE) and proton decoupling was evaluated in both phantoms and in vivo.
Results
At 7 T, the peak amplitude of carboxylic/amide 13C signals was increased by a factor of greater than 4 due to the combined effects of NOE and proton decoupling. The 7 T 13C MRS technique used decoupling power and average transmit power of less than 35 W and 3.6 W, respectively.
Conclusion
In vivo 13C MRS studies of human brain can be performed at 7 T well below the RF safety threshold by detecting carboxylic/amide carbons with broadband stochastic proton decoupling.
Keywords: 13C MRS, human brain, stochastic decoupling, 7 Tesla (7 T)
INTRODUCTION
Carbon-13 (13C) magnetic resonance spectroscopy (MRS), combined with infusion of 13C-labeled substrates, is an outstanding method for studying human brain metabolism. The most common practice in 13C MRS of human brain is to detect alkanyl carbons of major metabolites in the spectral range of 20-60 ppm during infusion of 13C labeled substrates such as [1-13C]glucose (1-3), [2-13C]acetate (4, 5), and [3-13C]lactate (5).
One of the technical challenges associated with alkanyl carbons is the large 1H-13C scalar coupling (1JCH = 125-145 Hz); a considerable amount of radio frequency (RF) power is required for proton decoupling to satisfy the condition of decoupling pulse γB2 >> 1JCH (6). In previous 13C MRS studies of human brain at 3 Tesla (T) (6, 7) and 4 T (8), special considerations have been made to optimize pulse sequence and decoupling power in order to meet safety guidelines of local and average specific absorption rates (SAR) (9, 10). The demand for higher decoupling power for alkanyl carbons on 7 T scanners has raised an RF safety issue and become the major hurdle for 13C MRS of human brains at high magnetic fields in general. Although 7 T 13C MRS has been used to study human muscle (11, 12), 13C MRS of human brain on 7 T scanners has not been reported except one preliminary study (13).
As an alternative that avoids high decoupling power, we developed a strategy for in vivo 13C MRS that uses [2-13C]glucose infusion and detects its primary metabolic product signals in the carboxyl/amide region (14). Because the carboxylic/amide carbons are only coupled to protons via very weak long-range 1H-13C scalar couplings, these couplings can be effectively decoupled using broadband stochastic decoupling with very low RF power. Our 3 T studies (15, 16) on human brain found that both half-volume and volume quadrature proton coils can be used for this purpose. 13C resonances of glutamate (Glu), glutamine (Gln), aspartate (Asp), N-acetylaspartate (NAA), and gamma-aminobutyric acid (GABA) in the carboxylic/amide spectral region spanning the 170-185 ppm range were detected in the 3 T studies. A very important advantage of this approach lies in the observation that the resonances of major metabolites do not overlap with the 13C signal from the carboxylic carbons of lipids (centered at 172 ppm). The lack of lipid interference in the carboxylic/amide region has proven to be highly valuable for 13C MRS of other organs/tissues as well (17).
The purpose of present study is to determine the feasibility of acquiring 13C spectra of human brain with [2-13C]glucose infusion and broadband stochastic proton decoupling at 7 T. A home-built RF coil assembly and custom-designed RF interface device were used. RF magnetic (B1) and electric fields inside a high resolution human model were evaluated using a commercial finite difference time domain (FDTD) software package (Remcom, State College, PA, USA). Local and average specific absorption rates (SAR) were analyzed using the results from computer simulations and experimental parameters. Parameters of the 13C sequence, nuclear Overhauser effect (NOE), and proton decoupling were optimized to meet the requirements of wider chemical shift dispersion at 7 T. Natural abundance 13C spectra from a phantom were acquired first to validate the setup of the hardware and pulse sequence. In vivo 13C spectra were obtained from the occipital lobe of healthy volunteers. 13C signal peak amplitude enhancement by NOE and low power broadband stochastic proton decoupling were also evaluated based on the results from the phantom and human subjects.
METHODS
Hardware
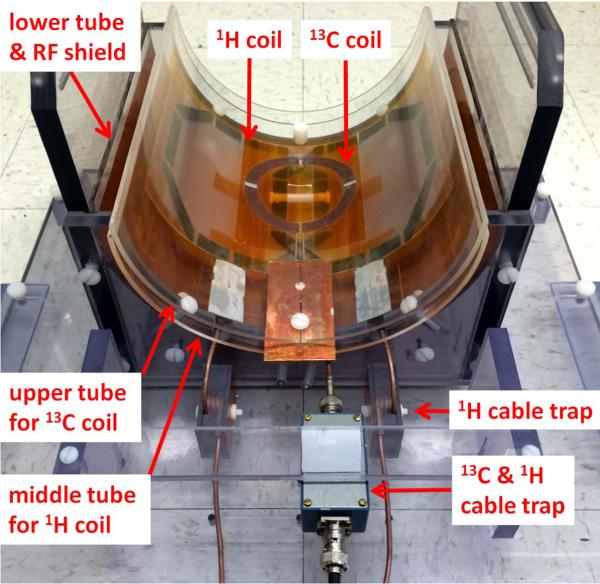
In vivo 13C MRS experiments were performed on a Siemens Magnetom 7 T scanner (Siemens Healthcare, Erlangen, Germany) with VB17 software. An RF coil assembly was built in house comprising a circular 13C coil, a proton quadrature surface coil, and a slotted RF shield (Fig. 1). These were mounted on three vertically stacked semi-cylindrical plastic tubes with a wall thickness of 3.2 mm. A slotted RF shield was mounted on the outer surface of the lower plastic tube (outer diameter = 22.9 cm). The shield was made with copper foil that had six equally spaced narrow gaps. The space between two adjacent gaps was 5.08 cm, and six 1000 pF capacitors were placed across each gap. A proton coil (15) was mounted on the outer surface of the middle tube (outer diameter = 20.3 cm), which was mounted concentrically with the RF shield tube. A 13C coil was formed on the outer surface of the upper plastic tube (outer diameter = 20.3 cm). Unlike the 13C coil used in our previous human studies on 3 T (15), no proton blocking L-C tank circuit was used in this 13C coil.
Figure 1.
RF coil assembly. The 13C coil, the 1H coil (two overlapping octagonal loops), and the RF shield are mounted on the bottom surface of the upper, middle and lower tubes, respectively. Each proton loop has a single-tuned 1H cable trap constructed using the RG-316 cable. A 13C/1H dual-tuned cable trap, built inside a RF shielded box, is connected to the 13C coil.
To suppress unwanted mutual coupling between coil loops due to interference from the conducting shield of the RF cables, cable traps were applied to each coil loop, approximately 5 centimeters from the RF cable feeding point. One singly-tuned cable trap with a resonance frequency of 300 MHz was applied to each proton loop. A double-tuned cable trap with a resonance frequency of 75 and 300 MHz was applied to the 13C coil. At 300 MHz, the isolation between the two proton loops was -20 dB, and the isolation between the 13C coil and both proton loops was -40 dB. At 75 MHz, the isolation between the 13C coil and both proton loops was -38 dB. The coil assembly was connected to the 7 T scanner via an interface box (Quality ElectroDynamics, Mayfield Village, Ohio, USA) that contained transmit-receive switches, pre-amplifiers, and RF filters for both channels, as well as a quadrature combiner for the proton channel.
13C MRS
The recruitment of human subjects (n = 5) and methods of glucose infusion were described previously (15, 16) and summarized here briefly. Two antecubital veins were cannulated, one for infusing [2-13C]D-glucose (20% w/w) and the other for withdrawing blood every 10 min to monitor glucose levels. Glucose infusion started with a bolus infusion rate of 900 ml/h followed by an exponential decay to the rate of 100 ml/h at the 15th minute of infusion. The subsequent infusion rate was adjusted to keep glucose levels at 160-200 mg/dL. A total of 40~50 g of [2-13C]glucose is typically used for a full time course study.
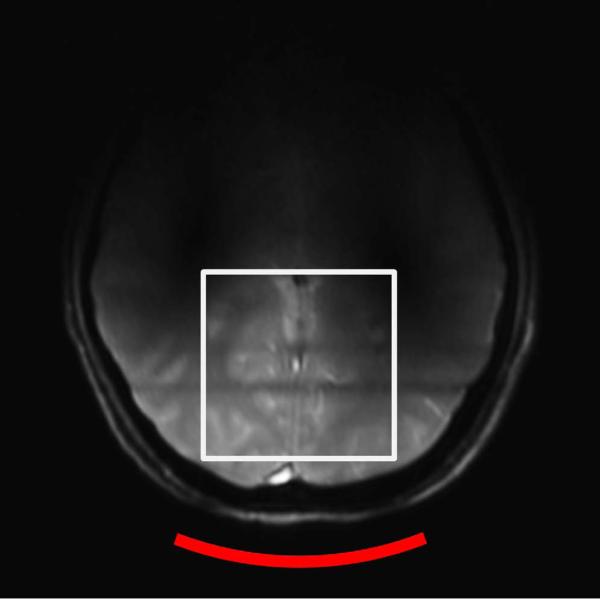
First, a gradient-echo based 3-plane localizer was used to properly position the subject. Static magnetic (B0) field shimming was performed using Siemens 3D Shim tool that includes full first- and, second-order shims, and axial terms of third-order shims (Z3, Z2X, Z2Y, Z(X2-Y2)). A voxel of 6 × 6 × 6 cm3 cube, indicated by a white box in Fig. 2, was selected to perform B0 shimming in the occipital lobe. To evaluate shimming results, a point resolved spectroscopy (PRESS) sequence (18) was used to acquire water spectrum from the shim voxel. Typical water linewidth (full width half maximum) from the 216 cm3 cubical voxel was 13.5 +/- 1 Hz.
Figure 2.
An axial image of the human brain obtained on the 7 T scanner using a gradient echo based three-plane localizer sequence and the quadrature surface coil. TR = 8.6 s, TE = 2.9 s, FOV = 28 cm, and no. of average = 1. The white square box illustrates the location of the cubical shim region (6 × 6 × 6 cm3).
RF power in the proton channel was calibrated for each human subject using a two-dimensionally localized stimulated echo acquisition mode (STEAM) method (19) that generates a one-dimensional profile along a column in the y-direction. The transmit voltage of the excitation pulse (1-ms hard pulse) was adjusted to generate a null along the y-direction at a location ~3 cm deep from the back of the head. This voltage was used as a reference voltage to set transmitting voltages for NOE and proton decoupling pulses. The RF power of the 13C coil was calibrated using a phantom of a three-liter cylindrical bottle filled with distilled water and 6 g NaCl. A 2-cm diameter sphere filled with 1.1 M [1-13C]glucose solution was placed at the bottom of the cylindrical bottle, ~2 cm above the 13C coil. 13C transmit voltage for a 500 μs 90° hard pulse was determined using the maximum signal of the undecoupled [1-13C]glucose peaks. A nominal flip angle of 60° was used for in vivo 13C experiments.
13C spectra were acquired using a modified Siemens FID sequence with hard pulse length = 500 μs, SW = 5 kHz, data points = 1024, and acquisition time = 205 ms. TRs of five and six seconds were used for NAs of 52 and 48, respectively. All in vivo spectra were processed with zero fill = 16 k, Lorentzian Broadening (LB) = -3.0 Hz, and Gaussian Broadening (GB) = 0.2. Heteronuclear NOE between carboxylic/amide carbon and nearby protons was generated using a train of 26 hard pulses (pulse width = 500 μs, nominal flip angle = 180°) that were equally spaced during relaxation time. For stochastic decoupling pulses, the duration of each repetition unit was 500 μs with constant amplitude of 200 Hz. The phase of each repetition unit pulse was randomly assigned to either 0° or 180° (14). All proton pulses were centered at the water signal because both alkanyl protons (H2 at 3.78 ppm, H3 at 2.14 ppm and H4 at 2.46 ppm) and amide protons (HZ at 6.83 ppm and HE at 7.60 ppm) are coupled to glutamine C5 and C1.
Prior to performing human studies, phantom experiments were conducted to evaluate the efficiency of NOE and stochastic decoupling. Because the resonances of glutamine C5 and C1 are 0.2 ppm apart from the aspartate C4 and C1 peaks, respectively, they are most susceptible to imperfect decoupling and static field inhomogeneity. Since glutamine C5 is coupled to both alkanyl and amide protons the quality of glutamine C5 signal is critically dependent on the effectiveness of broadband stochastic proton decoupling. To mimic this chemical environment, we prepared a three-liter cylindrical bottle phantom filled with distilled water and 6 g NaCl. Inside the bottle, a 7-cm sphere filled with 200 mM glutamine and 200 mM aspartate (pH = 7.0) was attached to the bottom. Water linewidth from the 125 cm3 cube within the sphere was 8.7 Hz. Natural abundance 13C spectra of the phantom (nominal flip angle = 60°, TR = 5 s, NA = 52, SW = 5 kHz, number of data = 2048) were acquired.
Numerical Analysis of B1 Field and SAR
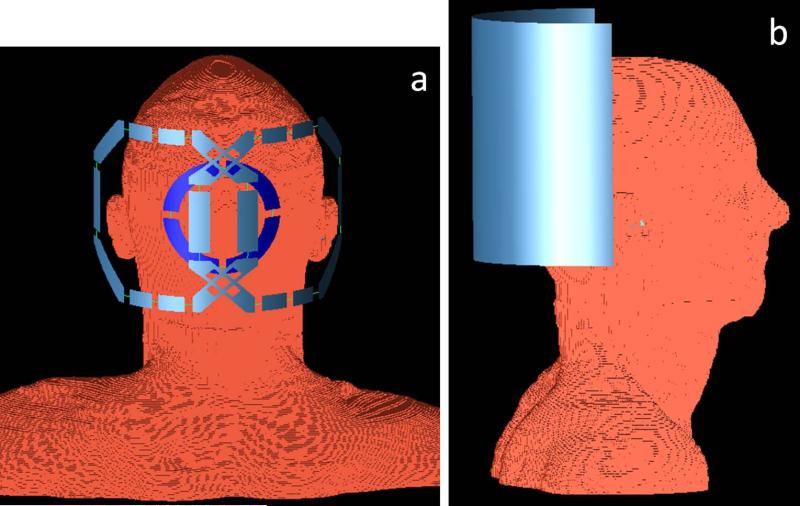
B1 field and SAR distributions of the coil assembly were evaluated using a commercial numerical simulation software package of the finite-difference time-domain (FDTD) method. The computer models of the proton and 13C coils and RF shield were created using Yee cells of FDTD modeling tools according to their actual geometries. A high resolution “Duke” head model (20) was used. A posterior view of the head model and RF coils is shown in Fig. 3a; silver loops represent the proton coil and the blue loop represents the 13C coil. The side view of the models (Fig. 3b) illustrates the geometry of the RF shield. The spatial resolution for all models and the free space was 1 × 1 × 1 mm3. Each proton loop had ten equivalent 12 pF capacitors that were very similar to the average capacitances of 12.5 pF used in the actual coil. Two voltage sources (magnitude = 1.0 V, phase difference = 90°) were placed on proton loops to drive the coil in quadrature mode at 297 MHz. Four 107 pF capacitors were inserted on the 13C coil, which was driven at 74.7 MHz with one voltage source. Eighteen different bones and tissues and their electrical properties at 297 MHz (21) were assigned in the head model. Both B1 and electric fields of the proton coil were calculated at 297 MHz. Based on the result of the B1 field, two circularly-polarized components of the B1 field (B1+ and B1−) were computed. The B1+ field represented the transmit field of the coil, and the B1− field represented the receiving sensitivity profile of the coil. Local SAR due to proton coil was computed by averaging absorbed electric power within a volume of 10 g mass around each cell, and was normalized to 1 W of absorbed RF power inside the head model with 100% duty cycle. Using the normalized result, local SAR generated by proton coil at different power levels and duty cycles was computed. By using the same FDTD software, B1 field and SAR distributions of 13C coil were also calculated at 74.7 MHz.
Figure 3.
Posterior (a) and sagittal (b) views of the three dimensional computer models of coil geometry and human head. The two silver octagonal loops indicate quadrature proton coils, and the blue circular loop indicates the 13C coil. The semi-cylindrical sheet in (b) represents the radio frequency (RF) shield of the coil system.
RESULTS
B1 field and SAR evaluations
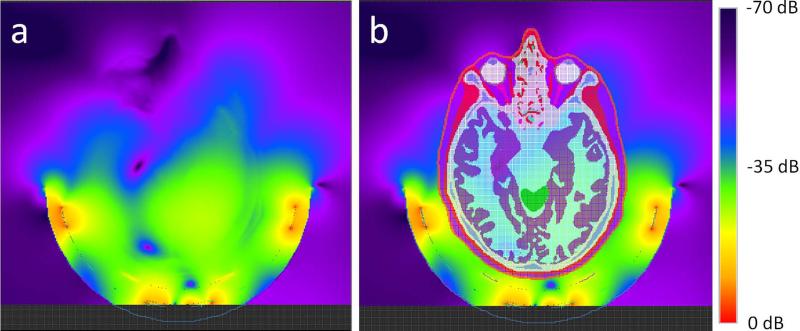
Figure 4a illustrates the simulated B1+ field distribution of the proton coil in an axial plane. To illustrate the area of the head model in the field plot, the anatomical structure of the head model on the same plane was overlaid on the B1+ field plot, as shown in Figure 4b. Log scale was used in the plots, and the upper boundary of the B1+ field was truncated so that more dynamic variation in the deeper region of the brain could be visualized. Because of the truncation, no color plot is shown in the horizontal strip below the 13C coil. For this coil setup, the proton B1+ field distribution in the head model was shifted and became asymmetric with respect to the mid-sagittal plane. The field was stronger and penetrated more deeply on the reader's right side. The B1+ field of the 13C coil was also simulated at 74.7 MHz. The result was a well-known quasi-static B1 field pattern of a circular coil with angular symmetry around the coil axis.
Figure 4.
Calculated B1+ field distribution of the proton coil in an axial plane (a) that cuts through the center of the 13C coil. The plot is in logarithm scale. The upper boundary of the B1+ field display was truncated so that the field further away from the coil could be better visualized. The reference of 0-dB corresponds to the maximum field strength in the truncated display. Due to truncation, the color plot in the region below the 13C coil was not shown. B1+ intensity is asymmetric with respect to the mid-sagittal plane and was shifted to viewer's right side. The anatomical structure of the head model on the same plane was overlaid on the B1+ field plot (b) to illustrate the boundary of the head model in the field plot.
Similar to the asymmetric B1+ field distribution, calculated SAR distribution of the proton coil was also shifted in the same way as the B1+ field. A region containing high local SAR was observed on the reader's right side in the lateral temporal lobe region proximal to where the high B1+ field occurs. After normalization, the maximum local SAR per 10 g tissue was 1.56 W/kg when the total absorbed electrical power inside the human model was 1 W at 100% duty cycle.
The reference voltage of the proton coil was measured for each human subject. The typical value was 105 V, which resulted in a transmit voltage of 210 V (882 W) for NOE and 42 V (35 W) for decoupling. For a scan with TR = 5 s, duty cycle was 0.25% (0.0013 / 5) for NOE pulses and 4.0% (0.2 / 5) for decoupling pulses. Based on the duty cycles and transmit RF power calculated from the transmit voltages, the average transmitting RF power was 3.6 W. Assuming the transmitted power was all absorbed by the human subject, and using the normalized maximum local SAR value of 1.56 W/kg per absorbed watt, the maximum local SAR per 10 g tissue at an average power of 3.6 W was 5.6 W/kg, well below the local SAR limit of 10 W/kg for a local transmit coil (9, 10). Spatially averaged SAR could be estimated by dividing the average RF power of 3.6 W by the average mass of a human head (4 kg). Therefore, the average SAR was 0.9 W/kg (3.6 W / 4.0 kg), which was also well below the average SAR limit of 3.2 W/kg (9, 10). For estimations of local and average SAR, the RF power contribution from the 13C coil was ignored because the duty cycle of the 13C excitation pulse was only 0.01%.
In our evaluations, the maximum local and average SAR were calculated based on the transmit voltages reported by Siemens. Because there was significant power loss on RF cables and RF interface box between the system cabinet and the coil input point, the actual power deposited into the human head is less than the values reported above, which indicates that our SAR analysis had a large safety margin.
Phantom evaluation of NOE and decoupling
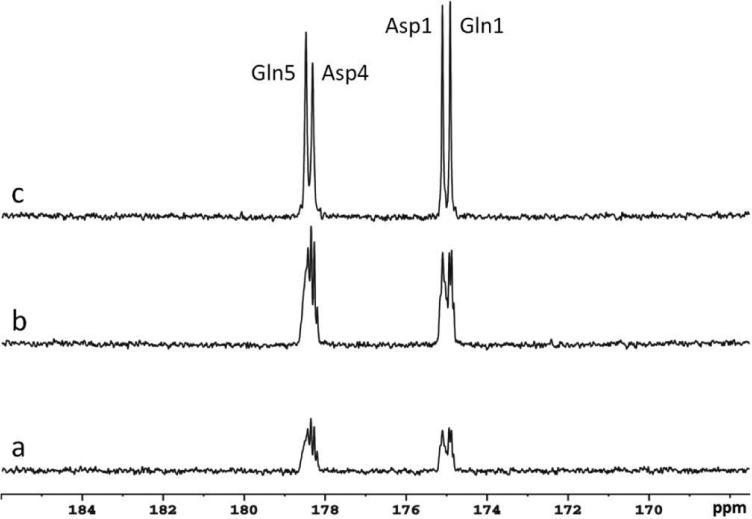
Figure 5 shows natural abundance 13C spectra from the phantom containing 200 mM glutamine and 200 mM aspartate acquired at three different conditions: with neither NOE nor decoupling (Fig. 5a), with NOE only (Fig. 5b), and with both NOE and decoupling (Fig. 5c). Each spectrum was processed with LB = 1.0 Hz. Using the spectrum without NOE and decoupling as a reference, peak amplitude of aspartate C1 (Asp1, 175.0 ppm) was increased by a factor of 2.3 when NOE was on, and by a factor of 5.3 when both NOE and decoupling were on. With proton decoupling, the resonances of glutamine C5 (Glu5, 178.5 ppm) and aspartate C4 (Asp4, 178.3 ppm), as well as that of aspartate C1 (175.0 ppm) and glutamine C1 (Gln1, 174.8 ppm) were clearly resolved. In contrast, Figs 5a and 5b shows that without decoupling spectral resolution was severely degraded even at the high magnetic field strength of 7 T. Well-distinguished spectral peaks indicate that the bandwidth of the decoupling pulses and the applied decoupling power (γB2 = 200 Hz) was adequate to remove long range coupling between remote protons and carboxylic/amide carbons at 7 T. Therefore, the same NOE and decoupling parameters were used in human data acquisitions.
Figure 5.
Natural abundance 13C spectra of glutamine and aspartate phantom under the following conditions: (a) with neither nuclear Overhauser effect (NOE) nor decoupling, (b) with NOE only, and (c) with NOE and decoupling. Each spectrum was acquired with TR = 5 s, NA = 104, BW = 5 kHz, data point = 2048, and processed with Lorentzian broadening (LB) = 1.0 Hz. Stochastic decoupling was performed with a unit repetition time of 500 μs, γB2 = 200 Hz. Gln5: glutamine C5; Gln1: glutamine C1; Asp4: aspartate C4; Asp1: aspartate C1.
In Vivo 13C MRS
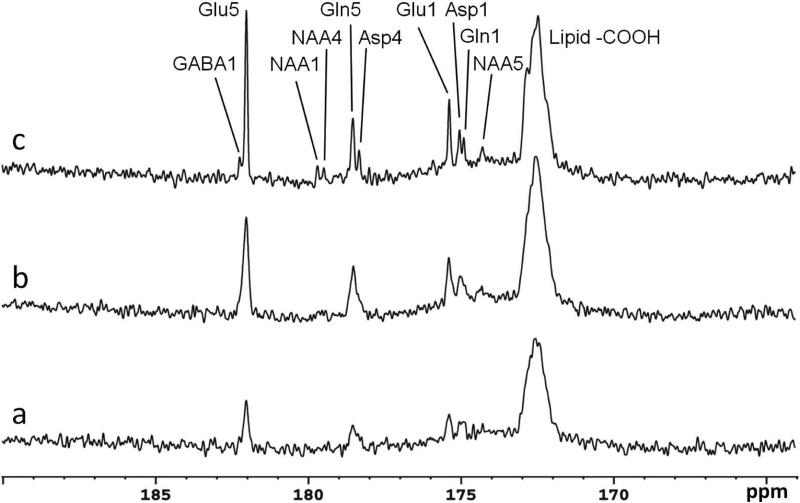
Evaluation of 13C signal enhancement by NOE and proton decoupling was also performed in vivo on two subjects. The result from one subject is shown in Fig 6 where the spectra were acquired at three different conditions: with neither NOE nor decoupling (Fig. 6a), with NOE only (Fig. 6b), and with both NOE and decoupling (Fig. 6c). The spectra were collected over the time period from 60 min to 100 min after [2-13C]glucose infusion began. Each spectrum was averaged over 8.7 min with TR = 5 s and NA = 104. Using the peak amplitude of glutamate C5 (Glu5) in Fig. 6a as a reference, the peak amplitude of glutamate C5 was increased by a factor of 2.3 on average when NOE was on (Fig. 6b), and by a factor of 4.3 when both NOE and decoupling were on (Fig. 6c).
Figure 6.
Spectra obtained from a healthy volunteer under the following conditions: (a) with neither NOE nor decoupling, (b) with NOE only, and (c) with both NOE and decoupling. Each spectrum was acquired with TR = 5 s, NA = 104, BW = 5 kHz, data point = 1024, and processed with LB = -3.0 Hz and GB = 0.2. The spectra were collected over the time period from 60 min to 100 min after [2-13C]glucose infusion began. Using the peak amplitude of glutamate C5 (Glu5) in Fig. 6a as a reference, the peak amplitude of glutamate C5 was increased on average, by a factor of 2.3 when NOE was on (Fig. 6b), and by a factor of 4.3 when both NOE and decoupling were on (Fig. 6c). Asp4, aspartate C4; Asp1, aspartate C1; GABA1, gamma-aminobutyric acid C1; Gln1, glutamine C1; Gln5, glutamine C5; Glu1, glutamate C1; Glu5, glutamate C5; NAA, Nacetylaspartate.
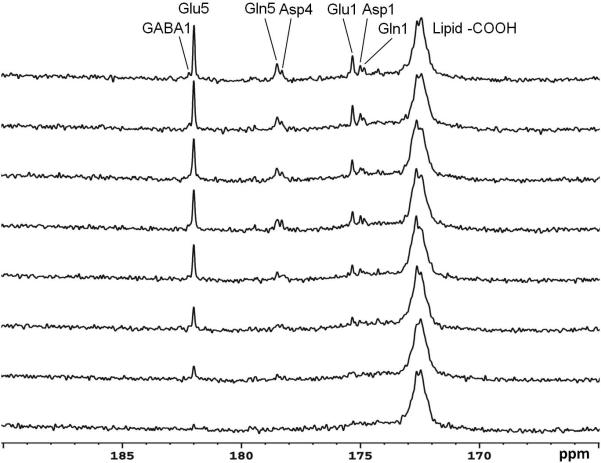
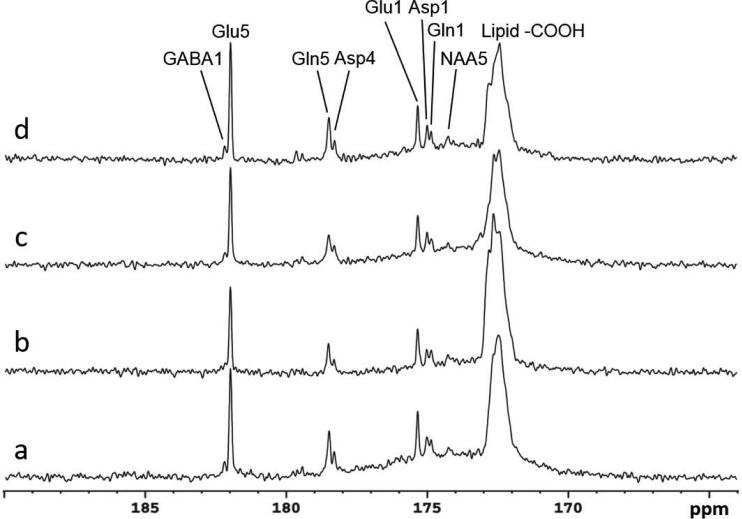
The time course spectra of carboxylic/amide carbons of glutamate, glutamine, aspartate, NAA, and GABA from the occipital lobe of human brain with infusion of [2-13C]glucose are shown in Figure 7. Each spectrum corresponds to an 8.7 minute scan with NA = 104. In the spectra, natural abundance lipid carboxylic carbons (172.5 ppm), 13C labeled glutamate C5 (Glu5, 182.0 ppm) and C1 (Glu1, 175.4 ppm), glutamine C5 (Gln5, 178.5 ppm) and C1 (Gln1, 174.8 ppm), aspartate C4 (Asp4, 178.3 ppm) and C1 (Asp1, 175.0 ppm), and NAA C5 (NAA5, 174.3 ppm) were clearly observed. Notably, GABA C1 (GABA1, 182.2 ppm) was also observed in the time course spectra. After the MRS procedures were optimized we scanned a total of five subjects. Steady state spectra acquired from four subjects are shown in Fig. 8 to demonstrate the reliability of the method. Spectra 8b, 8c, and 8d were accumulated over 17.4 minutes at the end of the 90-minute infusion with TR = 5 s and NA = 208. The spectrum 8a was acquired from a subject using TR = 6 s and NA = 192, accumulated over the last 19.2 minutes of 110-minute infusion. In general, the resonance of GABA C1 was clearly distinguishable from glutamate C5. The fifth subject was used to perform NOE tests and the result was not included in Fig. 8.
Figure 7.
Time course spectra of glutamate, glutamine, and aspartate turnover detected in the occipital lobe during intravenous infusion of [2-13C]glucose. LB = -3.0 Hz and GB = 0.2 were applied. The decoupling power was 35 W and time-averaged decoupling power was 3.6 W. Each spectrum corresponded to an 8.7-minute signal averaging with TR = 5 s and NS = 104. Glutamate C5 (Glu5, 182.0 ppm) and C1 (Glu1, 175.4 ppm), glutamine C5 (Gln5, 178.5 ppm) and C1 (Gln1, 174.9 ppm), aspartate C4 (Asp4, 178.3 ppm) and C1 (Asp1, 175.0 ppm), and gamma-aminobutyric acid (GABA1, 182.3 ppm) were detected. No baseline corrections were made.
Figure 8.
Spectra obtained from four healthy volunteers with the same nuclear Overhauser effect (NOE) and decoupling power settings. The upper traces (b), (c), and (d) are summed from the last 17.4 minutes at the end of infusion with TR = 5 s, NA = 208. The bottom trace (a) is accumulated from a different subject in the last 19.6 minutes of data acquisition with TR = 6 s, NA = 192. All spectra were processed with LB = -3.0 Hz, GB = 0.2. In addition to glutamate C5 (Glu5) and C1 (Glu1), glutamine C5 (Gln5) and C1 (Gln1), and aspartate C4 (Asp4) and C1 (Asp1), N-acetylaspartate C5 (NAA5,174.3 ppm), and gamma-aminobutyric acid C1 (GABA1) were also clearly detected.
DISCUSSION
This study is the first to demonstrate that in vivo 13C MRS of human brain can be performed well below that RF safety threshold at 7 T by detecting carboxylic/amide carbons with broadband stochastic proton decoupling.
Good isolation between the 13C coil and the proton coil is essential for preventing noise injection during proton decoupling. One common method of increasing this isolation is to insert a parallel L-C tank circuit in the 13C conducting loop. An induced current due to proton radiation can then be blocked by the high impedance of the tank circuit tuned at the proton resonance frequency. In our experiments, however, tank circuits were found to be unnecessary. Even without a proton blocking tank circuit, isolation was still excellent, as evidenced by the fact that noise levels of the spectra without decoupling (Figs. 5a and 5b) were the same as that of the spectrum with decoupling (Fig. 5c). The excellent isolation should be attributed to (a) the larger frequency separation of 225 MHz between the 13C and proton nuclei at 7 T, (b) the use of a proton reject filter with 100 dB attenuation, and (c) the use of three cable traps (see Fig. 1).
As shown in Figure 4, the B1+ field of the quadrature surface coil in human head was shifted in the left-right direction. This simulation result is consistent with previous findings of electromagnetic wave behavior in the human head at 7 T (22, 23). It has been well illustrated in early numerical simulations in which local SAR distribution was shifted in the same direction as the B+1 field; the maximum local SAR was in the same region where the maximum B1+ was located (23). Our SAR simulations also found the same phenomenon (data not shown).
Our previous 3 T results (15, 16) showed that although broadband stochastic decoupling is highly resistant to degradation caused by B1+ inhomogeneity a homogeneous B1+ field can significantly enhance the efficiency of broadband stochastic proton decoupling. The shift of the B1+ field shown in Fig. 4 therefore may have had a detrimental effect by causing the left side 13C nuclei to experience a weaker decoupling field. In the future, the proton coil can be positioned with an angular offset so that the sensitive volume of the 13C coil is covered by a more homogeneous proton B1+ field.
Resonance frequencies of protons that are remotely coupled to the carboxylic/amide carbons span a broad spectral range from GABA H3 at 1.91 ppm to the glutamine amide proton at 7.60 ppm. This large range corresponds to a bandwidth of 1700 Hz at 7 T, much wider than that of 728 Hz at 3 T. To cover such a broad frequency range, the pulse width of the NOE pulse and the repetition unit of the stochastic pulse need to be reduced with a corresponding increase in γB2. We found that excellent decoupling results were achieved at 7 T by shortening the repetition unit length of the broadband stochastic decoupling pulse train from 1.2 ms at 3 T (15, 16) to 500 μs at 7 T and by increasing γB2 from 100 Hz at 3 T to 200 Hz at 7 T. As pointed out by our previous study (24) removing the empty frequency range between the alkanyl protons and the amide protons can dramatically reduce the RF power requirement of stochastic decoupling at 11.7 T. This scheme may be utilized for 7 T when a volume coil is used for stochastic proton decoupling. As our current results have shown further improvement of the stochastic decoupling is not necessary when the quadrature proton coil assembly is used at 7 T.
Although effective proton decoupling is essential in resolving overlapping 13C resonances in the carboxylic/amid spectral region poor B0 homogeneity can largely offset the spectral resolution improvement originated from proton decoupling. This is especially the case at high magnetic field strength because both chemical shift separation and susceptibility effect are proportional to B0. With the additional third order shim capability on the 7 T scanner, the average water linewidth measured from a 6 × 6 × 6 cm3 cubic voxel in the occipital lobe of five subjects was 13.6 Hz. As a result glutamine C5 (178.5 ppm) and aspartate C4 (178.3) are consistently resolved (see Figs. 7 and 8). Moreover, the unresolved resonances of aspartate C1 (175.0 ppm) and glutamine C1 (174.8 ppm) at 3 T were clearly resolved in the 7 T spectra. The GABA C1 peak at 182.3 ppm, which was not resolved from glutamate C5 at 3 T, was unambiguously detected at 7 T.
This work demonstrated the feasibility of combining [2-13C]glucose infusion and low power broadband stochastic proton decoupling for in vivo 13C MRS of human brain at 7 T. It opens the possibility of using phased array 13C receive coils for simultaneous SNR enhancement and spatial localization of the irregularly shaped cortical gray matter compartment close to the 13C coils using the newly developed SPLASH technique (25). The information content of carboxylic/amide 13C MRS can also be substantially increased by the use of uniformly 13C-labeled glucose and a second 13C-labeled substrate (26). Work along this direction is currently in progress in our laboratory.
An alternative to heteronuclear decoupling is to acquire 13C MRS data without proton decoupling as demonstrated by a recent 9.4 T study of rodents infused by [1,6-13C2]glucose (27) where both LCModel analysis and high magnetic field strength reduce the effects of spectral overlap caused by undecoupling 1H-13C couplings. A detailed comparison at 7 T between the undecoupling method and our method is beyond the scope of this feasibility study.
In summary, we demonstrated the feasibility of performing 13C MRS of human brain on a 7 T scanner that detected carboxylic/amide carbons of major metabolites with low power broadband stochastic proton decoupling. Local and average SAR values were well below the safety guidelines. 13C signals from metabolites of human brain were significantly enhanced by NOE and low power stochastic decoupling, evidenced by more than 4 times enhancement of glutamate C5 peak height in vivo. GABA C1 was unambiguously detected. Since lipid contamination is nonexistent in the carboxylic/amide spectral region our results open the possibility of combining phased array 13C detection with low power broadband proton decoupling for simultaneous sensitivity enhancement and spatial localization.
ACKNOWLEDGEMENTS
The authors gratefully acknowledge the support of the Intramural Research Program of the National Institute of Mental Health, National Institutes of Health (IRP-NIMH-NIH). The authors thank Dr. Helmut Merkle for coil design consultation and Ms. Ioline Henter for editing the manuscript.
This work was supported by the Intramural Research Program of the National Institute of Mental Health, National Institutes of Health (NIMH-NIH).
Abbreviations
- RF
radio frequency
- SAR
specific absorption rate
- Glc
glucose
- Glu
glutamate
- Gln
glutamine
- Asp
aspartate
- GABA
gamma-aminobutyric acid
- NAA
N-acetylaspartate
- NOE
nuclear Overhauser effect
- FDTD
finite difference time domain
- PRESS
point resolved spectroscopy
- STEAM
stimulated echo acquisition mode
- LB
Lorentzian broadening
- GB
Gaussian broadening
- FASTMAP
fast automatic shimming technique by mapping along projections
Footnotes
Disclosure
The authors have no conflict of interest to disclose, financial or otherwise.
REFERENCES
- 1.Gruetter R, Novotny EJ, Boulware SD, Mason GF, Rothman DL, Shulman GI, Prichard JW, Shulman RG. Localized 13C NMR spectroscopy in the human brain of amino acid labeling from D-[1-13C]glucose. J Neurochem. 1994;63:1377–1385. doi: 10.1046/j.1471-4159.1994.63041377.x. [DOI] [PubMed] [Google Scholar]
- 2.Shen J, Petersen KF, Behar KL, Brown P, Nixon TW, Mason GF, Petroff OAC, Shulman GI, Shulman RG, Rothman DL. Determination of the rate of the glutamate/glutamine cycle in the human brain by in vivo 13C NMR. Proc Natl Acad Sci USA. 1999;96:8235–8240. doi: 10.1073/pnas.96.14.8235. [DOI] [PMC free article] [PubMed] [Google Scholar]
- 3.Bluml S, Hwang JH, Moreno A, Ross B. Novel peak assignments of in vivo 13C MRS in human brain at 1.5 T. J Magn Reson. 2000;143:292–298. doi: 10.1006/jmre.1999.2001. [DOI] [PubMed] [Google Scholar]
- 4.Lebon V, Petersen K, Cline GW, Shen J, Mason GF, Dufour S, Behar KL, Shulman GI, Rothman DL. Astroglial contribution to brain energy metabolism in humans revealed by 13C nuclear magnetic resonance spectroscopy: elucidation of the dominant pathway for neurotransmitter glutamate repletion and measurement of astrocytic oxidative metabolism. J Neurosci. 2002;22:1523–1531. doi: 10.1523/JNEUROSCI.22-05-01523.2002. [DOI] [PMC free article] [PubMed] [Google Scholar]
- 5.Boumezeur F, Petersen KF, Cline GW, Mason GF, Behar KL, Shulman GI, Rothman DL. The contribution of blood lactate to brain energy metabolism in humns measured by dynamic 13C nuclear magnetic resonance spectroscopy. J Neurosci. 2010;30:13983–13991. doi: 10.1523/JNEUROSCI.2040-10.2010. [DOI] [PMC free article] [PubMed] [Google Scholar]
- 6.Barker PB, Golay X, Artemov D, Ouwerkerk R, Smith MA, Shaka AJ. Broadband proton decoupling for in vivo brain spectroscopy in humans. Magn Reson Med. 2001;45:226–232. doi: 10.1002/1522-2594(200102)45:2<226::aid-mrm1031>3.0.co;2-z. [DOI] [PubMed] [Google Scholar]
- 7.Klomp DWJ, Renema WKJ, van der Graaf M, de Galan BE, Kentgens APM, Heerschap A. Sensitivity-enhanced 13C MR spectroscopy of the human brain at 3 Tesla. Magn Reson Med. 2006;55:271–278. doi: 10.1002/mrm.20745. [DOI] [PubMed] [Google Scholar]
- 8.Gruetter R, Adriany G, Merkle H, Andersen PM. Broadband decoupled, 1H-localized 13C MRS of the human brain at 4 Tesla. Magn Reson Med. 1996;36:659–664. doi: 10.1002/mrm.1910360503. [DOI] [PubMed] [Google Scholar]
- 9.Criteria for significant risk investigations of magnetic resonance diagnostic devices. Center for Devices and Radiological Health, Food and Drug Administration; USA: Jun, 2014. [Google Scholar]
- 10.International Electrotechnical Commission . International standard, medical equipment – part 2: particular requirements for the safety of magnetic resonance equipment for medical diagnosis, 2nd revision. Vol. 601. International Electrotechnical Commission; Geneva: 2002. pp. 2–33. [Google Scholar]
- 11.Eulalia SR, Magill AW, Donati G, Meyerspeer M, Xin L, Ipek O, Gruetter R. A double-quadrature radiofrequency coil design for proton-decoupled carbon-13 magnetic resonance spectroscopy in humans at 7 T. Magn Reson Med. doi: 10.1002/mrm.25171. DOI 10.1002/mrm.25171. [DOI] [PubMed] [Google Scholar]
- 12.de Graaf RA, De Feyter HM, Rothman DL. High-sensitivity, broadband-decoupled 13C MR spectroscopy in humans at 7 T using two-dimensional heteronuclear single-quantum coherence. Magn Reson Med. 2014 Aug 31; doi: 10.1002/mrm.25470. doi: 10.1002/mrm.25470. [DOI] [PMC free article] [PubMed] [Google Scholar]
- 13.Gruetter R, Adriany G, Andersen P, Ugurbil K. Feasibility of 13C NMR spectroscopy of the human brain at 7 Tesla using adiabatic 1H decoupling.. Proceedings of the 19th Annual Meeting of ISMRM; Glasgow, United Kingdom. 2001. p. 627. [Google Scholar]
- 14.Li S, Yang J, Shen J. Novel strategy for cerebral 13C MRS using very low RF power for proton decoupling. Magn Reson Med. 2007;57:265–271. doi: 10.1002/mrm.21148. [DOI] [PubMed] [Google Scholar]
- 15.Li S, Zhang Y, Wang S, Yang J, Ferraris Araneta M, Farris A, Johnson C, Fox S, Innis R, Shen J. In Vivo 13C magnetic resonance spectroscopy of human brain on a clinical 3 T scanner using [2-13C]glucose infusion and low-power stochastic decoupling. Magn Reson Med. 2009;62:565–573. doi: 10.1002/mrm.22044. [DOI] [PMC free article] [PubMed] [Google Scholar]
- 16.Li S, Zhang Y, Wang S, Ferraris Araneta M, Johnson CS, Xiang Y, Innis RB, Shen J. 13C MRS of occipital and frontal lobe at 3 T using a volume coil for stochastic proton decoupling. NMR Biomed. 2010;23:977–985. doi: 10.1002/nbm.1524. [DOI] [PMC free article] [PubMed] [Google Scholar]
- 17.Befroy DE, Perry RJ, Jain N, Dufour S, Cline GW, Trimmer JK, Brosnan J, Rothman DL, Petersen KF, Shulman GI. Direct assessment of hepatic mitochondrial oxidative and anaplerotic fluxes in humans using dynamic 13C magnetic resonance spectroscopy. Nature Med. 2014;20:98–104. doi: 10.1038/nm.3415. [DOI] [PMC free article] [PubMed] [Google Scholar]
- 18.Bottomley PA. Spatial localization in NMR spectroscopy in vivo. Ann NY Acad Sci. 1987;508:333–348. doi: 10.1111/j.1749-6632.1987.tb32915.x. [DOI] [PubMed] [Google Scholar]
- 19.Frahm J, Merboldt KD, Hanicke W. Localized proton spectroscopy using stimulated echoes. J Magn Reson. 1987;72:502–508. doi: 10.1002/mrm.1910170113. [DOI] [PubMed] [Google Scholar]
- 20.Christ A, Kainz W, Hahn EG, Honegger K, Zefferer M, Neufeld E, Rascher W, Janka R, Bautz W, Chen J, Kiefer B, Schmitt P, Hollenbach HP, Shen J, Oberle M, Szczerba D, Kam A, Guag JW, Kuster N. The virtual family—Development of surface-based anatomical models of two adults and two children for dosimetric simulations. Phys Med Biol. 2010;55:N23–N38. doi: 10.1088/0031-9155/55/2/N01. [DOI] [PubMed] [Google Scholar]
- 21.Gabriel C. Compilation of the dielectric properties of body tissues at RF and microwave frequencies. Technical Report, Brooks Air Force AL/OE-TR-1996-0037 [Google Scholar]
- 22.Wang J, Yang QX, Zhang X, Collins CM, Smith MB, Zhu XH, Adriany G, Ugurbil K, Chen W. Polarization of the RF field in a human head at high field: a study with a quadrature surface coil at 7.0 T. Magn Reson Med. 2002;48:362–369. doi: 10.1002/mrm.10197. [DOI] [PubMed] [Google Scholar]
- 23.Collins MC, Liu W, Wang J, Grutter R, Vaughan JT, Ugurbil K, Smith MB. Temperature and SAR calculations for a human head within volume and surface coils at 64 and 300 MHz. J Magn Reson Imaging. 2004;19:650–656. doi: 10.1002/jmri.20041. [DOI] [PubMed] [Google Scholar]
- 24.Xiang Y, Shen J. Windowed stochastic proton decoupling for in vivo 13C magnetic resonance spectroscopy with reduced RF power deposition. J Magn Reson Imaging. 2011:968–972. doi: 10.1002/jmri.22667. [DOI] [PMC free article] [PubMed] [Google Scholar]
- 25.An L, Warach S, Shen J. Spectral localization by imaging using multielement receiver coils. Magn Reson Med. 2011;66:1–10. doi: 10.1002/mrm.22783. [DOI] [PMC free article] [PubMed] [Google Scholar]
- 26.Li S, Zhang Y, Ferraris Araneta M, Xiang Y, Johnson C, Innis RB, Shen J. In vivo detection of 13C isotopomer turnover in the human brain by sequential infusion of 13C labeled substrates. J Magn Reson. 2012;218:16–21. doi: 10.1016/j.jmr.2012.03.012. [DOI] [PMC free article] [PubMed] [Google Scholar]
- 27.Deelchand DK, Ugurbil K, Henry PG. Investigation brain metabolism at high fields using localized 13C NMR spectroscopy without 1H decoupling. Magn Reson Med. 2006;55:279–286. doi: 10.1002/mrm.20756. [DOI] [PubMed] [Google Scholar]


