Abstract
Background
Modified response evaluation criteria in solid tumors (mRECIST) and RECIST are used to assess the effect of treatment with targeted agents for hepatocellular carcinoma (HCC). The aim of this study was to determine which set of criteria is superior in patients with advanced HCC treated with sorafenib.
Methods
A multicenter retrospective study to assess the tumor response and patient prognosis of 191 patients with HCC who had been treated with sorafenib from May 2009 through December 2011. We analyzed tumor responses as shown by contrast-enhanced computed tomography scan images according to RECIST 1.1 and mRECIST and compared the findings.
Results
The median duration of follow-up was 9.7 months and median overall survival was 10.8 months. Twenty-five patients (13.1 %) were assessed as responders by mRECIST and 15 (7.8 %) by RECIST 1.1. There was a significant difference in overall survival (OS) between responders and non-responders according to mRECIST (P = 0.0117), but no significant difference in OS between responders and non-responders according to RECIST 1.1 (P = 0.0722). Sixteen patients (8.4 %) had no measurable enhanced target lesions that could be assessed as required by mRECIST; however, these patients could be assessed by RECIST 1.1. According to RECIST 1.1, eight of them had stable disease (SD) and eight had progressive disease (PD). There was a significant difference in OS between these SD and PD patients (P = 0.0312).
Conclusions
Patients treated with sorafenib for HCC should be evaluated by mRECIST; RECIST 1.1 is preferable only for assessment of patients with lesions that are non-measurable according to mRESIST.
Keywords: Hepatocellular carcinoma, Sorafenib, RECIST, Modified RECIST
Background
The Sorafenib Hepatocellular Carcinoma Assessment Randomized Protocol (SHARP) trial and phase III study conducted in the Asia–Pacific region proved survival benefits and good tolerability in the USA, Europe, and Asia–Pacific regions [1, 2]. Therefore, the current guidelines for the management of hepatocellular carcinoma (HCC) recommend sorafenib as first-line treatment for patients with advanced disease and well-preserved liver function (Child-Pugh A class) and state that there is no effective second-line treatment after sorafenib therapy; development of new regimens is required [3, 4].
Overall survival (OS) is the major endpoint used when investigating new treatment regimens for HCC and other cancers. Because earlier endpoints such as time to progression (TTP), progression-free survival (PFS), and response rate are used as guides for the early determination of whether to continue a particular therapy, these endpoints are appropriate in phase II trials, which aim at determining whether to launch larger scale clinical trials [5]. Response evaluation criteria in solid tumors (RECIST) is a well-established means of assessing tumor response and is used with confidence worldwide [6]; however, it was designed for assessing responses to cytotoxic agents and does not address measures of antitumor activity other than tumor shrinkage [7]. The use of RECIST to determine response rates to the treatment of HCC is controversial, especially when evaluating agents that reduce tumor vascularity and cell proliferation, resulting in stabilization of sizes of tumors despite central necrosis [5, 8, 9]. Thus, although sorafenib significantly improves OS compared with placebo, the response rate according to RECIST is only 2.0–3.3 % [1, 2].
Objective and precise criteria for evaluating treatment are required to determine whether to continue a particular treatment for HCC. A panel of experts on HCC convened by the European Association for the Study of the Liver (EASL) has therefore amended the response criteria to take tumor necrosis into account [10]. They recommended using contrast-enhanced radiologic imaging to identify viable lesions, which they defined as those that take up contrast agent in the arterial phase of dynamic studies, thus more accurately assessing treatment response [10]. As a result of their recommendations, a group from the American Association for the Study of Liver Diseases provided a common framework for clinical trials in patients with HCC by modified the RECIST guidelines (mRECIST), including incorporating the concept of viable tumor proposed by the EASL guidelines [8].
Some studies evaluating treatment responses to targeted agents have reported that mRECIST identifies more treatment responders and stratifies for OS better than RECIST in patients treated with sorafenib. However, these studies were not large (53–66 patients) [11–13]. Additionally, by drawing on data from a large database (>6500 patients), simulation studies, and reviews of published reports, RECIST has been further modified to produce the current revised RECIST version 1.1 (RECIST 1.1) [14].
The aim of this study was to identify the most appropriate assessment criteria for evaluating sorafenib treatment for HCC. To achieve this, we assessed the associations between responses as evaluated by conventional RECIST 1.1 and mRECIST and survival data to determine which criteria more accurately identified responders and predicted prognoses of responding patients.
Methods
Study design and selection of patients
This multicenter, retrospective, observational study aimed to assess tumor responses and prognoses of patients with HCC treated with sorafenib at four institutes of the Kanagawa Liver Study Group in Japan. The primary endpoint was to compare the ability of RECIST 1.1 and mRECIST to predict prognosis. All data, including patients’ histories, clinical characteristics, laboratory data, and radiological information were collected retrospectively from each institution.
The common eligibility criteria were as follows: (1) Eastern Cooperative Oncology Group (ECOG) performance status (PS) score of two or less; (2) Child–Pugh liver function class A or B; and (3) aged 20 years or older. The exclusion criteria were as follows: (1) previously treated with molecular-targeted therapies; (2) not treated with a single agent; (3) curative surgery performed after sorafenib treatment; and (4) responses to treatment not assessed by computed tomography (CT) scan.
This retrospective study was approved by the Ethical Committee of the Kitasato University (Kanagawa, Japan).
Diagnosis
All patients had at least one index lesion measuring 1 cm or larger in diameter (i.e., a target lesion) at baseline. Confirmation of the diagnosis of HCC was obtained by observing the typical features of arterial enhancement followed by washout during the portal venous phase on dynamic scan or pathologically based on the American Association for the Study of Liver Diseases guidelines [4].
Treatment regimens
Patients in this study were treated with sorafenib (Nexavar, Bayer Healthcare Pharmaceuticals) orally as a monotherapy. The standard dose was 400 mg (consisting of two 200 mg tablets) twice daily. Treatment interruptions and dose reductions (first 400 mg twice daily, then 400 mg once daily, and finally 400 mg every 2 days) were permitted for adverse events. In some patients who had poor liver function or were aged ≥75 years, the initial dose was only half of the standard dose (400 mg once daily). The following were assessed as treatment failure: (1) an unmanageable adverse event that required termination of therapy; (2) disease progression (according to either RECIST 1.1 or mRECIST); (3) liver function dwindled to Child-Pugh class C; (4) deterioration of ECOG PS score to four; and (5) withdrawal of consent to therapy.
CT scan protocol
CT images were obtained after injection of 100–135 mL of iodine contrast (300 or 350 mg/mL) at an average flow rate of 3.0 mL/s using an automatic power injector. Slice collimation was 5 mm in the arterial and portal phases. Arterial phase imaging was performed 15–19 s after achievement of 200 HU attenuation of the descending aorta measured using a bolus tracking method. There was a 30- to 35-s delay between the arterial phase and portal venous phase acquisition.
Evaluation of treatment response
Tumor measurements were performed on CT scans obtained within 1 month of commencing treatment and every 1–2 months during treatment.
Tumor responses were evaluated separately according to the best response according to RECIST 1.1 and mRECIST in a non-blinded fashion, by an oncologist and a radiologist who were both specialists in liver cancer. The target lesions were defined by both physicians on their pretreatment CT scans of all patients. Each physician then made separate measurements and determined the tumor responses. In cases of disagreement, a consensus was reached. Target lesions were defined as the whole lesion for RECIST assessment and as the contrast-enhanced portion of the lesion in the arterial phase for mRECIST assessment. For evaluation according to RECIST, complete response (CR) was defined as the absence of all target lesions; partial response (PR) and progressive disease (PD) as a greater than 30 % decrease and a greater than 20 % increase, respectively, in the sum of the longest diameters of the target lesions; and stable disease (SD) as neither PR nor PD [14]. However, for evaluation according to mRECIST, CR was defined as the absence of arterially enhanced areas in all target lesions; PR and PD as the same degree of decrease and increase as in the RECIST criteria, these sums being those of the diameters of arterial enhanced areas in all target lesions rather than the sums of the diameters of the whole target lesions size; and SD as neither PR nor PD. When evaluating according to mRECIST, patients with no enhanced lesions were classified as non-measurable. The greatest variation (maximum decrease or minimum increase) in the sum of the greatest lesion dimensions for each patient were also recorded [3, 8].
Adverse events were graded according to the National Cancer Institute’s Common Terminology Criteria for Adverse events, version 3.0 or 4.0.
Identification of target and non-target lesions
At baseline, target lesions were defined as those largest diameters of 1 cm or more and non-target lesions as those with largest diameters of <1 cm. In accordance with RECIST 1.1 recommendations, a maximum of two lesions per organ and five lesions in total were selected for assessment of treatment response [6]. The same number of lesions were selected for assessment by mRECIST. Macroscopic vascular invasions were considered as non-target lesions. Extrahepatic lesions were considered as target lesions. Lesions with no arterial enhancement that were therefore not measurable by mRECIST were considered as non-target lesions when evaluating by mRECIST only [3, 8, 13].
Statistical analysis
Continuous variables are presented as medians and ranges and categorical variables as percentages. Between-group comparisons of variables were performed using the Mann–Whitney U test for continuous variables and the Chi square or Fisher’s exact test for categorical variables. Survival times were measured from the start of sorafenib initiation. OS ended at the time of death or was censored at the time of the last follow-up visit. Duration of sorafenib treatment ended at the time of the last administration of sorafenib for any reason or was censored at the time of the last follow-up visit. Survival analyses were performed using the Kaplan–Meier method and compared using the log-rank test. A Cox proportional hazards model was used to determine independent prognostic factors for OS after adjustment for confounding factors. All reported P values are two-sided, P values <0.05 being considered statistically significant. Dr SPSS Base 11.0j (SPSS Inc., Chicago, IL, USA) for Windows was used to perform all computations, and two-tailed P values <0.05 were considered to indicate statistical significance.
Results
Patients and baseline characteristics
Figure 1 shows a flow diagram of patient recruitment for this study. Between May 2009 and December 2011, 254 patients underwent sorafenib treatment at four institutes of the Kanagawa Liver Study Group. Of these 254 patients, 63 were excluded, 19 (9.9 %) because they had received concomitant treatment (16 with radio-frequency ablation, two with cytotoxic agents, and one with radiotherapy) and 44 (23 %) because post-treatment CT scans had not been performed (because of death in 29 patients and worsening of PS in 15). Thus, 191 patients were finally included in the current study. Treatments prior to sorafenib were as follows; surgical resection in 11 patients, percutaneous locoregional treatments in 20, arterial chemoembolization in 117, arterial chemotherapy in 16, systematic chemotherapy in two, and internal radiation in seven. Eighteen patients had not undergone any treatment before sorafenib.
Fig. 1.
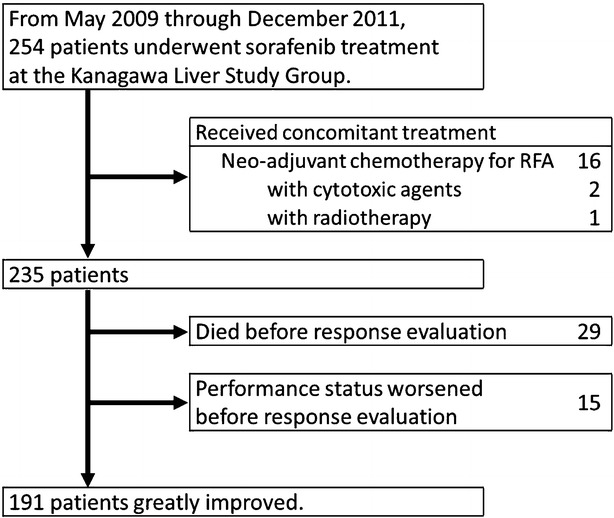
Flow diagram of study enrollment
Baseline characteristics are shown in Table 1. The standard dosage of sorafenib was initially administered to 126 patients (66 %) and the half-dose regimen to the remaining 65 (34 %).
Table 1.
Baseline characteristics of study subjects
| Characteristics | Study cohort (n = 191) |
|---|---|
| Age (years): median (range) | 72 (34–88) |
| Male gender: no. (%) | 149 (78) |
| Cause of liver disease: no. (%) | |
| HC | 112 (59) |
| HB | 35 (18) |
| HC + HB | 4 (2) |
| Others | 40 (21) |
| Child–Pugh class: no. (%) | |
| A/B | 179/12 (94/6) |
| ECOG PS: no. (%) | |
| 0 | 141 (74) |
| 1 | 47 (25) |
| 2 | 3 (1) |
| BCLC stage: no. (%) | |
| A | 11 (6) |
| B | 85 (44) |
| C | 95 (50) |
| Prior treatment: no. (%) | |
| Resection | 13 (7) |
| Radio frequency ablation | 22 (11) |
| Transarterial chemoembolization | 137 (72) |
| None | 19 (10) |
| Macroscopic vascular invasion: no. (%) | 51 (27) |
| Extrahepatic spread: no. (%) | 56 (29) |
| Reduced initiation dose: no. (%) | 65 (34) |
| Laboratory data: median (range) | |
| Hemoglobin (g/dL) | 12.5 (7.7–18.0) |
| Platelet count (104/μ) | 12.3 (3.5–47.5) |
| Aspartate aminotransferase (IU/L) | 55 (13–354) |
| Alanine aminotransferase (IU/L) | 44 (10–238) |
| Albumin (g/dL) | 3.7 (2.4–4.7) |
| Total bilirubin (mg/dL) | 0.8 (0.3–2.6) |
| AFP (ng/mL) | 81 (1.6–409,000) |
| DCP (mAU/mL) | 332 (8–893,000) |
AFP alpha-fetoprotein, BCLC Barcelona clinic liver cancer stage, DCP des-gamma carboxy prothrombin, ECOG Eastern Cooperative Oncology Group, HB hepatitis B virus, HC hepatitis C virus, NBNC non-B and non-C hepatitis virus, PS performance status
Safety and tolerability
The median duration of follow-up in this cohort was 9.7 months [range 1.0–31.9 months; 95 % confidence interval (95 % CI) 8.2–11.2]. The median duration of sorafenib treatment was 2.0 months (range 0.7–12.5 months; 95 % CI 1.9–2.1). Seventy-three patients (38 %) stopped sorafenib treatment because of adverse events, 83 (43 %) because of disease progression and one patient was censored for changing anticancer agent before disease progression. Table 2 shows drug-related adverse events.
Table 2.
Drug-induced adverse events according to the common terminology criteria for adverse events version 3.0 or 4.0
| All grades | Grade 3 or 4 | |
|---|---|---|
| No. (%) | No. (%) | |
| Adverse events | 181 (94.8) | 103 (53.9) |
| Hand-foot skin reaction | 120 (62.8) | 38 (19.9) |
| Elevated AST | 114 (59.7) | 26 (13.6) |
| Elevated ALT | 103 (53.9) | 14 (7.3) |
| Fatigue | 98 (51.3) | 13 (6.8) |
| Appetite loss | 84 (44.0) | 20 (10.5) |
| Diarrhea | 76 (39.8) | 12 (6.3) |
| Hypertension | 73 (38.2) | 11 (5.8) |
| Skin rash | 40 (20.9) | 5 (2.6) |
| Voice changes | 23 (12.0) | 2 (1.0) |
| Alopecia | 23 (12.0) | 0 (0.0) |
| Gastrointestinal bleeding | 4 (2.1) | 1 (0.5) |
| Variceal bleeding | 3 (1.6) | 2 (1.0) |
ALT alanine aminotransferase, AST aspartate aminotransferase
Treatment responses
Table 3 shows the best responses as assessed by both RECIST 1.1 and mRECIST. According to RECIST 1.1, the response rate (defined as the percentage of CR or PR patients) was 7.8 % (15/191) and the disease control rate (defined as percentage of CR + PR + SD patients) was 53.4 % (102/191). However, according to mRECIST, the response rate was 14.3 % (25/191) and the disease control rate 55.4 % (106/191). Evaluation of response to treatment by RECIST1.1 and mRECIST corresponded in 162 patients (84.8 %) (CR/PR/SD/PD: 4/11/70/77, respectively). Ten patients evaluated as non-responders by RECIST1.1 were evaluated by mRECIST as responders (one patient’s response changed from SD to CR, eight from SD to PR, and one from PD to PR). Sixteen patients were not evaluated by mRECIST because they had no measurable target lesions (no enhanced lesions). Eight of these patients were evaluated by RECIST1.1 as having SD and eight as PD.
Table 3.
Treatment evaluation according to response evaluation criteria in solid tumors (RECIST) version 1.1 and modified (m) RECIST
| RECIST 1.1 | Total (mRECIST) | ||||
|---|---|---|---|---|---|
| CR | PR | SD | PD | ||
| mRECIST | |||||
| CR | 4 | 0 | 1 | 0 | 5 |
| PR | 0 | 11 | 8 | 1 | 20 |
| SD | 0 | 0 | 70 | 2 | 72 |
| PD | 0 | 0 | 1 | 77 | 78 |
| Non-measurable | 0 | 0 | 8 | 8 | 16 |
| Total (RECIST 1.1) | 4 | 11 | 88 | 88 | 191 |
CR complete response, PD progressive disease, PR partial response, SD stable disease
Survival analysis
In all, 120 patients (62.8 %) died during the study period. The median OS was 10.8 months (range 1.0–31.9 months; 95 % CI 9.6–12.0) and the 1-year survival rate was 44.8 %. Figures 2 and 3 show OS curves for the four response categories as evaluated by RECIST1.1 and mRECIST, whereas Figs. 4 and 5 show a comparison of OS for responders and non-responders as evaluated by RECIST 1.1 and mRECIST. Patients classified as responders by mRECIST had significantly better OS than non-responders (Fig. 5; P = 0.0117). However, the OS of those classified as responders by RECIST1.1 did not differ significantly from that of non-responders (Fig. 4). Although the treatment responses of 16 patients (8.4 %) could not be assessed by mRECIST because they had no enhanced lesions (Table 3), eight of them were assessed as SD and eight as PD by RECIST1.1. These subgroups had significantly different OS (Fig. 6; median OS = 13.7 months versus 5.7 months, respectively; P = 0.0312).
Fig. 2.
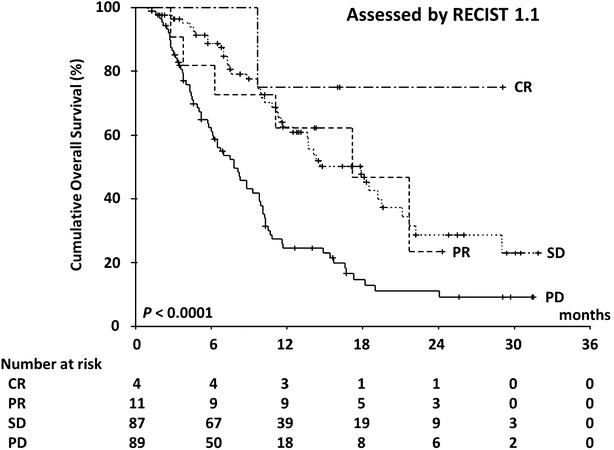
Kaplan–Meier analysis of overall survival. The log-rank test showed significant differences between the four groups (P < 0.0001) categorized according to RECIST 1.1
Fig. 3.
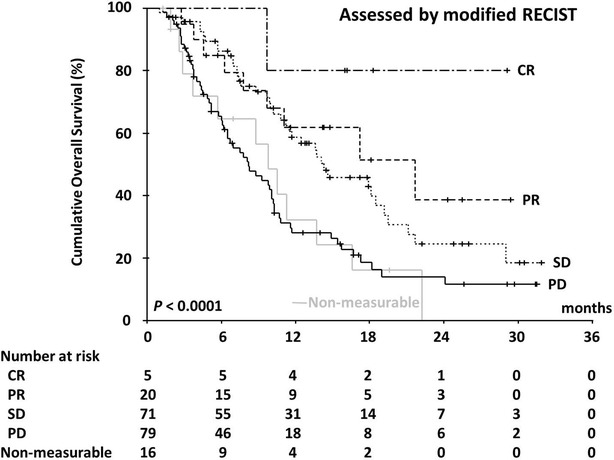
Kaplan–Meier analysis of overall survival. The log-rank test showed significant differences between the four groups (P < 0.0001) categorized according to mRECIST
Fig. 4.
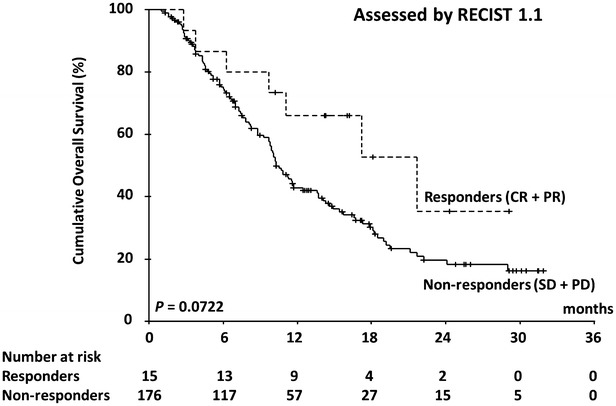
Kaplan–Meier analysis of overall survival. The log-rank test did not show significant differences between responders and non-responders classified according to RECIST 1.1 (P = 0.0722)
Fig. 5.
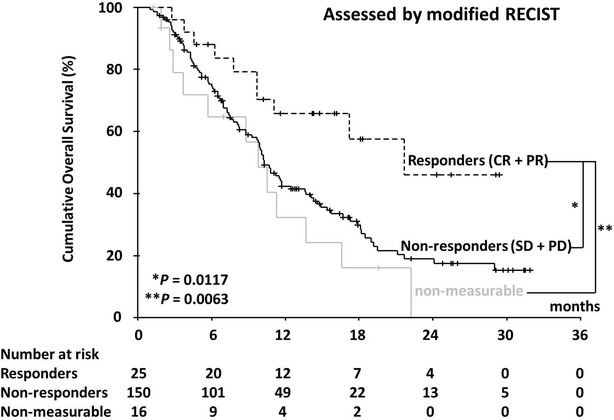
Kaplan–Meier analysis of overall survival. The log-rank test showed significant differences between responders and non-responders classified according to mRECIST (P = 0.0117)
Fig. 6.
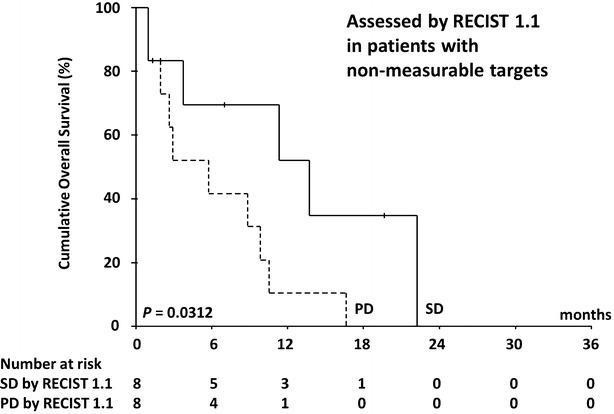
Kaplan–Meier analysis of overall survival in small cohort of patients with non-measurable lesions by mRECIST (n = 16). The log-rank test showed significant differences between progressive disease (PD) (n = 8) and stable disease (SD) groups (n = 8) as determined by RECIST 1.1 (P = 0.0312)
Discussion
In this study, we compared assessment of response to sorafenib by RECIST 1.1 and mRECIST in patients with advanced HCC to determine which criteria more accurately predict prognosis. Although we found that both RECIST1.1 and mRECIST could distinguish PD group from controlled disease, mRECIST identified approximately double the number of responders that RECIST 1.1 did; consequently, the response rate according to mRECIST exceeded 10 % whereas that determined by RECIST 1.1 did not. Responders according to mRECIST had a significantly better OS than nonresponders; this was not true for RECIST. The potential benefits of the more accurate identification of responders by mRECIST include the following: (1) a partial response to therapy can serve as a surrogate marker of clinical benefit [7, 15]; and (2) response rates exceeding 10 % in phase II studies of single-agent non-cytotoxic drug therapy are generally an indicator of survival advantages in phase III studies [7]. Therefore, we believe that mRECIST is superior to RECIST 1.1 for assessing antitumor effects in phase II studies of targeted therapies for HCC.
This study showed a good overall response rate to sorafenib (CR + PR; 7.8 %) compared with published prospective trials (2.0–3.3 %) [1, 2]. However, in one study, 9.6 % of Japanese patients with HCC treated with sorafenib were reportedly classified by RECIST1.1 as responders [16]; these authors suggested there may be a racial difference concerning gene mutations that influence the response rate, similar to the epidermal growth factor receptor mutation for gefitinib [17].
A number of previous clinical studies of HCC treatment have demonstrated that RECIST criteria, which do not reflect tumor vascularization, do not accurately mirror the extent of tumor necrosis induced by chemoembolization, transcatheter chemotherapies, and percutaneous locoregional therapies [18–20]. These treatments can be demonstrated to have conferred benefit if tumor vascularization is taken into account by identifying viable tumor by its enhancement with contrast agent in the arterial phase of a dynamic CT [8]. Llovet et al. claimed that assessment of reduction in volume of viable tumor using contrast-enhanced radiological imaging is the optimal means of assessing treatment response [5]. Thus, MRECIST is more accurate than RECIST for evaluating responses of HCC, which are commonly hypervascular.
According to mRECIST, non-enhanced tumor is not measurable. Assessment of such lesions is important because evaluation of response may otherwise be incomplete. Among several additional radiologic criteria aimed at evaluating tumor viability after treatment with targeted agents, Choi et al. proposed basing such criteria on target density as determined by measuring the CT attenuation coefficient; this approach could be useful for evaluating HCC treatment [13, 21–25]. However, our subgroup analysis indicated that assessment by conventional RECIST adequately predicts prognosis in patients with non-enhancing atypical lesions without using Choi’s criteria because, as Llovet at el. reported, the conventional RECIST criteria are applicable to non-enhancing atypical lesions [5]. However, measurement of the size of the tumor alone has limitations because it cannot distinguish tumor proliferation from necrosis, as previously described [26]. Additionally, magnetic resonance imaging and measurement of serum alfa-fetoprotein levels are useful for clinical evaluation of non-enhancing atypical lesions and may differentiate tumor proliferation from necrosis in such tumors [12, 21, 27–30].
Limitations
In this multicenter retrospective study, post-sorafenib treatment and reduction in dosage of sorafenib were not standardized. In addition, assessment of response to treatment may have varied according to the CT scan procedures and interpretations in each institute. However, we believe that our findings do reflect clinical outcomes of both sets of criteria because this multicenter study was able to enroll many more patients than previously reported studies [11–13].
Conclusions
Patients treated with sorafenib for HCC should be evaluated by mRECIST; RECIST 1.1 is preferable only for assessment of patients with lesions that are non-measurable according to mRECIST.
Authors’ contributions
HH conceived the study. JT, HH, TN, MK, KN, KT, KM, CO, MM, SK, and SO designed the study and collected clinical data. JT and HH analyzed the data and drafted the article. TN, KT, and WK revised the article critically. All authors read and approved the final manuscript.
Acknowledgements
With regard to sorafenib-related data collection, the authors would like to thank the following colleagues of the Kanagawa Liver Study Group: Michihiro Suzuki of the Gastroenterology and Hepatology, Department of Internal Medicine, St Marianna University School of Medicine; and Tsutomu Minamino, Yoshiaki Tanaka, Yusuke Okuwaki, Akitaka Shibuya from the Kitasato University School of Medicine. We also thank Department of Gastroenterology, Kitasato University School of medicine for its financial support.
Competing interests
The authors declare that they have no competing interests.
Abbreviations
- CI
confidence interval
- CR
complete response
- CT
computed tomography
- EASL
European Association for the Study of the Liver
- ECOG
Eastern Cooperative Oncology Group
- HCC
hepatocellular carcinoma
- mRECIST
modified response evaluation criteria in solid tumors
- OS
overall survival
- PFS
progression-free survival
- PD
progressive disease
- PR
partial response
- PS
performance status
- RECIST
response evaluation criteria in solid tumors
- SD
stable disease
- SHARP
The Sorafenib Hepatocellular Carcinoma Assessment Randomized Protocol
- TTF
time to treatment failure
- TTP
time to progression
- TTS
time to treatment stop
Contributor Information
Juichi Takada, Phone: +81-42-778-8111, Email: jui-tkd@kitasato-u.ac.jp.
Hisashi Hidaka, Email: hisashi7@kitasato-u.ac.jp.
Takahide Nakazawa, Email: tnakazaw@kitasato-u.ac.jp.
Masaaki Kondo, Email: mkondou@urahp.yokohama-cu.ac.jp.
Kazushi Numata, Email: kz-numa@urahp.yokohama-cu.ac.jp.
Katsuaki Tanaka, Email: k_tanaka@yokohama-cu.ac.jp.
Kotaro Matsunaga, Email: kotarom@marianna-u.ac.jp.
Chiaki Okuse, Email: c2okuse@marianna-u.ac.jp.
Satoshi Kobayashi, Email: kobayashis@kcch.jp.
Manabu Morimoto, Email: m-morimoto@kcch.jp.
Shinichi Ohkawa, Email: s-ohk@kcch.jp.
Wasaburo Koizumi, Email: koizumi@med.kitasato-u.ac.jp.
References
- 1.Llovet JM, Ricci S, Mazzaferro V, Hilgard P, Gane E, Blanc JF, et al. SHARP Investigators Study Group. Sorafenib in advanced hepatocellular carcinoma. N Engl J Med. 2008;359:378–390. doi: 10.1056/NEJMoa0708857. [DOI] [PubMed] [Google Scholar]
- 2.Cheng AL, Kang YK, Chen Z, Tsao CJ, Qin S, Kim JS, et al. Efficacy and safety of sorafenib in patients in the Asia-Pacific region with advanced hepatocellular carcinoma: a phase III randomised, double-blind, placebo-controlled trial. Lancet Oncol. 2009;10:25–34. doi: 10.1016/S1470-2045(08)70285-7. [DOI] [PubMed] [Google Scholar]
- 3.European Association for the Study of the Liver. European Organisation for Research and Treatment of Cancer EASL–EORTC clinical practice guidelines: management of hepatocellular carcinoma. J Hepatol. 2012;56:908–943. doi: 10.1016/j.jhep.2011.12.001. [DOI] [PubMed] [Google Scholar]
- 4.Bruix J, Sherman M. Management of Hepatocellular Carcinoma: an Update. Hepatology. 2011;53:1020–1022. doi: 10.1002/hep.24199. [DOI] [PMC free article] [PubMed] [Google Scholar]
- 5.Llovet JM, Di Bisceglie AM, Bruix J, Kramer BS, Lencioni R, Zhu AX, et al. Panel of experts in HCC-design clinical trials: design and endpoints of clinical trials in hepatocellular carcinoma. J Natl Cancer Inst. 2008;100:698–711. doi: 10.1093/jnci/djn134. [DOI] [PubMed] [Google Scholar]
- 6.Therasse P, Arbuck SG, Eisenhauer EA, Wanders J, Kaplan RS, Rubinstein L, et al. New guidelines to evaluate the response to treatment in solid tumors. J Natl Cancer Inst. 2000;92:205–216. doi: 10.1093/jnci/92.3.205. [DOI] [PubMed] [Google Scholar]
- 7.Therasse P, Eisenhauer EA, Buyse M. Update in methodology and conduct of cancer clinical trials. Eur J Cancer. 2006;42:1322–1330. doi: 10.1016/j.ejca.2006.02.006. [DOI] [PubMed] [Google Scholar]
- 8.Lencioni R, Llovet JM. Modified RECIST (mRECIST) assessment for hepatocellular carcinoma. Semin Liver Dis. 2010;30:52–60. doi: 10.1055/s-0030-1247132. [DOI] [PubMed] [Google Scholar]
- 9.Rothenberg ML, Carbone DP, Johnson DH. Improving the evaluation of new cancer treatments: challenges and opportunities. Nat Rev Cancer. 2003;3:303–309. doi: 10.1038/nrc1047. [DOI] [PubMed] [Google Scholar]
- 10.Bruix J, Sherman M, Llovet JM, Beaugrand M, Lencioni R, Burroughs AK, et al. EASL panel of experts on HCC: clinical management of hepatocellular carcinoma. Conclusions of the Barcelona-2000 EASL conference. J Hepatol. 2001;35:421–430. doi: 10.1016/S0168-8278(01)00130-1. [DOI] [PubMed] [Google Scholar]
- 11.Edeline J, Boucher E, Rolland Y, Vauléon E, Pracht M, Perrin C, et al. Comparison of tumor response by response evaluation criteria in solid tumors (RECIST) and modified RECIST in patients treated with sorafenib for hepatocellular carcinoma. Cancer. 2012;118:147–156. doi: 10.1002/cncr.26255. [DOI] [PubMed] [Google Scholar]
- 12.Kawaoka T, Aikata H, Murakami E, Nakahara T, Naeshiro N, Tanaka M, et al. Evaluation of the mRECIST and α-fetoprotein ratio for stratification of the prognosis of advanced-hepatocellular-carcinoma patients treated with sorafenib. Oncology. 2012;83:192–200. doi: 10.1159/000341347. [DOI] [PubMed] [Google Scholar]
- 13.Ronot M, Bouattour M, Wassermann J, Bruno O, Dreyer C, Larroque B, et al. Alternative Response Criteria (Choi, European association for the study of the liver, and modified Response Evaluation Criteria in Solid Tumors [RECIST]) Versus RECIST 1.1 in patients with advanced hepatocellular carcinoma treated with sorafenib. Oncologist. 2014;19:394–402. doi: 10.1634/theoncologist.2013-0114. [DOI] [PMC free article] [PubMed] [Google Scholar]
- 14.Eisenhauer EA, Therasse P, Bogaerts J, Schwartz LH, Sargent D, Ford R, et al. New response evaluation criteria in solid tumours: revised RECIST guideline (version 1.1) Eur J Cancer. 2009;45:228–247. doi: 10.1016/j.ejca.2008.10.026. [DOI] [PubMed] [Google Scholar]
- 15.Karnofsky DA. Meaningful clinical classification of therapeutic responses to anticancer drugs. Clin Pharmacol Ther. 1961;2:709–712. doi: 10.1002/cpt196126709. [DOI] [PubMed] [Google Scholar]
- 16.Arizumi T, Ueshima K, Takeda H, Osaki Y, Takita M, Inoue T, et al. Comparison of systems for assessment of post-therapeutic response to sorafenib for hepatocellular carcinoma. J Gastroenterol. 2014;49:1578–1587. doi: 10.1007/s00535-014-0936-0. [DOI] [PMC free article] [PubMed] [Google Scholar]
- 17.Kudo M, Ueshima K. Positioning of a molecular-targeted agent, sorafenib, in the treatment algorithm for hepatocellular carcinoma and implication of many complete remission cases in Japan. Oncology. 2010;78:154–166. doi: 10.1159/000315245. [DOI] [PubMed] [Google Scholar]
- 18.Forner A, Ayuso C, Varela M, Rimola J, Hessheimer AJ, de Lope CR, et al. Evaluation of tumor response after locoregional therapies in hepatocellular carcinoma: are response evaluation criteria in solid tumors reliable? Cancer. 2009;115:616–623. doi: 10.1002/cncr.24050. [DOI] [PubMed] [Google Scholar]
- 19.Kim SK, Lim HK, Kim YH, Lee WJ, Lee SJ, Kim SH, et al. Hepatocellular carcinoma treated with radio-frequency ablation: spectrum of imaging findings. Radiographics. 2003;23:107–121. doi: 10.1148/rg.231025055. [DOI] [PubMed] [Google Scholar]
- 20.Riaz A, Miller FH, Kulik LM, Nikolaidis P, Yaghmai V, Lewandowski RJ, et al. Imaging response in the primary index lesion and clinical outcomes following transarterial locoregional therapy for hepatocellular carcinoma. JAMA. 2010;303:1062–1069. doi: 10.1001/jama.2010.262. [DOI] [PMC free article] [PubMed] [Google Scholar]
- 21.Horger M, Lauer UM, Schraml C, Berg CP, Koppenhöfer U, Claussen CD, et al. Early MRI response monitoring of patients with advanced hepatocellular carcinoma under treatment with the multikinase inhibitor sorafenib. BMC Cancer. 2009;9:208. doi: 10.1186/1471-2407-9-208. [DOI] [PMC free article] [PubMed] [Google Scholar]
- 22.Choi H, Charnsangavej C, Faria SC, Macapinlac HA, Burgess MA, Patel SR, et al. Correlation of computed tomography and positron emission tomography in patients with metastatic gastrointestinal stromal tumor treated at a single institution with imatinib mesylate: proposal of new computed tomography response criteria. J Clin Oncol. 2007;25:1753–1759. doi: 10.1200/JCO.2006.07.3049. [DOI] [PubMed] [Google Scholar]
- 23.Benjamin RS, Choi H, Macapinlac HA, Burgess MA, Patel SR, Chen LL, et al. We should desist using RECIST, at least in GIST. J Clin Oncol. 2007;25:1760–1764. doi: 10.1200/JCO.2006.07.3411. [DOI] [PubMed] [Google Scholar]
- 24.Young H, Baum R, Cremerius U, Herholz K, Hoekstra O, Lammertsma AA, et al. Measurement of clinical and subclinical tumour response using [18F]-fluorodeoxyglucose and positron emission tomography: review and 1999 EORTC recommendations. European Organization for Research and Treatment of Cancer (EORTC) PET Study Group. Eur J Cancer. 1999;35:1773–1782. doi: 10.1016/S0959-8049(99)00229-4. [DOI] [PubMed] [Google Scholar]
- 25.Faivre S, Zappa M, Vilgrain V, Boucher E, Douillard JY, Lim HY, et al. Changes in tumor density in patients with advanced hepatocellular carcinoma treated with sunitinib. Clin Cancer Res. 2011;17:4504–4512. doi: 10.1158/1078-0432.CCR-10-1708. [DOI] [PubMed] [Google Scholar]
- 26.Personeni N, Bozzarelli S, Pressiani T, Rimassa L, Tronconi MC, Sclafani F, et al. Usefulness of alpha-fetoprotein response in patients treated with sorafenib for advanced hepatocellular carcinoma. J Hepatol. 2012;57:101–107. doi: 10.1016/j.jhep.2012.02.016. [DOI] [PubMed] [Google Scholar]
- 27.Nishino M, Jagannathan JP, Ramaiya NH, Van den Abbeele AD. Revised RECIST guideline version 1.1: what oncologists want to know and what radiologists need to know. AJR Am J Roentgenol. 2010;195:281–289. doi: 10.2214/AJR.09.4110. [DOI] [PubMed] [Google Scholar]
- 28.Nakazawa T, Hidaka H, Takada J, Okuwaki Y, Tanaka Y, Watanabe M, et al. Early increase in α-fetoprotein for predicting unfavorable clinical outcomes in patients with advanced hepatocellular carcinoma treated with sorafenib. Eur J Gastroenterol Hepatol. 2013;25:683–689. doi: 10.1097/MEG.0b013e32835d913b. [DOI] [PubMed] [Google Scholar]
- 29.Kuzuya T, Asahina Y, Tsuchiya K, Tanaka K, Suzuki Y, Hoshioka T, et al. Early decrease in α-fetoprotein, but not des-γ-carboxy prothrombin, predicts sorafenib efficacy in patients with advanced hepatocellular carcinoma. Oncology. 2011;81:251–258. doi: 10.1159/000334454. [DOI] [PubMed] [Google Scholar]
- 30.Yau T, Yao TJ, Chan P, Wong H, Pang R, Fan ST, et al. The significance of early alpha-fetoprotein level changes in predicting clinical and survival benefits in advanced hepatocellular carcinoma patients receiving sorafenib. Oncologist. 2011;16:1270–1279. doi: 10.1634/theoncologist.2011-0105. [DOI] [PMC free article] [PubMed] [Google Scholar]


