

Abstract
Streptococcus pyogenes uses the cytolysin Streptolysin O (SLO) to translocate an enzyme, the S. pyogenes NAD+ glycohydrolase (SPN), into the host cell cytosol. However, the function of SPN in this compartment is not known. As a complication, many S. pyogenes strains express a SPN variant lacking NAD+ glycohydrolase (NADase) activity. Here, we show that SPN modifies several SLO- and NAD+-dependent host cell responses in patterns that correlate with NADase activity. SLO pore formation results in hyper-activation of the cellular enzyme Poly-ADP-ribose Polymerase-1 (PARP-1) and production of polymers of Poly-ADP-ribose (PAR). However, while SPN NADase activity moderates PARP-1 activation and blocks accumulation of PAR, these processes continued unabated in the presence of NADase-inactive SPN. Temporal analyses revealed that while PAR production is initially independent of NADase activity, PAR rapidly disappears in the presence of NADase-active SPN, host cell ATP is depleted and the pro-inflammatory mediator High-Mobility Group Box-1 (HMGB1) protein is released from the nucleus by a PARP-1 dependent mechanism. In contrast, HMGB1 is not released in response to NADase-inactive SPN and instead the cells release elevated levels of IL-8 and TNFα. Thus, SPN and SLO combine to induce cellular responses subsequently influenced by the presence or absence of NADase activity.
INTRODUCTION
For an organism to become a successful pathogen it must develop the ability to overcome host barriers. This is often achieved through the production of virulence factors. For bacteria, these are typically secreted proteins that affect various host processes associated with barrier function. This ongoing conflict between virulence factors and their cognate host targets drives their co-evolution. However, pathogens typically produce ensembles of virulence proteins that act in synergy to produce a cellular outcome. A challenge for understanding the selective pressures that influence co-evolution of an individual factor then becomes determining how that factor’s function is influenced by other virulence factors.
Interactions between multiple virulence factors likely are an important influence on the evolution of virulence in Streptococcus pyogenes (group A streptococcus). This Gram-positive bacterium is the agent of a wide variety of diseases ranging from the superficial (eg. pharyngitis, impetigo), to invasive (eg. cellulitis), to destructive (eg. necrotizing fasciitis). Post-infection sequelae (eg. rheumatic fever, acute glomerulonephritis) are also of concern, and infection with S. pyogenes has been associated with certain types of tic and obsessive-compulsive disorders in children (Leckman et al., 2011). Its versatility and success can be attributed in large part to the multitude of virulence proteins S. pyogenes secretes during infection (Cunningham, 2000, Walker et al., 2014). However, how these factors act in combination to influence host cell behaviors and how combinatorial interactions influence the continuing evolution of its genome are not well understood.
One of the best-characterized examples of combinatorial interaction involves the S. pyogenes NAD+-glycohydrolase (NADase) known as SPN (or NGA) and the cholesterol-dependent cytolysin streptolysin O (SLO). SPN and SLO are secreted via the general secretory system and, upon attachment of the bacterium to the host cell membrane, interact with the host cell membrane such that SLO facilitates the translocation of SPN across the membrane and into the host cell cytosol, a process called cytolysin-mediated translocation (CMT) (Madden et al., 2001, Bricker et al., 2002). The CMT mechanism has not been completely elucidated, however, it is not dependent on SLO’s pore forming activity (Magassa et al., 2010).
Translocation does require specific domains of both SLO and SPN that are not required for pore formation or NADase activity (Ghosh et al., 2006, Magassa et al., 2010). Thus, both SLO and SPN consist of at least two functional domains, with the second domain devoted to manipulation of host cell function. For SPN, this latter domain was initially identified on the basis of its NADase activity, cleaving NAD+ into nicotinamide and adenosine diphosphoribose (ADPr) (Carlson et al., 1957, Grushoff et al., 1975). However, population analyses have revealed two major phenotypes for SPN, the second of which lacks this signature NADase activity (Tatsuno et al., 2007, Riddle et al., 2010). Analyses of the most common haplotypes of NADase+ and NADase− SPN have shown that they differ at only 10 amino acid residues (Riddle et al., 2010). Despite the loss of NADase activity, these enzymatically deficient haplotypes remain under strong selection. For example, the loss of activity is associated with 3 polymorphic residues that in combination reduce NADase catalytic efficiency >108-fold (Chandrasekaran et al., 2013). No versions with intermediate activity have been observed (Riddle et al., 2010), and the codons for these residues have signatures of positive selection (Riddle et al., 2010). Also, the ability of a lineage to express NADase+ SPN is absolutely dependent on co-expression of IFS, an inhibitor of NADase activity (Meehl et al., 2005, Chandrasekaran et al., 2013). However, in NADase− lineages, the gene encoding IFS has degraded to a pseudogene, while the gene encoding NADase− SPN always remains intact (Riddle et al., 2010). Thus, despite a complete loss of enzymatic activity, the continued selection for NADase− SPN haplotypes indicates that they remain critical for pathogenesis.
The selective pressures that have driven the evolution of SPN into two functional variants are unknown, although there is an association with niche selection (Riddle et al., 2010). The NADase− variants are strongly associated with “specialist” lineages that tend to infect either the skin or throat, but not both. In contrast, NADase+ variants are associated with “generalist” lineages that show no tissue preference (Riddle et al., 2010). The contribution of SPN to niche selection is not clear as several of the more recently emerged “specialist” lineages have acquired the NADase+ variant (Stevens et al., 2000, Sumby et al., 2005). It is known that both SPN variants synergize with SLO to promote the rapid death of infected host cells (Michos et al., 2006). This response requires the pore-forming activity of SLO, but is not dependent on SPN’s NADase activity, as both variants are equally cytotoxic (Chandrasekaran et al., 2013). Thus, the function of NADase activity and the effect it has on host cell response to infection are not clear.
In the present study, we compared host responses to infection by isogenic NADase+ and NADase− SPN-expressing S. pyogenes strains to gain insight into the selective pressures shaping the evolution of S. pyogenes virulence. By examining several stress responses associated with NAD+ and/or its metabolism, we show that the presence or absence of NADase activity differentially modifies responses that are initiated by SLO pore formation. Most prominent among these involve the nuclear enzyme Poly-ADP-Ribose Polymerase-1 (PARP-1) and the pro-inflammatory mediator High Mobility Group Box-1 (HMGB1) protein. As a consequence, NADase activity has the ability to differentially modulate the characteristics of the host cell’s inflammatory response. Taken together, these data suggest that selection has acted to produce variants of SPN in order to alter how SPN cooperates with SLO to manipulate host cell signaling behaviors.
RESULTS
PARP is induced in a SLO-dependent manner
One prominent reaction to cellular stress is activation of the enzyme Poly-ADP-Ribose Polymerase-1 (PARP-1). This protein resides in the nucleus where it performs a broad spectrum of stress-related functions including DNA damage control, transcriptional activation, chromatin modulation, cell division and inflammation (Gibson et al., 2012). PARP-1 and SPN cleave the identical bond in NAD+, however PARP-1 produces a polymer of ADPr that can be released from the nucleus or covalently attached to proteins in a process called PARylation (D’Amours et al., 1999). Given the similarity in enzymology between PARP-1 and SPN, we examined activation of PARP-1 after infection with a panel of isogenic streptococcal strains expressing NADase+ or NADase− SPN, or mutants deficient in either SLO (ΔSLO) or SPN (ΔSPN). HeLa cells were infected for 5 hours and PARP-1 activation analyzed by Western blotting of cell lysates. Full-length PARP-1 was observed following infection by the NADase+ strain but not in the uninfected control (PARP, Fig. 1). In contrast, treatment with the apoptosis-inducing agent staurosporine resulted in cleavage of the 116 kDa PARP-1 protein into fragments of 89 and 27 kDa (PARP, Fig. 1). During apoptosis, caspase 3 cleaves PARP-1 to prevent its over-activation (Boulares et al., 1999). PARP-1 cleavage bands were not observed for cells infected by NADase−, ΔSLO or ΔSPN strains (PARP, Fig. 1). Activation of PARP can result in its auto-PARylation, (Mendoza-Alvarez et al., 1993) which can conceal the epitopes required for anti-PARP binding. To determine if the failure to observe PARP-1 was due to auto-PARylation, the presence of the poly-ADP-ribose polymer (PAR) was examined. Abundant PAR, which appears as a high molecular weight ladder between 116 kDa and 200 kDa, was detected following infection of HeLa cells by NADase− and ΔSPN strains, and to a lesser extent following staurosporine treatment (PAR, Fig. 1). It was substantially reduced or not observed at levels above the uninfected cells following infection by NADase+ or ΔSLO strains (PAR, Fig. 1). An similar pattern of PAR production was observed in A549 epithelial cells following infection by this panel of strains (Fig. S1). Taken together, since all SLO-expressing strains demonstrated some evidence of PARP activation (either PARP increase or PAR increase; Figure 1) and ΔSLO did not, these data demonstrate that PARP-1 is activated in a SLO-dependent, but SPN-independent manner. However, auto-PARylation and production of PAR are differentially modified by SPN and are absent when NADase activity is present.
Figure 1. PARP is activated in a SLO-dependent manner.

Shown is a Western blot analysis of Hela cell lysates from uninfected (uninfect.) cells or cells infected with the strains indicated at the top of the Figure that are compared to cells treated with Staurosporine (Stauro., 1 μM) and assayed with the antibodies shown on the left. Poly-ADP-ribose polymerase-1 (PARP-1) was detected with an antibody that recognizes both full-length (116 kDa) and cleaved (89 kDa) PARP-1. Poly-ADP-ribose polymer (PAR) was detected by an anti-PAR antibody and appears as multiple bands of high molecular weight bands of between 100–250 kDa. Detection of GAPDH was used for comparison as a loading control. Migration of molecular weight standards are shown on the left. Note that no sample was loaded in the lane marked “blank.” Images are representative of at least three independent experiments.
SLO is necessary but not sufficient for PARP activation
To understand the importance of SLO and the activation of PARP, cells were treated with purified SLO to determine if SLO alone is sufficient to induce PARylation. Purified recombinant SLO was prepared and retained full hemolytic activity (not shown). HeLa cells were treated with various concentrations of purified SLO for 5 hours, and the presence of PAR was assessed by Western blotting. When tested over a range of 1.0 to 100 ng per ml, (0.0156 nM to 1.56 uM) purified SLO did not induce formation of PAR (Fig. 2A). Similarly, treatment with higher concentrations ranging up to 2,000 ng per ml (1.56 uM to 31.2 uM) for one hour also did not elicit PAR (Fig. 2B). Concentrations higher than these caused the immediate disassociation of cells from the plate. These data indicate that while necessary for S. pyogenes bacteria to activate PARP, SLO alone is not sufficient for PARylation. The unknown PARP-1 activating signal was not associated with double-stranded DNA breaks, a common mode of PARP-1 activation (Langelier et al., 2011), as consistent phosphorylation of the histone H2AX (gamma H2AX), a marker of DNA strand breaks (Yuan et al., 2010), was not observed and analysis of DNA integrity by agarose gel electrophoresis did not reveal any evidence of apoptotic or necrotic DNA fragmentation (Fig. S2).
Figure 2. SLO pore formation is necessary, but not sufficient to activate PARP.
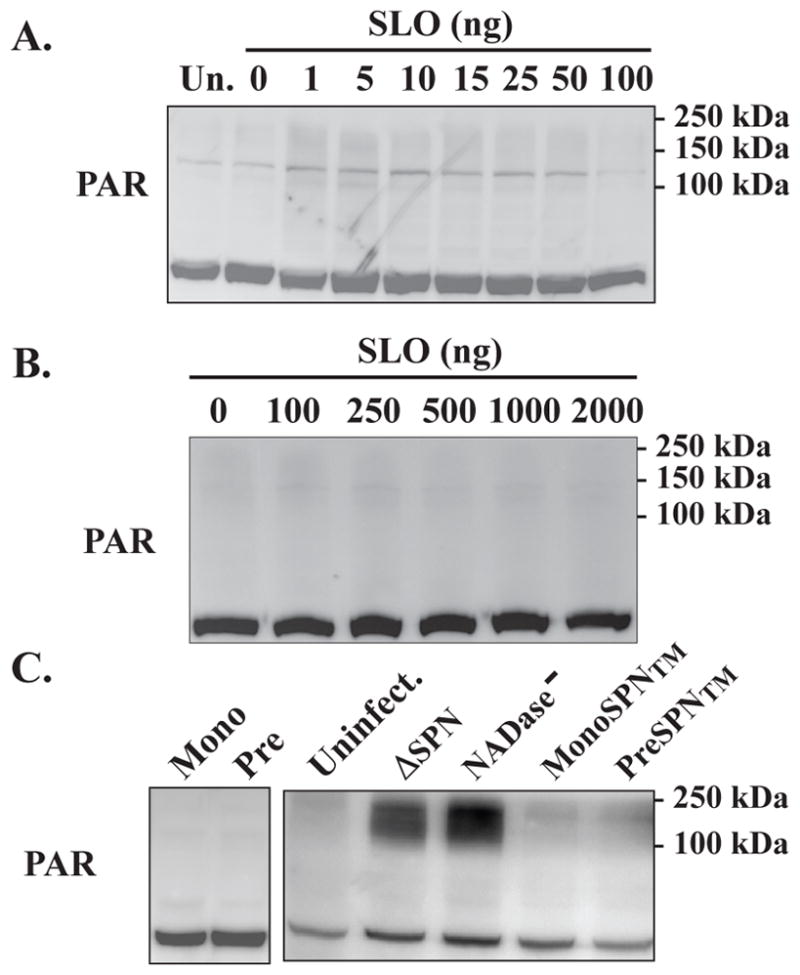
HeLa cells were untreated (Un) or treated with the various concentrations of purified SLO that are shown on the top of Panels A and B. The presence of PAR analyzed by Western blotting as shown, following 5 (A) or 1 (B) hours post-treatment. Formation of PAR was also assessed in HeLa cells infected with S. pyogenes strains expressing monomer or pre-pore locked mutant SLO proteins with NADase+ (Mono or Pre) or NADase− (MonoSPN™ or PreSPN™) SPN and compared with uninfected (uninfect.) cells and cells infected with strains expressing wild-type SLO, but lacking SPN (ΔSPN) or expressing NADase− SPN (NADase−). Formation of PAR was assessed by Western blotting at 5 hours post-infection, as shown (C). Migration of molecular weight standards are shown on the left. Images are representative of at least three independent experiments.
Pore formation by SLO is required to activate PARP-1
To address whether pore formation by SLO is necessary for PARylation, HeLa cells were infected with S. pyogenes strains that expressed NADase+ SPN and versions of SLO mutated to prevent pore formation. The mutants retain the ability to bind the host cell membrane, but are blocked at the step of the formation of the prepore polymer (Monomer-locked) or for insertion of the prepore polymeric complex into the membrane (Prepore-locked) (Magassa et al., 2010). The mutant strains were used to infect HeLa cells as above and PARylation was assessed by Western blotting. Neither the mutant expressing monomer-locked nor prepore-locked SLO was able to induce formation of PAR (Fig. 2C). Both of these mutant versions of SLO retain the ability to translocate SPN, therefore it is possible that the lack of PAR was due to the presence of NADase+ SPN. To test this, a mutant version of SPN in which 3 residues have been altered to eliminate NADase activity (R289K, G330D, I374V; the “triple mutant” or TM) (Chandrasekaran et al., 2013), was used to replace NADase+ SPN in both SLO mutants. When HeLa cells were infected as described above, the monomer-locked (MonoSPN™) and prepore-locked (PreporeSPN™) NADase− mutants did not elicit formation of PAR over the levels observed for uninfected cells (Fig. 2C). In contrast, strains expressing pore-forming SLO, but lacking NADase activity (ΔSPN, NADase−) both induced formation of PAR (Fig. 2C). Thus, these data indicate that SLO pore formation is necessary for activation of PARylation.
SPN modulates PARylation through its NADase activity
NADase+ SPN infection activates PARP, but PARylation is not observed (Fig. 1). One possibility is that all available NAD+ has been depleted by the NADase activity of SPN, preventing PARP from using NAD+ to form PAR. To determine if the NADase activity directly affects PAR levels, SPN mutants with varying levels of NADase activity were used to infect HeLa cells. The mutant strains tested were constructed in the NADase+ background by allelic replacement to introduce combinations of the 3 variant residues that affect NADase activity (NADase+/NADase−, Fig. 3A), resulting in a range of decreased activity from 1.58-fold (R289K), 5330-fold (G330D), 30,000-fold (RK/GD), to >108-fold lower (TM), which is equivalent to the NADase deficient SPN (Chandrasekaran et al., 2013). All mutants of SPN were translocated into the cytosol with equal efficiency (HA, Fig. 3B). Examination of PAR formation following 5 hours of infection revealed an inverse correlation with NADase activity. The R289K variant with <2-fold reduced activity had a modest reduction in PAR as compared to the NADase+ strain and uninfected cells (Fig. 3C and D). However, for all other reduced activity variants, PAR was present at levels equivalent to the NADase− SPN variant, while levels were highest in a strain lacking SPN completely (ΔSPN, Fig. 3C and D). This indicates that SPN’s NADase activity prevents PAR formation or accumulation, potentially affecting events downstream of PARP activation.
Figure 3. SPN modulates PARylation through its NADase activity.

(A) The 3 residues that alter NADase activity in the NADase+ (top) and NADase− (bottom, italics) naturally occurring SPN variants are shown, along with the positions of other 6 polymorphic residues. (B) Strains expressing SPN proteins with C-terminal HA epitope tags, including the naturally occurring NADase+ (+) or NADase− (−) variants and strains with the various combination of single, double and triple (TM) mutations of the activity-altering residues shown at the top of the Figure, were translocated into HeLa cells at equivalent levels, as shown by Western blotting of infected cell lysates developed with an anti-HA antibody. (C) PAR formation was determined by Western blotting in uninfected HeLa cells (uninfect.) and compared to cells infected with the panel of S. pyogenes strains expressing the variants of SPN described above. (D) PAR band intensities produced in response to infection with the indicated strains were determined by densitometry from scanned images. Shown in the Figure are the mean and standard deviations of intensities obtained from 3 separate experiments.
PARP-1 activation is independent of membrane permeability and is temporally modulated by NADase activity
Since PARP-1 has multiple roles in cell regulation, PAR production is tightly controlled and transient, with degradation typically occurring within several minutes of PARP activation (Zhang et al., 2007, Virag et al., 2013). To examine the kinetics of PARylation during S. pyogenes infection, it was first determined whether PAR formation was sensitive to the amount of infecting bacteria and the corresponding level of membrane permeability. In the standard assay, infection by bacteria suspended to an OD600 = 0.5 results in >90% of cells suffering terminal membrane permeability based on their uptake of a fluorescent probe that is normally excluded by uninfected cells (Chandrasekaran et al., 2013). Membrane permeability is enhanced by SPN, but is independent of NADase activity (Chandrasekaran et al., 2013). When a range of initial bacterial loads were examined, no concentration of the NADase+ strain tested induced PAR formation (Fig. 4A). In contrast, PARylation was observed even at the lowest concentration of the NADase− strain tested (Fig. 4A), at which <5% of the cells have membrane permeability (Chandrasekaran et al., 2013). Furthermore, activation was observed at the highest concentration of the ΔSPN strain tested (Fig 4), which also lacks significant cell death at the 5 hour time point (Chandrasekaran et al., 2013). Despite both having the ability to cause PARylation, the ΔSPN and the NADase− strains did not have an identical dose-response, in that PAR production was more robust in response to low concentrations of the NADase− strain as compared to ΔSPN (Fig. 4). PAR formation and degradation is tightly regulated often occurring in cycles (Alvarez-Gonzalez et al., 1989, Gibson et al., 2012). To examine whether this variation could be due to cycling of PARylation, a kinetic analysis was conducted. Under the standard infection conditions, PAR was detected as early as 30 minutes post-infection by ΔSPN and the NADase− strains (Fig. 4B). PARylation increased over 3 hours and was sustained at high levels (Fig. 4B). This kinetic analysis also revealed that infection by the NADase+ strain did induce production of PAR at early time points similar to the other strains (Fig. 4B). However, when levels reach a maximum at approximately 3 hours for all strains, they then rapidly decrease in response to NADase+ infection to the background levels previously noted for the 5 hour time point (Fig. 4B). These data indicated that SPN makes an important contribution by modifying the kinetics of PAR formation in patterns that correlate with NADase activity.
Figure 4. PARP-1 activation is independent of membrane permeability and is modulated by NADase activity.

Shown is a Western blot analysis of PAR formation in HeLa cells infected by the S. pyogenes strains indicated at the left of the Figure comparing different multiplicities of infection, as determined by the Density (OD600) of the inoculum (A), or comparing different times post-infection at the standard multiplicity of infection (B) Western blotting of each sample using an antibody to detect actin is included as a loading control, as shown. The bottom panels show a densitometric analysis of PAR band intensities obtained for each of the strains in response to multiplicity of infection (left) or time (right) from the Western blot images shown in A and B. Migration of molecular weight standards are shown on the left of each panel. Images are representative of at least three independent experiments.
NAD+ and ATP levels are affected by S. pyogenes and SPN
Since both NADase+ SPN and PARP consume NAD+, it was of interest to determine how intracellular NAD+ pools are affected over the course of infection. HeLa cells were infected as above and NAD+ concentrations assessed at several time points. Following treatment with the PARP-1 activator staurosporine, the level of NAD+ decreased over 7 hours, to less than 40% of the amount in uninfected cells (Fig. 5A). In contrast, despite PARP-1 activation, infection by the ΔSPN and NADase− SPN strains resulted in a nearly two-fold increase in the level of NAD+ (Fig. 5A). This increase was independent of PARP-1, as it also increased in ΔSLO, which does not activate PARP-1 (Fig. 5A). The presence of NADase activity did affect NAD+ levels, as an increase was not observed following infection with the NADase+ strain (Fig. 5A). However, unlike for staurosporine treatment, NAD+ levels during infection by the NADase+ SPN strain remained at or near uninfected levels at all time points (Fig. 5A). Consistent with this, NAD+ levels remained steady following 5 hours of infection by strains expressing monomer- or prepore-locked SLO (Fig. 5B), which remain competent for translocation of NADase+ SPN. This manipulation of NAD+ levels was dependent on NADase activity, because if these CMT-competent strains instead express a NADase− version of SPN (Pre and MonoSPN™), NAD+ levels are increased (Fig. 5B). Taken together, these data show that NAD+ levels increase following an infection by a mechanism that does not require SLO, SPN or PARP. However, this increase is blunted when SLO translocates NADase+ SPN into the cytosol.
Figure 5. NAD+ and ATP levels are affected by S. pyogenes and SPN.
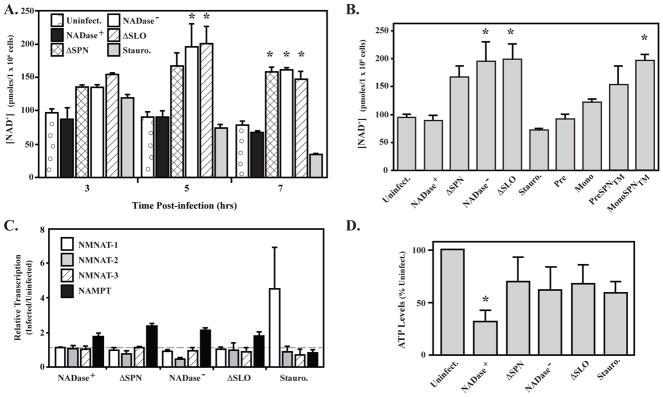
(A) Shown is the measurement of intracellular NAD+ levels in HeLa cells following 3, 5 and 7 hours of infection with indicated strains compared with uninfected cells (Uninfect.) and cells treated with Staurosporine (Stauro., 1 uM), a PARP-1 activator. (B) HeLa cell NAD+ levels following 5 hours of infection with S. pyogenes mutants expressing monomer and pre-pore locked SLO proteins with NADase+ (Mono or Pre) or NADase− (MonoSPN™or PreSPN™) SPN compared with uninfected (Uninfect.) cells and cells infected with strains expressing wild-type SLO, but lacking SPN (ΔSPN) or expressing NADase− SPN (NADase−). (C) Transcript abundance for genes encoding the NAD+ biosynthesis genes indicated in the Figure were determined by real time RT-PCR in total RNA isolated from HeLa cells infected by the strains indicated or following Stauroporine treatment (Stauro., 1 μM) with comparison to uninfected cells. Bars above, at or below the dashed line have increased, unchanged or reduced expression, respectively, vs. uninfected cells. (D) Levels of ATP remaining in HeLa cells following 5 hours of infection with the indicated S. pyogenes strains were determined and expressed relative to uninfected cells. *, P < 0.05. Data represent the mean and standard deviation derived from a minimum of 3 independent experiments.
This spike in NAD+ levels may be due to a more general stress response associated with infection, as it is not dependent on SLO or SPN. To examine this, expression of several NAD+ biosynthesis enzymes associated with stress responses was examined following infection, including 3 isoforms of NMNAT (NMNAT-1, nuclear; NMNAT-2, mitochondrial; NMNAT-3, cytosolic) and the cytosolic NAMPT (Burgos, 2011, Jayaram et al., 2011). When transcription was analyzed by real time RT-PCR, treatment with staurosporine only resulted in an increased expression of NMNAT-1 (Fig. 5C), which is known to respond to over-activation of PARP-1 (Zhang et al., 2012). In contrast, NMNAT-1 was not expressed at higher levels following infection with any S. pyogenes strain (Fig. 5C). Infection did result in up-regulation of the cytosolic NAMPT (Fig. 5C). This influence on expression of a cytosolic enzyme is consistent with the observation that when cell fractions are analyzed, SPN exclusively co-localizes with cytoplasmic, but not nuclear associated proteins (Fig. S3). Finally, since ATP is necessary for the generation of NAD+, ATP levels were evaluated. At the 5 hour time point when NAD+ levels were highest, the level of ATP was significantly reduced only in response to infection by the NADase+ SPN strain (Fig. 5D). This indicates that although NAD+ levels are similar to uninfected cells, enhanced synthesis of NAD+ is maintaining homeostasis in response to SPN NADase activity at the expense of ATP.
Cytokine responses differ between NADase+ and NADase− intoxicated cells
Purified SLO can induce the release of several pro-inflammatory cytokines from epithelial cells, including IL-6, IL-8 and TNFα (Walev et al., 2002, Ratner et al., 2006). Similarly, dying epithelial cells are capable of cytokine signaling with the composition of the response influenced by a number of different factors, including the cell death pathway (Fink et al., 2005). Since cells intoxicated with both NADase+ and NADase− SPN die in a SPN-dependent manner, it was of interest to determine whether cytokine signaling was influenced by the presence or absence of SPN NADase activity. When examined in the context of infection by S. pyogenes, levels of IL-6 in culture supernatant did not differ between infected and uninfected cells or cells treated with staurosporine (Fig. 6A). In contrast, a differential response was observed for TNFα and IL-8 as release of these cytokines was significantly enhanced during infection by the NADase− strain as compared to both uninfected cells and infection by the NADase+ strain (Fig. 6B, C). Since IL-8 and TNFα levels in response to the NADase+ strain did not differ significantly from uninfected cells (Fig. 6B, C) and since the enhanced signaling in the absence of NADase activity also did not require intracellular SPN (ΔSPN, Fig. 6B, C), this indicates that NADase activity is acting to suppress the cells response to infection. Taken together, these data show that the presence or absence of NADase activity can act to differentially modulate host cell cytokine signaling.
Figure 6. Differential cytokine production in response to NADase active vs inactive SPN.
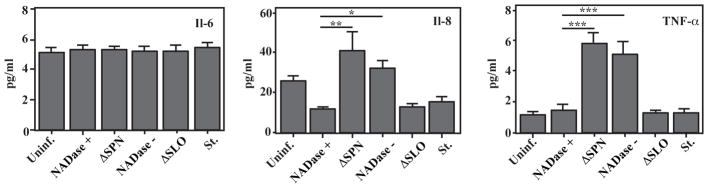
Cells were infected with the strains indicated or treated with staurosporine (St., 1.0 μM). Concentrations of the indicated cytokines were measured in culture supernatant by ELISA following 5 hours of infection and are presented as picograms per milliliter. Data represent the mean and standard error derived from a minimum of 5 independent experiments. *, P < 0.05; **, P < 0.01; ***, P < 0.005.
HMGB1 is released from the nucleus in response to NADase+, but not NADase− SPN
PARylation and PAR can initiate a number of different cellular responses, including cell death and pro-inflammatory signaling (Luo et al., 2012, Virag et al., 2013). An overabundance of PAR can cause the release of Apoptosis-Inducing Factor (AIF) from the mitochondrial membrane that can translocate to the nucleus to initiate a cell death pathway known as parthanatos (Wang et al., 2011). However, neither NADase+ nor NADase− SPN caused nuclear accumulation of AIF (Fig. S4). PARylation can also affect the release of the High Mobility Group Box-1 (HMGB1) protein from the nucleus. In healthy cells and during apoptosis, HMGB1 resides in the nucleus tightly bound to chromatin. During certain types of necrosis, it translocates out of the nucleus into the cytosol and ultimately is released into the extracellular milieu to interact with TLR2, 4, and RAGE receptors on phagocytic cells to regulate numerous processes, including efferocytosis (Davis et al., 2012) and inflammation (Scaffidi et al., 2002). For HMGB1 to be released from chromatin, it first must be PARylated (Ditsworth et al., 2007). Since PARylation is modulated by infection with S. pyogenes, the release of HMGB1 into the cytosol was examined following infection by SLO and SPN variant strains. When assessed by immunofluorescence following 5 hours of infection, HMGB1 was not cytosolic at levels significantly higher than uninfected cells following infection by strains that did not activate PARP-1 (ΔSLO) or resulted in its hyper-activation (ΔSPN, NADase− SPN) (Fig. 7A, B). In contrast, over 50% of cells infected by the NADase+ SPN strain released HMGB1 into their cytosolic compartments (Fig. 7A, B). This release was dependent on PARP-1, as treatment with a siRNA to knockdown expression of PARP-1 reduced the number of cytosolic-staining cells to near background levels (Fig. 7E), while treatment by a control siRNA did not reduce cytosolic relocalization of HMGB1 following infection by the NADase+ SPN (Fig. 7D). This conclusion is supported by treatment with the PARP-specific inhibitor PJ34 (Abdelkarim et al., 2001, Garcia Soriano et al., 2001). Treatment with 25 μM did not inhibit SPN NADase activity (Fig. S5) although it did slightly inhibit SPN translocation (Fig. S5B). However, at this concentration, PJ34 inhibited re-localization of HMGB1 following an infection by the NADase+ SPN to the same extent as siRNA to levels similar to those observed for the other strains (Fig. 7C). Taken together, these data show that PARP-1 activation is required for HMGB1 release from the nucleus during S. pyogenes infection, but that hyper-activation is inhibitory. This difference is exploited by S. pyogenes in that expression of a NADase+ or NADase− SPN will influence whether or not an infected cell will release HMGB1.
Figure 7. HMGB1 is released from the nucleus during NADase+ infection by a PARP-1-dependent mechanism.

(A) Untreated HeLa cells were uninfected (Uninfect.) or infected with the strains indicated at the left of the Figure for 4 hours. HMGB1 release from the HeLa cell nucleus was then assessed by immunofluorescence (red). Cells were co-stained with DAPI to visualize the nucleus (blue) and the merged images used to assess the release of HMGB1 from the nucleus to the cytoplasm. (B) A representative field from the indicated merge panel of part A presented at an additional 4X magnification. Images were then examined to determine the percentage of total stained cells that demonstrated nuclear (white bar) and cytoplasmic (grey bar) HMGB1 staining for (C) untreated cells, (D) cells treated with the PARP-1 inhibitor PJ34 (25 μM), (E) a scrambled sequence control siRNA, (siControl) and (F) a PARP-1 specific siRNA (siPARP). Data represent the mean and standard deviation of the mean derived from a minimum of three independent experiments were performed. *, P < 0.0002.
DISCUSSION
This study provides insight into the impact of SLO and SPN on outcomes of infection by demonstrating that the two proteins synergize to induce host cell responses that neither can elicit on their own. Furthermore, SPN’s influence extends beyond its ability to deplete cellular pools of NAD+, as it impacts several signaling and pro-inflammatory responses. Finally, insight into SPN variation was also gained, as the presence or absence of NADase activity altered how S. pyogenes manipulates host cell signaling responses.
For many of the host cell responses examined, SPN acted to modify a response that was initiated by attachment of S. pyogenes to the cell surface (Fig. 8). Various responses were observed that were both dependent on SLO’s pore-forming activity or were independent of SLO. An example of the latter is up-regulation of the NAD+ synthesis enzyme NAMPT, while activation of PARP1 is an example of the former (Fig. 8). The presence or absence of SPN NADase activity then differentially modulated these responses, resulting in accumulation of PAR and NAD+ (NADase−) or their depletion (NADase+) (Fig. 8). As a consequence, characteristic signaling molecules were produced depending on whether SPN had NADase activity (HMGB1) or lacked NADase activity (IL-8, TNFα) (Fig. 8). Finally, an important commonality, is that the presence of either NADase+ or NADase− intracellular SPN resulted in the death of the infected cell (Fig. 8).
Figure 8. The presence or absence of SPN NADase activity differentially modifies host cell responses to S. pyogenes infection.
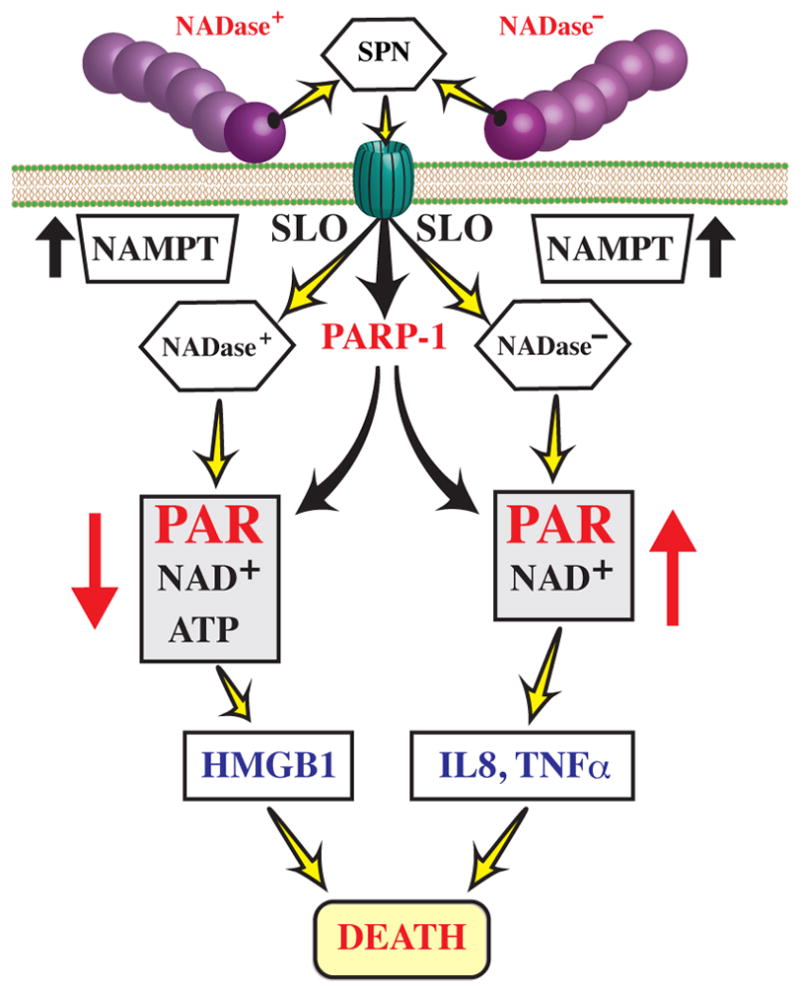
Upon attachment to the host cell membrane, S. pyogenes secretes SLO and SPN, resulting in the SLO-dependent translocation of SPN across the host cell membrane. In addition, attachment of S. pyogenes to the host cell membrane initiates several host cell responses, including those independent (eg. up-regulation of NAMPT) and dependent (eg. activation of PARP-1) of the pore-forming activity of SLO. Intracellular SPN then modulates these responses in patterns that correlate with the presence or absence of NADase activity, differentially altering accumulation of PAR, levels of ATP and NAD+, and pro-inflammatory signaling responses, as shown. Despite these differences, intoxication with either version of SPN results in cell death.
The fact that SLO always interacts with cells in combination with SPN may help to explain that despite extensive analysis, SLO’s function in infection remains poorly understood (for review, see (Los et al., 2013)). In addition, contradictory cellular responses attributed to SLO have often been observed. For example, studies on the contribution of SLO to cell death have reported that it plays an integral role in promoting conventional apoptosis (Cywes Bentley et al., 2005), accelerated apoptosis (Timmer et al., 2009), pyroptosis (Harder et al., 2009), oncosis (Goldmann et al., 2009) and necrosis (Yang et al., 2006, Ato et al., 2008). It is likely that some of these differences can be attributed to the use of different types of target host cells, purified SLO vs. bacterial infection, and the concentration of SLO to which the cells were exposed. However, these studies were done without consideration that SLO and SPN act in combination, that combinatorial interaction produces effects different than each produces individually, and that variation in SPN can result in different cellular outcomes.
In more recent studies where the role of SPN has been examined in epithelial cell death, it has been shown that both NADase+ (Cywes Bentley et al., 2005, Michos et al., 2006) and NADase− SPN (Chandrasekaran et al., 2013) contribute to a rapid type of cell death, and that this response also requires pore formation by SLO (Magassa et al., 2010). Results presented in this study offer insight into pathways of this SPN-induced rapid death and how they are influenced by variation in SPN. Examination of the data suggests that several recognized cell death pathways can be excluded. Apoptosis is not occurring, as neither SPN variant induces apoptosis-related events including nuclear DNA laddering or cleavage of activated PARP. Cytoplasmic PAR can trigger a pathway of programmed necrosis known as parthanatos (Wang et al., 2011). However, neither SPN variant induced release of Apoptosis-Inducing Factor (AIF) from the mitochondria, which is the diagnostic feature of this pathway. We also have not observed activation of caspase-1 during S. pyogenes infection of epithelial cells (data not shown), indicating that pyroptosis (Fink et al., 2005) is not occurring. Oncosis is a form of necrosis triggered by depletion of ATP (Weerasinghe et al., 2012). However, while ATP is depleted by NADase+ SPN, we have not observed other events characteristic of oncosis (Weerasinghe et al., 2012), including cellular swelling and inhibition of death by osmo-protective agents (data not shown) and DNA fragmentation. The lack of these latter features following ATP depletion are more characteristic of a type of programmed necrosis known as “metabolic catastrophe” that is associated with depletion of cellular energy (Altman et al., 2012). Since ATP was not significantly depleted during infection by NADase− SPN strains, it is likely that these cells were not undergoing metabolic catastrophe, but rather a different type of cell death that is yet to be determined. This alternative pathway of cell death does not involve PAR, as PARylation and PAR accumulation were indistinguishable between NADase− SPN strains that induce cell death and ΔSPN strains that do not. However, we have preliminary data that suggests NADase inactive SPN causes death by induction of programmed necrosis through activation of JNK kinase (Chandrasekaran and Caparon, in preparation).
The ability to contribute to cell death may explain why NADase− SPN remains under strong selection. For the host cell responses examined in this study, the NADase− SPN induced responses that were indistinguishable from those caused by the complete loss of SPN in the deletion strain. An important difference is that NADase− SPN causes rapid cellular death, while SPN deletion strains do not (Madden et al., 2001, Chandrasekaran et al., 2013). Selection for both the ability to cause cell death and for the divergent cellular signaling events associated with the loss of NADase activity could explain why positive selection at multiple residues has combined to reduce SPN enzymatic efficiency >108-fold (Chandrasekaran et al., 2013). This elimination of activity has resulted in key differences in cellular signaling responses involving the nuclear protein PARP-1. This enzyme responds to many types of stress including genotoxic, oxidative, thermal, metabolic and microbial (Luo et al., 2012). For S. pyogenes infection, PARP-1 activation was initiated by SLO pore formation. However, the observation that purified SLO was not sufficient to activate PARP-1 and that SPN was also not required for activation implicates an additional S. pyogenes factor. It is unlikely that this additional factor is a CMT substrate, as CMT does not require pore formation by SLO (Magassa et al., 2010), although the pore could allow diffusion of this additional factor into the cytosol, similar to what has been observed for other cytolysins in mixed species infection (Ratner et al., 2006). Regardless of the identity of this additional factor, how it acts to activate PARP is unclear, since infection did not result in any apparent double-stranded breaks in DNA as are typically associated with PARP activation (D’Amours et al., 1999, Luo et al., 2012). However, other factors have been implicated in activation of PARP-1, including histone association, mono-ribosylation by other enzymes, acetylation and phosphorylation by Mitogen Activated Protein Kinases (MAPK) (Gibson et al., 2012).
Many of the more positive functions influenced by PARP-1 are downstream of a single cycle of PARylation and include a role in the inflammatory response, transcriptional regulation of iNOS and NF-κB and the recruitment and maturation of immune cells (Hassa et al., 1999, Chavakis et al., 2003, Messmer et al., 2004, Yu et al., 2006). Sustained activation is often associated with more negative outcomes, including cell death (Zhang et al., 2007, Virag et al., 2013). In this regard, the ability of SPN variants to differentially regulate the level of PARylation is likely of significance. Infection by NADase− SPN strains resulted in sustained activation and accumulation of PAR, while NADase+ SPN strains induced only an initial cycle of PAR formation. This difference was associated with a significant variance in the response of the epithelial cell. Most prominently, the single cycle was sufficient to trigger the PARP-dependent release of HMGB1 from the nucleus, which did not occur upon sustained PARP activation. It has been shown that HMGB1 itself is a PARP substrate and that its release requires PARylation (Ditsworth et al., 2007). It is possible that over-activation of PARP in response to NADase− SPN infection also resulted in over-PARylation of HMGB1, altering its solubility, stability and/or ability to be transported from the nucleus. Differential levels of HMGB1 PARylation can also alter its affinity for its various receptors on bystander cells such as the RAGE receptor, which regulates efferocytosis, a critical component of the resolution of an inflammatory response involving the phagocytosis of apoptotic cells by macrophages (Davis et al., 2012). The findings published by Johansson et al.(Johansson et al., 2014) also indicate that the release of HMGB1 caused by M types that are NADase positive play an important role in soft tissue infections. It is interesting to speculate that differences in HMGB1 release associated with SPN variation may result in differences in how lesions in soft tissue heal, which may contribute to differences in the niche adaptation of specialist and generalist S. pyogenes lineages.
Another of the biosynthetic host enzymes examined in this study, NAMPT also has a dual function when released from the cell, functioning as a cytokine with pro-inflammatory properties that include the recruitment of neutrophils (Samal et al., 1994). NAMPT appears to be responsible for the considerable spike in the concentration of intracellular NAD+ concentrations, as it was the only NAD+ biosynthesis gene up-regulated in response to S. pyogenes infection. The mechanism for this up-regulation is unknown, as it occurred independently of SLO and SPN. However, it is known to respond to the levels of NAD+ in the cytosol (Burgos, 2011) suggesting that infection by S. pyogenes places considerable pressure on the cytoplasmic vs. nuclear or mitochondrial NAD+ pools. Associated with this, one reason that NAD+ levels appeared similar between uninfected cells and cells infected by NADase+ SPN strains could be due to the compartmentalization of NAD+ within the cell. The highest concentration of NAD+ is in the mitochondria with no exchange between this pool and the cytosolic or nuclear pools (Koch-Nolte et al., 2011). Thus, when whole cell NAD+ pools were analyzed, depletion of the cytosolic pool by SPN and the nuclear pool by PARP-1 would have less of an overall impact. However, up-regulation of NAMPT and re-synthesis of NAD+ did result in significant depletion of ATP, which likely contributed to cell death in response to infection by NADase+ SPN strains. Release of NAMPT from these dying cells possibly then contributes to the inflammatory response of the surrounding population of cells.
Although PARP-1 has been recognized as an important regulator of stress, inflammatory and numerous other cellular responses, its manipulation has only recently been identified as a strategy in host-pathogen interactions. The results from this study add S. pyogenes to a very short list of bacterial pathogens that have been shown to activate PARP-1 (Nossa et al., 2009, Radin et al., 2011) and our analysis of SPN shows for the first time that a bacterial toxin can manipulate the kinetics of PARP-1 activation in order to influence PARP-1-associated signaling events, including the pro-inflammatory mediator HMGB1. Significantly, it has recently been shown that HMGB1 is expressed and deposited in lesions during S. pyogenes infection of human soft tissue, with higher HMGB1 levels correlating with the severity of tissue damage (Johansson et al., 2014). Thus, further analyses of how S. pyogenes and SPN manipulate PARP-1-dependent and independent signaling pathways may provide insight into numerous important questions, including infection-related cell death, niche selection, tissue tropism and patterns of soft tissue damage.
MATERIALS AND METHODS
Bacterial Strains and Media
The S. pyogenes utilized were derived from the M serotype 6 strain JRS4 and include SPNJ4 (NADase+), SPNH5 (NADase−), SPNR289K, SPNG330D, SPNR289K/G330D and SPN™ (Chandrasekaran et al., 2013). The various SPN proteins expressed by these strains all contain a carboxy-terminal HA epitope tag. The construction of these strains has previously been previously described (Chandrasekaran et al., 2013). Routine culture of S. pyogenes was conducted using Todd-Hewitt medium supplemented with 0.2% yeast extract (THY medium). The strains of E. coli and media used for protein purification are described below.
Infection of cultured epithelial cells
Prior to an infection, the S. pyogenes strains were inoculated into THY media and grown overnight at 37°C. The following day, strains were sub-cultured by inoculating 10 ml of fresh THY media at a dilution of 1:10 with incubation at 37°C to allow two rounds of doubling as determined by OD600. Streptococci were harvested by centrifugation (6000 × g for 5 minutes) and washed once with 10 ml of phosphate saline buffer (PBS), and re-suspended in tissue culture media consisting of DMEM, 10% FBS, 12.5 mM glutamine and HEPES to an OD600 of 0.5. A549 cells (Chandrasekaran et al., 2013) or HeLa cells (gift of Dong Yu, Washington University), were cultured in 6 well plates (TPP, Midsci) under the conditions described previously (Madden et al., 2001) and then infected with 125 μl of the streptococcal suspensions as described in detail (Chandrasekaran et al., 2013). Infections were continued for 5 hours, unless otherwise specified in the text.
Isolation of DNA from HeLa cells
Chromosomal DNA was isolated from HeLa cells following infection as follows: HeLa cell monolayers were washed twice with Dulbeccos-Phosphate Buffered Solution (D-PBS) scraped from the flask and then harvested by centrifugation (500 × g for 10 minutes). DNA was isolated using the DNeasy Blood and Tissue kit (Qiagen) according to the manufacturer’s protocol. Following re-suspension, DNA concentrations were determined by nanospectrometer (Thermoscientific). The integrity of the purified DNA was analyzed by electrophoresis by dry-loading 1.0 μg samples into the wells of a 2% agarose gel. Following loading, wells were topped off with Tris Acetate EDTA buffer (TAE), and subjected to electrophoresis in TAE buffer. Gels were stained with ethidium bromide and DNA visualized by UV light.
Western blot analyses
Lysates for Western blot analyses were prepared by a commercial product (M-PER, Thermo Scientific) as follows: After infection, cells were scraped from the flask and harvested by centrifugation (700 × g, 10 min.). Supernatant fluids were discarded and the cells in the pellet were then lysed with the volume of M-PER reagent specified by the manufacturer for the number of cells present (typically 1 × 10⁶ cells). Following 10 minutes of incubation at room temperature, suspensions were subjected to centrifugation (20,000 × g, 10 min) to pellet debris. Aliquots of the supernatants were mixed with 4X SDS-loading buffer (Laemmli, 1970) and boiled for 5 min. Samples were stored at −20°C and then subjected to Western blot analyses as previously described (Chandrasekaran et al., 2013) that were developed with the various antibodies listed below.
Antibodies
Antibodies were obtained from the following vendors: Cell Signaling Technologies (Danvers, MA), PARP-1 (#9542), H2AX-p (#9718), AIF (#5318) and HMGB1 (#3935); BD Biosciences, PAR (#551813); and Sigma, Actin monoclonal (AC40), anti-HA affinity purified (1:5000) (H6908). Unless otherwise specified, all antibodies were used at the concentrations recommended by the vendor, typically 1:1000.
Purification of SLO
Expression and purification of SLO with a C-terminal His6 tag from Escherichia coli followed an established method (Shepard et al., 1998). Briefly, E. coli Top10 (pTrcHisA-SLO, a gift from R. Tweten (Shepard et al., 1998)) were grown in Luria Bertani medium containing 50 μg/ml Kanamycin and induced at an OD600 of 0.3 with 1mM IPTG. Following 3 hours of culture at 37°C, the cells were harvested by centrifugation, resuspended in 10 mls volume in buffer (50 mM sodium phosphate buffer, 300 mM sodium chloride) containing lysozyme (10 mg/mL) and protease inhibitors (cOmplete EDTA-free, Roche). Following 30 min of incubation on ice, cells were disrupted by sonication and the solution clarified by centrifugation. The resulting supernatants were subjected to cobalt affinity chromatography using a commercial matrix (Cat. No. 635503, Clontech). Eluted proteins were then dialyzed against 50 mM sodium phosphate buffer (pH 7.5) with 300 mM sodium chloride to remove imidazole. Protein concentrations were determined using a BCA assay (Pierce) with a BSA standard and purity assessed by SDS-PAGE and staining with Coomassie Brilliant Blue. Activity was verified by a erythrocyte hemolysis assay as described (Magassa et al., 2010). Yields were typically 4 mg protein 95% pure starting from 300 ml of culture.
Purification of SPN
The various SPN proteins were expressed in E. coli with His6 tags and purified from the periplasmic space as previously described (Ghosh et al., 2010). The expression plasmids for each of the SPN derivatives has been described in detail (Chandrasekaran et al., 2013). As a final step, the purified proteins were dialyzed at 4°C against a buffer consisting of 50 mM potassium phosphate and 100 mM sodium chloride. Purity and concentrations of the 50 kDa proteins was routinely assessed as described above. Where appropriate, NADase activity was determined as described (Ghosh et al., 2010).
Quantification of intracellular NAD+
Following infection, HeLa cells were washed twice with D-PBS and levels of intracellular NAD+ determined using a commercial kit (NAD+/NADH Quantification kit, Biovision). Briefly, cells were resuspended in NADH/NAD buffer provided by the kit and disrupted by 2 rounds of freezing on dry ice followed by thawing at 37°C. The suspension was mixed by vigorous vortexing (10 secs) and clarified by centrifugation. Residual SPN and cellular NAD+ consuming enzymes were then removed by filtration using a spin column with a 3 kDa molecular weight cut off (Millipore). For determination of total NAD+ concentrations, 50 μL volumes of each cell lysate was arrayed in a 96-well plate and determined in duplicate. To determine NADH concentrations, 200 μL of cell lysate was first heated at 60°C for 30 minutes to decompose NAD+. Samples were allowed to cool to room temperature and then processed as above. Determination of NAD+ and NADH concentrations then followed the manufacturer’s protocol. The cycling reaction was allowed to proceed for 1 hour at room temperature and the plates were read at 450nm on a Tecan M200 Pro Infinite plate reader. Concentrations in lysates were determined based on standard curves analyzed in parallel and were normalized relative to cells that were uninfected. Data presented represents the mean and standard error of the mean determined from at least 3 independent experiments that were conducted on different days.
Quantification of ATP
For analysis of ATP, HeLa cells were cultured and infected in 96 well plates with black sides and clear flat bottoms (Costar, Fisher Scientific). ATP concentrations were then determined using a commercial assay (ATPlite, Perkin Elmer). Briefly, immediately post-infection, cells were lysed by the direct addition of 50 μl of the manufacturer’s mammalian cell lysis solution to the 100 μl of culture media present in each well. Plates were then rotated at 700 rpm on an orbital shaker for 5 min. at room temperature, followed by the addition of a 50 μl aliquot of the luciferase/luciferin solution to each well. Following an additional 5 minutes of rotation, plates were dark adapted for 10 minutes and then luminescence was measured using a Tecan M200 Pro Infinite plate reader. ATP concentrations in lysates were determined based on standard curves analyzed in parallel and were normalized relative to cells that were uninfected. Data presented represents the mean and standard error of the mean determined from at least 3 independent experiments that were conducted on different days.
Immunofluorescence
For immunofluorescence analyses, HeLa cells were cultured to confluence (approx. 3 days) using an 8 well chamber slide (Nunc Lab Tek II Chamber Slide, ThermoScientific). Monolayers were infected as described above, washed with PBS and then fixed with 4% paraformaldehyde for 15 minutes at room temperature. Fixed cells were washed twice with PBS and permeabilized by the addition of 0.5% saponin in PBS. Following an additional 3 washes with PBS, cells were blocked using a solution of 1% BSA in PBS containing 0.1% Tween (PBS-T/BSA) with an incubation of 30 min at room temperature. Various primary antibodies (see above) were diluted with PBS-T/BSA to a final dilution of 1:100 and incubated with the fixed cells overnight at 4°C. Cells were washed with PBS three times and then incubated with secondary anti-rabbit antibodies labeled with Alexa-fluor 594 or 488 (Invitrogen) at a final dilution of 1:300. Following an additional 2 hours of incubation in the dark, cells were washed with PBS and the chamber removed. Cells were prepared for analysis by the addition of 10 μL of Prolong Gold with DAPI (Invitrogen) to each chamber square that was then overlaid with a coverslip and stored overnight at room temperature. Cells were imaged using a Leica DMRE2 fluorescent microscope and images were captured using Q Imaging Retiga cooled CCD digital camera and Volocity software (Perkin Elmer). For quantitation, cells were directly enumerated from captured images with the data presented representing the mean and standard error of the mean derived from at least 3 independent experiments and the examination of a minimum of 1000 total cells. For publication, images were processed using Adobe Photoshop CS6 and prepared using Adobe Illustrator CS6.
Cytokine analyses
After a 5 hour infection, cell supernatants were collected, subjected to centrifugation at 6000 × g for 10 minutes to remove debris, and stored at −80°C for later analysis. Cytokines concentrations, including IL-6, IL-8 and TNFα, were measured by ELISA using commercially sourced assays (cat. #HS600B, #D8000C, R and D Systems; #88-7346-22, eBiosciences), following the Manufacturer’s protocol. The data presented represent the mean and the standard deviation derived from 5 independent experiments.
siRNA silencing of PARP-1
siRNA knockdown was performed with 100 nM of siRNA duplexes targeting PARP-1 purchased from Cell Signaling Technologies (#6304). siControl and siGlo were purchased from Dharmacon (Thermo Scientific) and used at a total concentration of 100 nM. Lipid and siRNA complexes were made per manufacturer’s instructions using Lipofectamine 2000 and OPTI-MEM I (Invitrogen). Using a reverse transfection method, these complexes were added to trypsinized cells in each well in complete media. Cells and complexes were incubated for 24 hours after which old media was removed and fresh complete media added. Cells were transfected for 72 hours before infection.
PJ34 Treatment
The PARP-1 inhibitor PJ34 (Sigma, cat#P4365) was used at a concentration of 25μM. HeLa cells were treated overnight prior to the infection and during the infection. Inhibition of PARP-1 was assessed by the lack of PAR formation in Western blots after an infection with ΔSPN or treatment with staurosporine (Fig. S4C). Cells were then subjected to analysis as described in the text.
RNA isolation and Real-Time RT-PCR
Total cellular RNA was isolated from HeLa cells using Qiagen RNeasy and cDNA was created by subjecting RNA to reverse transcription using iScript (BioRad) as per the Manufacturer’s instructions. Real-time RT-PCR analysis of cDNA samples was conducted using iTaq SYBR green supermix (Bio-Rad) using the primers listed in Table S1. Relative transcript levels were analyzed using the ΔΔCt method with β-actin as the reference standard. Data presented are the mean and standard error of the mean resulting from triplicate analysis of samples prepared from at least three independent experiments.
Supplementary Material
Supplemental Figure 1. Similar PAR patterns occur in A549 cells. Western blot analysis of A549 cells show PARylation patterns similar to HeLa cells. Epithelial cells were infected with theindicated strains for 3 hours at an OD of 0.3. Migration of molecular weights shown on the left. Images are representative of at least 3 independent experiments.
Supplemental Figure 2. Extensive DNA damage does not occur during an infection. (A) Western blot analysis of post infection lysates using an antibody that recognizes phosphorylated H2AX (gamma H2AX). (B) Agarose gel electrophoresis of DNA extracted from Hela cells after an infection with indicated strains or treated with 1 uM staurosporine for 5 hours. Arrows indicate the DNA size. Images are representative of three independent experiments.
Supplemental Figure 3. SPN is translocated to the cytosol and not the nucleus. Western blot analysis of fractionated A549 cells indicates SPN co-localizes with cytoplasmic proteins. Fractionation was performed using the Sigma Nuclei EZ Prep (Zerfaoui et al., 2010 N3408) protocol. Lane 1 contains total lysates from cells infected with NADase + SPN strain. Lane 2 and 3 are cytoplasmic fractions from the indicated infections and lanes 4, 5, and 6 are nuclear fractions from indicated cells. GAPDH antibody was used as a cytoplasmic control and HDAC antibody was used as a nuclear control. Western blots are representative of at least 2 independent experiments.
Supplemental Figure 4. AIF is not translocated into the nucleus during an infection with S. pyogenes. Immunofluorescence of AIF was performed after a 5 hour infection with indicated strains. Nucleus is stained with DAPI (blue) and AIF in (green). Images are representative of at least 3 independent experiments.
Supplemental Figure 5. PARP inhibitor PJ34 does not inhibit the NADase activity of SPN. (A) Overnight supernatants of NADase + and − strains were serially diluted in 50 mM potassium phosphate pH 7.4 with or without 25 μM of PJ34. NAD+ was added at a 1mM concentration and incubated for 1.5 hours at 37°C. The reactions were terminated with 100 ml 5 M NaOH and incubated an additional one hour. The concentration of remaining uncleaved NAD+ in each reaction was determined by spectrofluorimetry (380 nm absorbance, 455 nm emission). (B) Translocation of HA tagged SPN into cytosols after an infection with indicated strains. HeLa cells were treated with 25 μM PJ34 overnight and during infection and compared to cells treated overnight but not during the infection. (C) Western blot analysis of PAR on PJ34 treated HeLa cell lysates after an infection with ΔSPN or treatment with 1μM staurosporine. Concentrations of PJ34 are indicated above the blot.
Table S1. RT- PCR primers used in this study.
Acknowledgments
We would like to thank R. Tweten for his gift of pTrcHisA-SLO. This work was supported by National Institutes of Health Grant AI064721 from the United States Public Health Service.
Footnotes
Disclosures
No conflict of interest for all authors
References
- Abdelkarim GE, Gertz K, Harms C, Katchanov J, Dirnagl U, Szabo C, Endres M. Protective effects of PJ34, a novel, potent inhibitor of poly(ADP-ribose) polymerase (PARP) in in vitro and in vivo models of stroke. International journal of molecular medicine. 2001;7:255–260. [PubMed] [Google Scholar]
- Altman BJ, Rathmell JC. Metabolic Stress in Autophagy and Cell Death Pathways. Cold Spring Harbor Perspectives in Biology. 2012;4 doi: 10.1101/cshperspect.a008763. [DOI] [PMC free article] [PubMed] [Google Scholar]
- Alvarez-Gonzalez R, Althaus FR. Poly(ADP-ribose) catabolism in mammalian cells exposed to DNA-damaging agents. Mutation research. 1989;218:67–74. doi: 10.1016/0921-8777(89)90012-8. [DOI] [PubMed] [Google Scholar]
- Ato M, Ikebe T, Kawabata H, Takemori T, Watanabe H. Incompetence of neutrophils to invasive group A streptococcus is attributed to induction of plural virulence factors by dysfunction of a regulator. PloS one. 2008;3:e3455. doi: 10.1371/journal.pone.0003455. [DOI] [PMC free article] [PubMed] [Google Scholar]
- Boulares AH, Yakovlev AG, Ivanova V, Stoica BA, Wang G, Iyer S, Smulson M. Role of poly(ADP-ribose) polymerase (PARP) cleavage in apoptosis. Caspase 3-resistant PARP mutant increases rates of apoptosis in transfected cells. J Biol Chem. 1999;274:22932–22940. doi: 10.1074/jbc.274.33.22932. [DOI] [PubMed] [Google Scholar]
- Bricker AL, Cywes C, Ashbaugh CD, Wessels MR. NAD+-glycohydrolase acts as an intracellular toxin to enhance the extracellular survival of group A streptococci. Molecular microbiology. 2002;44:257–269. doi: 10.1046/j.1365-2958.2002.02876.x. [DOI] [PubMed] [Google Scholar]
- Burgos ES. NAMPT in regulated NAD biosynthesis and its pivotal role in human metabolism. Current medicinal chemistry. 2011;18:1947–1961. doi: 10.2174/092986711795590101. [DOI] [PubMed] [Google Scholar]
- Carlson AS, Kellner A, Bernheimer AW, Freeman EB. A streptococcal enzyme that acts specifically upon diphosphopyridine nucleotide: characterization of the enzyme and its separation from streptolysin O. The Journal of experimental medicine. 1957;106:15–26. doi: 10.1084/jem.106.1.15. [DOI] [PMC free article] [PubMed] [Google Scholar]
- Chandrasekaran S, Ghosh J, Port GC, Koh E, Caparon MG. Analysis of Polymorphic Residues Reveals Distinct Enzymatic and Cytotoxic Activities of the Streptococcus pyogenes NAD+ Glycohydrolase. J Biol Chem. 2013;288:20064–20075. doi: 10.1074/jbc.M113.481556. [DOI] [PMC free article] [PubMed] [Google Scholar]
- Chavakis T, Bierhaus A, Al-Fakhri N, Schneider D, Witte S, Linn T, et al. The pattern recognition receptor (RAGE) is a counterreceptor for leukocyte integrins: a novel pathway for inflammatory cell recruitment. The Journal of experimental medicine. 2003;198:1507–1515. doi: 10.1084/jem.20030800. [DOI] [PMC free article] [PubMed] [Google Scholar]
- Cunningham MW. Pathogenesis of group A streptococcal infections. Clin Microbiol Rev. 2000;13:470–511. doi: 10.1128/cmr.13.3.470-511.2000. [DOI] [PMC free article] [PubMed] [Google Scholar]
- Cywes Bentley C, Hakansson A, Christianson J, Wessels MR. Extracellular group A Streptococcus induces keratinocyte apoptosis by dysregulating calcium signalling. Cell Microbiol. 2005;7:945–955. doi: 10.1111/j.1462-5822.2005.00525.x. [DOI] [PubMed] [Google Scholar]
- D’Amours D, Desnoyers S, D’Silva I, Poirier GG. Poly(ADP-ribosyl)ation reactions in the regulation of nuclear functions. Biochemical Journal. 1999;342:249–268. [PMC free article] [PubMed] [Google Scholar]
- Davis K, Banerjee S, Friggeri A, Bell C, Abraham E, Zerfaoui M. Poly(ADP-ribosyl)ation of high mobility group box 1 (HMGB1) protein enhances inhibition of efferocytosis. Molecular medicine. 2012;18:359–369. doi: 10.2119/molmed.2011.00203. [DOI] [PMC free article] [PubMed] [Google Scholar]
- Ditsworth D, Zong WX, Thompson CB. Activation of poly(ADP)-ribose polymerase (PARP-1) induces release of the pro-inflammatory mediator HMGB1 from the nucleus. J Biol Chem. 2007;282:17845–17854. doi: 10.1074/jbc.M701465200. [DOI] [PMC free article] [PubMed] [Google Scholar]
- Fink SL, Cookson BT. Apoptosis, pyroptosis, and necrosis: mechanistic description of dead and dying eukaryotic cells. Infect Immun. 2005;73:1907–1916. doi: 10.1128/IAI.73.4.1907-1916.2005. [DOI] [PMC free article] [PubMed] [Google Scholar]
- Garcia Soriano F, Virag L, Jagtap P, Szabo E, Mabley JG, Liaudet L, et al. Diabetic endothelial dysfunction: the role of poly(ADP-ribose) polymerase activation. Nature medicine. 2001;7:108–113. doi: 10.1038/83241. [DOI] [PubMed] [Google Scholar]
- Ghosh J, Anderson PJ, Chandrasekaran S, Caparon MG. Characterization of Streptococcus pyogenes beta-NAD+ glycohydrolase: reevaluation of enzymatic properties associated with pathogenesis. J Biol Chem. 2010;285:5683–5694. doi: 10.1074/jbc.M109.070300. [DOI] [PMC free article] [PubMed] [Google Scholar]
- Ghosh J, Caparon MG. Specificity of Streptococcus pyogenes NAD(+) glycohydrolase in cytolysin-mediated translocation. Molecular microbiology. 2006;62:1203–1214. doi: 10.1111/j.1365-2958.2006.05430.x. [DOI] [PubMed] [Google Scholar]
- Gibson BA, Kraus WL. New insights into the molecular and cellular functions of poly(ADP-ribose) and PARPs. Nature reviews Molecular cell biology. 2012;13:411–424. doi: 10.1038/nrm3376. [DOI] [PubMed] [Google Scholar]
- Goldmann O, Sastalla I, Wos-Oxley M, Rohde M, Medina E. Streptococcus pyogenes induces oncosis in macrophages through the activation of an inflammatory programmed cell death pathway. Cell Microbiol. 2009;11:138–155. doi: 10.1111/j.1462-5822.2008.01245.x. [DOI] [PubMed] [Google Scholar]
- Grushoff PS, Shany S, Bernheimer AW. Purification and properties of streptococcal nicotinamide adenine dinucleotide glycohydrolase. Journal of bacteriology. 1975;122:599–605. doi: 10.1128/jb.122.2.599-605.1975. [DOI] [PMC free article] [PubMed] [Google Scholar]
- Harder J, Franchi L, Munoz-Planillo R, Park JH, Reimer T, Nunez G. Activation of the Nlrp3 inflammasome by Streptococcus pyogenes requires streptolysin O and NF-kappa B activation but proceeds independently of TLR signaling and P2X7 receptor. Journal of immunology. 2009;183:5823–5829. doi: 10.4049/jimmunol.0900444. [DOI] [PMC free article] [PubMed] [Google Scholar]
- Hassa PO, Hottiger MO. A role of poly (ADP-ribose) polymerase in NF-kappaB transcriptional activation. Biological chemistry. 1999;380:953–959. doi: 10.1515/BC.1999.118. [DOI] [PubMed] [Google Scholar]
- Jayaram HN, Kusumanchi P, Yalowitz JA. NMNAT expression and its relation to NAD metabolism. Current medicinal chemistry. 2011;18:1962–1972. doi: 10.2174/092986711795590138. [DOI] [PubMed] [Google Scholar]
- Johansson L, Snall J, Sendi P, Linner A, Thulin P, Linder A, et al. HMGB1 in severe soft tissue infections caused by Streptococcus pyogenes. Frontiers in cellular and infection microbiology. 2014;4:4. doi: 10.3389/fcimb.2014.00004. [DOI] [PMC free article] [PubMed] [Google Scholar]
- Koch-Nolte F, Fischer S, Haag F, Ziegler M. Compartmentation of NAD+-dependent signalling. FEBS letters. 2011;585:1651–1656. doi: 10.1016/j.febslet.2011.03.045. [DOI] [PubMed] [Google Scholar]
- Laemmli UK. Cleavage of structural proteins during the assembly of the head of bacteriophage T4. Nature. 1970;227:680–685. doi: 10.1038/227680a0. [DOI] [PubMed] [Google Scholar]
- Langelier MF, Planck JL, Roy S, Pascal JM. Crystal structures of poly(ADP-ribose) polymerase-1 (PARP-1) zinc fingers bound to DNA: structural and functional insights into DNA-dependent PARP-1 activity. J Biol Chem. 2011;286:10690–10701. doi: 10.1074/jbc.M110.202507. [DOI] [PMC free article] [PubMed] [Google Scholar]
- Leckman JF, King RA, Gilbert DL, Coffey BJ, Singer HS, St Dure L, et al. Streptococcal upper respiratory tract infections and exacerbations of tic and obsessive-compulsive symptoms: a prospective longitudinal study. Journal of the American Academy of Child and Adolescent Psychiatry. 2011;50:108–118. e103. doi: 10.1016/j.jaac.2010.10.011. [DOI] [PMC free article] [PubMed] [Google Scholar]
- Los FC, Randis TM, Aroian RV, Ratner AJ. Role of pore-forming toxins in bacterial infectious diseases. Microbiology and molecular biology reviews : MMBR. 2013;77:173–207. doi: 10.1128/MMBR.00052-12. [DOI] [PMC free article] [PubMed] [Google Scholar]
- Luo X, Kraus WL. On PAR with PARP: cellular stress signaling through poly(ADP-ribose) and PARP-1. Genes & development. 2012;26:417–432. doi: 10.1101/gad.183509.111. [DOI] [PMC free article] [PubMed] [Google Scholar]
- Madden JC, Ruiz N, Caparon M. Cytolysin-mediated translocation (CMT): a functional equivalent of type III secretion in gram-positive bacteria. Cell. 2001;104:143–152. doi: 10.1016/s0092-8674(01)00198-2. [DOI] [PubMed] [Google Scholar]
- Magassa N, Chandrasekaran S, Caparon MG. Streptococcus pyogenes cytolysin-mediated translocation does not require pore formation by streptolysin O. EMBO reports. 2010;11:400–405. doi: 10.1038/embor.2010.37. [DOI] [PMC free article] [PubMed] [Google Scholar]
- Meehl MA, Pinkner JS, Anderson PJ, Hultgren SJ, Caparon MG. A novel endogenous inhibitor of the secreted streptococcal NAD-glycohydrolase. PLoS Pathog. 2005;1:e35. doi: 10.1371/journal.ppat.0010035. [DOI] [PMC free article] [PubMed] [Google Scholar]
- Mendoza-Alvarez H, Alvarez-Gonzalez R. Poly(ADP-ribose) polymerase is a catalytic dimer and the automodification reaction is intermolecular. J Biol Chem. 1993;268:22575–22580. [PubMed] [Google Scholar]
- Messmer D, Yang H, Telusma G, Knoll F, Li J, Messmer B, et al. High mobility group box protein 1: an endogenous signal for dendritic cell maturation and Th1 polarization. Journal of immunology. 2004;173:307–313. doi: 10.4049/jimmunol.173.1.307. [DOI] [PubMed] [Google Scholar]
- Michos A, Gryllos I, Hakansson A, Srivastava A, Kokkotou E, Wessels MR. Enhancement of streptolysin O activity and intrinsic cytotoxic effects of the group A streptococcal toxin, NAD-glycohydrolase. J Biol Chem. 2006;281:8216–8223. doi: 10.1074/jbc.M511674200. [DOI] [PubMed] [Google Scholar]
- Nossa CW, Jain P, Tamilselvam B, Gupta VR, Chen LF, Schreiber V, et al. Activation of the abundant nuclear factor poly(ADP-ribose) polymerase-1 by Helicobacter pylori. Proceedings of the National Academy of Sciences of the United States of America. 2009;106:19998–20003. doi: 10.1073/pnas.0906753106. [DOI] [PMC free article] [PubMed] [Google Scholar]
- Radin JN, Gonzalez-Rivera C, Ivie SE, McClain MS, Cover TL. Helicobacter pylori VacA induces programmed necrosis in gastric epithelial cells. Infect Immun. 2011;79:2535–2543. doi: 10.1128/IAI.01370-10. [DOI] [PMC free article] [PubMed] [Google Scholar]
- Ratner AJ, Hippe KR, Aguilar JL, Bender MH, Nelson AL, Weiser JN. Epithelial cells are sensitive detectors of bacterial pore-forming toxins. J Biol Chem. 2006;281:12994–12998. doi: 10.1074/jbc.M511431200. [DOI] [PMC free article] [PubMed] [Google Scholar]
- Riddle DJ, Bessen DE, Caparon MG. Variation in Streptococcus pyogenes NAD+ glycohydrolase is associated with tissue tropism. Journal of bacteriology. 2010;192:3735–3746. doi: 10.1128/JB.00234-10. [DOI] [PMC free article] [PubMed] [Google Scholar]
- Samal B, Sun Y, Stearns G, Xie C, Suggs S, McNiece I. Cloning and characterization of the cDNA encoding a novel human pre-B-cell colony-enhancing factor. Molecular and cellular biology. 1994;14:1431–1437. doi: 10.1128/mcb.14.2.1431. [DOI] [PMC free article] [PubMed] [Google Scholar]
- Scaffidi P, Misteli T, Bianchi ME. Release of chromatin protein HMGB1 by necrotic cells triggers inflammation. Nature. 2002;418:191–195. doi: 10.1038/nature00858. [DOI] [PubMed] [Google Scholar]
- Shepard LA, Heuck AP, Hamman BD, Rossjohn J, Parker MW, Ryan KR, et al. Identification of a membrane-spanning domain of the thiol-activated pore-forming toxin Clostridium perfringens perfringolysin O: an alpha-helical to beta-sheet transition identified by fluorescence spectroscopy. Biochemistry. 1998;37:14563–14574. doi: 10.1021/bi981452f. [DOI] [PubMed] [Google Scholar]
- Stevens DL, Salmi DB, McIndoo ER, Bryant AE. Molecular epidemiology of nga and NAD glycohydrolase/ADP-ribosyltransferase activity among Streptococcus pyogenes causing streptococcal toxic shock syndrome. The Journal of infectious diseases. 2000;182:1117–1128. doi: 10.1086/315850. [DOI] [PubMed] [Google Scholar]
- Sumby P, Porcella SF, Madrigal AG, Barbian KD, Virtaneva K, Ricklefs SM, et al. Evolutionary origin and emergence of a highly successful clone of serotype M1 group a Streptococcus involved multiple horizontal gene transfer events. The Journal of infectious diseases. 2005;192:771–782. doi: 10.1086/432514. [DOI] [PubMed] [Google Scholar]
- Tatsuno I, Sawai J, Okamoto A, Matsumoto M, Minami M, Isaka M, et al. Characterization of the NAD-glycohydrolase in streptococcal strains. Microbiology. 2007;153:4253–4260. doi: 10.1099/mic.0.2007/009555-0. [DOI] [PubMed] [Google Scholar]
- Timmer AM, Timmer JC, Pence MA, Hsu LC, Ghochani M, Frey TG, et al. Streptolysin O promotes group A Streptococcus immune evasion by accelerated macrophage apoptosis. J Biol Chem. 2009;284:862–871. doi: 10.1074/jbc.M804632200. [DOI] [PMC free article] [PubMed] [Google Scholar]
- Virag L, Robaszkiewicz A, Vargas JM, Javier Oliver F. Poly(ADP-ribose) signaling in cell death. Mol Aspects Med. 2013;34:1153–1167. doi: 10.1016/j.mam.2013.01.007. [DOI] [PubMed] [Google Scholar]
- Walev I, Hombach M, Bobkiewicz W, Fenske D, Bhakdi S, Husmann M. Resealing of large transmembrane pores produced by streptolysin O in nucleated cells is accompanied by NF-kappaB activation and downstream events. FASEB J. 2002;16:237–239. doi: 10.1096/fj.01-0572fje. [DOI] [PubMed] [Google Scholar]
- Walker MJ, Barnett TC, McArthur JD, Cole JN, Gillen CM, Henningham A, et al. Disease manifestations and pathogenic mechanisms of group a Streptococcus. Clin Microbiol Rev. 2014;27:264–301. doi: 10.1128/CMR.00101-13. [DOI] [PMC free article] [PubMed] [Google Scholar]
- Wang Y, Kim NS, Haince JF, Kang HC, David KK, Andrabi SA, et al. Poly(ADP-ribose) (PAR) binding to apoptosis-inducing factor is critical for PAR polymerase-1-dependent cell death (parthanatos) Science signaling. 2011;4:ra20. doi: 10.1126/scisignal.2000902. [DOI] [PMC free article] [PubMed] [Google Scholar]
- Weerasinghe P, Buja LM. Oncosis: An important non-apoptotic mode of cell death. Experimental and Molecular Pathology. 2012;93:302–308. doi: 10.1016/j.yexmp.2012.09.018. [DOI] [PubMed] [Google Scholar]
- Yang WS, Park SO, Yoon AR, Yoo JY, Kim MK, Yun CO, Kim CW. Suicide cancer gene therapy using pore-forming toxin, streptolysin O. Molecular cancer therapeutics. 2006;5:1610–1619. doi: 10.1158/1535-7163.MCT-05-0515. [DOI] [PubMed] [Google Scholar]
- Yu Z, Kuncewicz T, Dubinsky WP, Kone BC. Nitric oxide-dependent negative feedback of PARP-1 trans-activation of the inducible nitric-oxide synthase gene. J Biol Chem. 2006;281:9101–9109. doi: 10.1074/jbc.M511049200. [DOI] [PubMed] [Google Scholar]
- Yuan J, Adamski R, Chen J. Focus on histone variant H2AX: to be or not to be. FEBS letters. 2010;584:3717–3724. doi: 10.1016/j.febslet.2010.05.021. [DOI] [PMC free article] [PubMed] [Google Scholar]
- Zerfaoui M, Errami Y, Naura AS, Suzuki Y, Kim H, Ju J, et al. Poly(ADP-ribose) polymerase-1 is a determining factor in Crm1-mediated nuclear export and retention of p65 NF-kappa B upon TLR4 stimulation. Journal of immunology. 2010;185:1894–1902. doi: 10.4049/jimmunol.1000646. [DOI] [PMC free article] [PubMed] [Google Scholar]
- Zhang S, Lin Y, Kim YS, Hande MP, Liu ZG, Shen HM. c-Jun N-terminal kinase mediates hydrogen peroxide-induced cell death via sustained poly(ADP-ribose) polymerase-1 activation. Cell death and differentiation. 2007;14:1001–1010. doi: 10.1038/sj.cdd.4402088. [DOI] [PubMed] [Google Scholar]
- Zhang T, Berrocal JG, Yao J, DuMond ME, Krishnakumar R, Ruhl DD, et al. Regulation of poly(ADP-ribose) polymerase-1-dependent gene expression through promoter-directed recruitment of a nuclear NAD+ synthase. J Biol Chem. 2012;287:12405–12416. doi: 10.1074/jbc.M111.304469. [DOI] [PMC free article] [PubMed] [Google Scholar]
Associated Data
This section collects any data citations, data availability statements, or supplementary materials included in this article.
Supplementary Materials
Supplemental Figure 1. Similar PAR patterns occur in A549 cells. Western blot analysis of A549 cells show PARylation patterns similar to HeLa cells. Epithelial cells were infected with theindicated strains for 3 hours at an OD of 0.3. Migration of molecular weights shown on the left. Images are representative of at least 3 independent experiments.
Supplemental Figure 2. Extensive DNA damage does not occur during an infection. (A) Western blot analysis of post infection lysates using an antibody that recognizes phosphorylated H2AX (gamma H2AX). (B) Agarose gel electrophoresis of DNA extracted from Hela cells after an infection with indicated strains or treated with 1 uM staurosporine for 5 hours. Arrows indicate the DNA size. Images are representative of three independent experiments.
Supplemental Figure 3. SPN is translocated to the cytosol and not the nucleus. Western blot analysis of fractionated A549 cells indicates SPN co-localizes with cytoplasmic proteins. Fractionation was performed using the Sigma Nuclei EZ Prep (Zerfaoui et al., 2010 N3408) protocol. Lane 1 contains total lysates from cells infected with NADase + SPN strain. Lane 2 and 3 are cytoplasmic fractions from the indicated infections and lanes 4, 5, and 6 are nuclear fractions from indicated cells. GAPDH antibody was used as a cytoplasmic control and HDAC antibody was used as a nuclear control. Western blots are representative of at least 2 independent experiments.
Supplemental Figure 4. AIF is not translocated into the nucleus during an infection with S. pyogenes. Immunofluorescence of AIF was performed after a 5 hour infection with indicated strains. Nucleus is stained with DAPI (blue) and AIF in (green). Images are representative of at least 3 independent experiments.
Supplemental Figure 5. PARP inhibitor PJ34 does not inhibit the NADase activity of SPN. (A) Overnight supernatants of NADase + and − strains were serially diluted in 50 mM potassium phosphate pH 7.4 with or without 25 μM of PJ34. NAD+ was added at a 1mM concentration and incubated for 1.5 hours at 37°C. The reactions were terminated with 100 ml 5 M NaOH and incubated an additional one hour. The concentration of remaining uncleaved NAD+ in each reaction was determined by spectrofluorimetry (380 nm absorbance, 455 nm emission). (B) Translocation of HA tagged SPN into cytosols after an infection with indicated strains. HeLa cells were treated with 25 μM PJ34 overnight and during infection and compared to cells treated overnight but not during the infection. (C) Western blot analysis of PAR on PJ34 treated HeLa cell lysates after an infection with ΔSPN or treatment with 1μM staurosporine. Concentrations of PJ34 are indicated above the blot.
Table S1. RT- PCR primers used in this study.