

Abstract
Heparan sulfate proteoglycans have been shown to modulate podocyte adhesion to- and pedicel organization on- the glomerular basement membrane. Recent studies showed that foot process effacement developed in a mutant mouse model whose podocytes were unable to assemble heparan sulfate glycosaminoglycan chains. This study, a further refinement, explored the role of heparan N-sulfation on podocyte behavior. A novel mutant mouse (Ndst1-/-) was developed, having podocyte-specific deletion of NDST1, the enzyme responsible for N-sulfation of heparan sulfate chains. Podocytes having this mutation had foot process effacement and abnormal adhesion to Bowman's capsule. Although glomerular hypertrophy did develop in the kidneys of mutant animals, mesangial expansion was not seen. The lack of heparan N-sulfation did not affect the expression of agrin or perlecan proteoglycan core proteins. Loss of N-sulfation did not result in significant proteinuria, but the increase in the albumin/creatinine ratio was coincident with the development of the enlarged lysosomes in the proximal tubules. Thus, although the renal phenotype of the Ndst1-/- mouse is mild, the data show that heparan chain N-sulfation plays a key role in podocyte organization.
Introduction
The glomerular basement membrane (GBM) is unique in its organization, having a trilaminar structure formed by the fusion of basement membranes of the glomerular endothelium and the podocytes1, 2. It is comprised of a specific arrangement of basement membrane components: collagen IV, laminins, and sulfated proteoglycans3. The presence of heparan sulfate (HS) proteoglycans (HSPG) was first demonstrated by Farquhar and Kanwar via in situ labeling of the GBM anionic sites4. Since that seminal paper, the primary GBM HSPGs have been identified as perlecan, agrin5, and collagen XVIII6. From a historical perspective, one of the known functions of GBM HSPGs is the contribution to the charge and size selectivity of the ultrafiltration barrier via the anionic charge on the glycosaminoglycan (GAG) chains4, 7-9. However, the data from recent molecular genetic approaches from our laboratory10, 11 and the Miner laboratory12, 13 provide evidence that suggest that further evaluation their role in barrier function may be necessary. Work from our laboratory also directed attention to a second, possibly even more important function HSPGs in the glomerulus, the key role that cell surface HSPGs play in regulating of podocyte behavior10, 11.
HSPGs are comprised of a core protein having covalently bound HS (HS glycosaminoglycan (GAG) chains. HS is mainly composed of a repeating disaccharide carbohydrate motif which consists of N-acetylglucosamine (GlcNAc) and glucuronic acid (GlcA)14. HS assembly is highly regulated, the cell utilizing > 30 enzymes for the assembly process15. Elongation of the HS chain (i.e. [GlcNAc-GlcA]n where n = the number of disaccharide repeats) is processive, occuring via the actions of the HS copolymerase enzyme complex16. Subsequent to polymerization, the HS chain undergoes post-assembly modifications, the first modification step is the deacetylation of GlcNac and the subsequent addition of a sulfate group in its place, This reaction is catalyzed by the bifunctional enzyme, N-deacetylase/N-sulfotransferase (NDST1)17. Modifications to HS downstream from the actions of NDST1 include O-sulfation (2-O, 3-O, and 6-O sulfation) at multiple sites on the carbohydrate structure18-20 and C5 epimerization of the carboxyl groups on select glucuronic acids21. Recent work has shown that N-sulfation serves as a prerequisite for the efficient completion of modification reactions downstream from NDST122, 23, i.e. the absence of NDST1 activity has been associated with decrease in the net sulfation of HS24, 25. Although most cell biologists might view sulfated GAG chains as polyanionic moieties which bind to cationic domains on other molecules in a non-specific electrostatic fashion, the impact of changing sulfation patterns along the length of HS has the potential to alter the bioactivity of the HS molecule via the loss of specific, high affinity binding sites for macromolecules26-29.
Previous studies from our laboratory demonstrated that HS chains are important for modulating podocyte cell behavior10, 11, 30. The first study investigated the phenotypic changes in glomeruli of a mutant mouse (PEXTKO) having podocyte-specific deletion for EXT1, the key component of the HS copolymerase complex16. Glomerular podocytes in that model were incapable of HS chain synthesis; a key observation from that study was that the podocytes developed foot process effacement that persisted throughout the entire life of the animal. Subsequent in vitro studies using an immortalized podocyte cell line having the same mutation, shows a decreased ability of podocytes to adhere, spread, and migrate on matrix molecules10. These deficits were identified to be due in part to the altered organization of focal adhesions and their associated cell surface proteoglycans10. Although the PEXTKO model revealed key aspects of the role that cell surface PGs/GAGs play to regulate podocyte phenotypic behavior, in some respects the PEXTKO mouse, represents the most extreme biological consequence of an HS biosynthetic deficiency30.
In this current paper, we report the results of a mutant mouse (NDST1-/- mutant) whose mutation, the in vivo deletion of the NDST1 gene in a podocyte-specific manner, further refines the former model. The podocytes in the NDST1-/- mutant model are capable of assembling the heparan polymer, but unable to N-sulfate HS, leading to a negative influence on the post-assembly GAG modifications downstream from NDST1. The data provide evidence that HS N-sulfation contributes to the maintenance of podocyte structure and function. As a result, the NDST1-/- mutant phenocopies several findings in the PEXTKO model, including foot process effacement, the development of renal tubule damage and, towards the end of their lifespan, a mild microalbuminuria.
Results
Since the 2.5P-Cre transgene is not activated until the capillary loop phase of glomerular development31, nephrogenesis was not affected in this model, the animals being born with the normal Mendelian frequency. Initial light microscopy assessment of renal tissue sections from animals from 3 to 12 months of age showed that there was no significant difference in glomerular structure between the NDST+/+l and NDST1-/- animals.
Kidney sections from animals 3, 6, 9, 12, 15, and 18 months (n=3 male and 3 female animals per time interval) were stained using a PAS/Alcian Blue stain (Figure 1; 6 and 12 months of age shown). There was no apparent different in the morphology between NDST+/+ and NDST1-/- animals at three months of age (data not shown). However, in the NDST1-/- animals at six months of age, tubule dilation (Figure 1B, arrows) and some protein casts were found (Figure 1D arrows). Measurements of glomerular area showed that the NDST1-/- animals developed slight glomerular hypertrophy beginning at 6 months (Figure 1E & F and Figure 2A) which continued through 15 months of age. Mesangial areas were also measured (Figure 2B), and calculating the ratio of Am/Aglom indicated that mesangial expansion did not develop in the glomeruli of NDST1-/- animals compared to control (Figure 2C).
Figure 1. Renal tissue from NDST1+/+ (A,C,E) and NDST1-/- (B,D,F) animals stained using PAS/Alcian Blue.
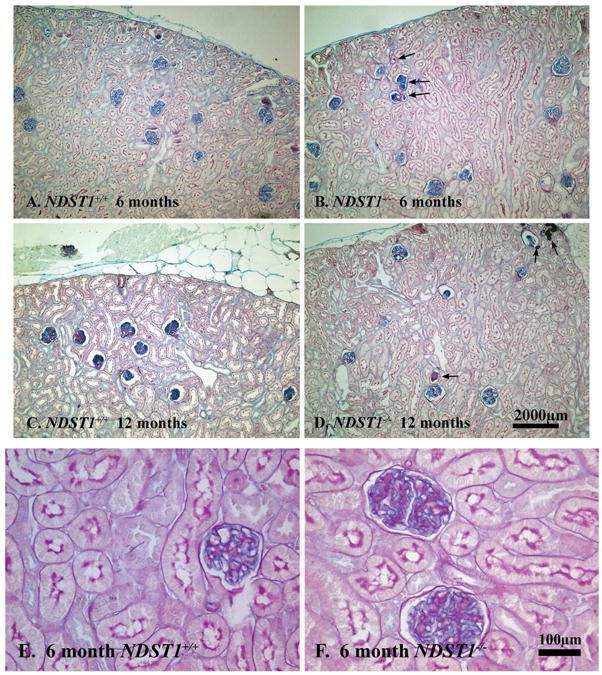
Although renal tissue sections from six month old (Panels A and B) and 12 month old (Panels C and D) NDST1+/+ and NDST1-/- animals had normal glomerular structure and distribution, both the 6 and 12 month old NDST1-/- tissue sections have tubules with protein casts present (arrows) The development of intracytoplasmic vacuoles in the proximal tubule epithelium occurs by 12 months of age, the PAS/Alcian Blue staining does not highlight these changes as well as the hematoxylin and eosin staining in Figure 7. Panels E and F show glomeruli from 6 month old NDST1+/+ and NDST1-/- animals respectively, demonstrating the glomerular hypertrophy that occurs in the NDST1-/- glomeruli. Panels A-D 100× magnification, Panels E-F 400× magnification
Figure 2. Morphometric measurements of glomerular area of NDST1+/+ and NDST1-/- animals at 3, 6, 9, 12, 15, and 18 months.

Glomerular areas (A) and mesangial areas (B) were measured from renal sections stained with a PAS/Alcian Blue. Although glomerular hypertrophy was found in the NDST1-/- glomeruli between 6-15 months of age, significant increases in glomerular areas in the NDST1-/- animals only occurred at 6m months of age (p=0.0002). Mesangial area were increased at 6, 12, and 15 months in the NDST1-/- glomeruli compared to controls, but the increase was only significant at 6 and 15 months (p<0.0001 and p=0.018 respectively). The ratio of mesangial area to glomerular area (C) indicated that mesangial expansion did not occur in this model at any age.
In order to determine if loss of GBM HS N-sulfation had occurred in vivo, tissue sections were double-label immunostained using the phage-display antibody HS4C3 (HS-specific) and monoclonal antibody 10E4, which recognizes N-sulfated regions of HS-GAGs32. The panels in Figure 3 are fluorescent micrographs of glomeruli from NDST1+/+ (Panels A, B, and C) and NDST1-/- (Panels D, E, and F) with the GBMs stained for HS4C3 (Figure 3B, E) and 10E4 (Figure 3A, D). In all panels (arrowheads, A, B, D, & E) the mesangial matrix was immunoreactive (arrowheads) for both antibodies, showing that mesangial cells in both strains make N-sulfated glycosaminoglycans. The basement membranes of the tubule epithelium were also stained in a similar fashion. However, differences in the immunostaining patterns were seen in the glomerular capillary walls. The glomerular capillaries from NDST1-/- animals had positive GBM staining for HS4C3 (Figure 3E, arrows), indicating that there was no loss of heparan chain polymerization activity, but the considerably decreased staining for 10E4 (Figure 3D arrows, cf Figure 3A arrows) indicated that N-sulfation of HS had been significantly affected by the deletion of NDST1.
Figure 3. The glomerular capillaries of NDST1-/- animals show a loss of N-sulfation of heparan sulfate glycosaminoglycan.

Frozen sections from NDST1+/+ (A,B, & C) and NDST1-/- (D,E, & F) animals were immunostained using an HS-specific phage display antibody (HS4C3, red) or a monoclonal antibody (10E4, green) specifically recognizing N-sulfated epitopes on HS chains. The arrows in Panels A, B, D, and E indicate glomerular capillaries in each panel. The arrowheads in each respective panel indicate mesangium staining for the antibodies. A Hoechst 33242 nuclear counterstain was used in the composite micrographs shown in panels C, F. The micrographs show that the NDST1-/- glomeruli are positive for heparan sulfate glycosaminoglycan (Panel E, c.f. NDST1+/+, Panel B) but the overall fluorescence intensity associated with the presence of N-sulfated groups is significantly decreased (D) compared to control (A), the bulk of the 10E4 staining in that glomerulus (D) is associated with the mesangium. Final magnification = 400×.
Frozen tissue sections from 6 and 12 month old animals were immunostained with antibodies against perlecan and agrin (Figure 4-6 months of age shown) to determine if the loss of NDST1 affected the HSPG core protein content of the GBM. The micrographs showed that there was no change in the distribution or intensity in staining of either HSPG core protein in NDST1+/+ NDST1-/- animals.
Figure 4. NDST1-/- animals show normal GBM HSPG core protein expression.

Frozen sections from 6 month old NDST1+/+ (A,C) and NDST1-/- (B,D) animals were immunostained with antibodies against perlecan (Panels A,B) and agrin (Panels C,D) core proteins. The images were taken at the same exposure settings. The images show no difference in fluorescent intensity, suggesting that in the NDST1-/- glomeruli the HSPG core protein composition of the GBM does not appear to be affected. Final magnification = 400×.
Figure 6. GBM anionic charge density is maintained in the glomeruli of NDST1-/- mice.

Transmission electron micrographs of kidneys from 3 month old NDST1+/+ (Panel A) and NDST1-/- (Panel B) animals show glomerular capillaries with the anionic sites labeled with the cationic probe polyethyleneimine. Each arrow in the micrographs indicates one PEI labeled site in the LRE, a visual inspection suggesting no difference in the labeling density of the LRE. Panel C shows the results of quantifying the number of LRE:LRI deposits/500nm of GBM; the LRE and LRI labeling densities (f probability = 0.3957) are comparable between NDST1+/+ (Panel A) and NDST1-/- (Panel B) animals. Although the PEI labeling ratios are similar, foot process effacement was still seen in podocytes from NDST1-/- animals (Figure 6B). Magnification = 30,000×
Transmission electron micrographs showed that the loss of NDST1-/- activity did effect podocyte structure and organization (Figure 5). At 12 months of age, podocytes from NDST1-/- mice had foot process effacement (Figure 5, Panel B), however the degree and extent of effacement was less extensive than that seen in the PEXTKO mouse model11. At 18 months of age, the effacement persisted (Figure 5, Panel D). In some NDST1-/- glomeruli, abnormal podocyte attachment (Figure 5, Panel B, arrows) to Bowman's capsule basement membrane was seen and the presence of apical microvilli on podocytes was seen in all glomeruli of NDST1-/- animals. Focal thickening and irregularities were also found in the glomerular capillaries of the NDST1-/- glomeruli, but overall basement membrane thickness did not appear to be different from that seen in the NDST1+/+ capillaries. Similar findings were reported in the PEXTKO mouse model11, 30.
Figure 5. Podocytes from NDST1-/- mice have abnormal cell-matrix interactions.

Panels A and C are transmission electron micrographs of kidneys from NDST1+/+ animals of 12 and 18 months of age respectively; Panels B and D are micrographs of kidneys from the NDST1-/- animals of the same ages. The podocytes in the NDST1+/+ (Panels A & C, green) have the typical pedicel arrangement seen in normal podocytes. In the NDST1-/- mice (Panels B &D, red) foot process effacement is evident. Moreover, abnormal podocyte attachment (B) to the basement membrane of Bowman's capsule (arrows) was seen in this NDST1-/- glomerulus. Magnification = 2950×
The polycationic probe, polyethylenimine (PEI) was used to determine if the loss of NDST1 had an impact upon the amount or distribution of anionic charge of the GBM. PEI binds to all available anionic sites within a given tissue33. Previous reports have shown that labeling the GBM of wild type animals with PEI, whether by en bloc staining13, 34 or intravenous injection11, 35, results in a labeling ratio of 2:1 of PEI deposits in the lamina rara externa (LRE):lamina rara interna (LRI). The electron micrographs (Figure 6, Panels A, B) are of glomeruli of wild type (A) and NDST1-/- (B) mice that were labeled en bloc with PEI. Panel C shows the result of counting the number of LRE:LRI deposits/500nm of GBM, the data indicating that the LRE:LRI ratio is maintained in both wild-type and mutant animals. Despite the fact that the PEI labeling ratios are similar (f probability = 0.3957) between the two groups, foot process effacement was still found in podocytes in all glomeruli examined from NDST1-/- animals (Figure 6B), suggesting that the presence of N-sulfated groups along the length of HS may be important in mediating podocyte-matrix interactions.
H&E stained sections of kidneys from NDST1-/- animals 9 months of age (Figure 7B & B′, Supplemental Figure 2D) showed the development of large, clear intracytoplasmic vacuoles within the proximal tubule epithelium, the presence of similarly appearing vacuoles in tissue sections from NDST1+/+ of comparable age was not seen (Figure 7A & A′, Supplemental Figure 2C). At 12 months of age, there was an ostensible increase in the presence of the intracytoplasmic vacuoles in tissue sections from NDST1-/- animals (Figure 7D & D′, Supplemental Figure 2F), albeit in the NDST1+/+ animals of the same age (Figure 7C & C′, Supplemental Figure 2E) the development of a relatively minor amount intracytoplasmic vacuolation was observed in a few tubules in each animal. At 15 months of age, intracytoplasmic vesicles were seen in the tubule epithelium from both NDST1+/+ and NDST1-/ animals (Figure 7E and E′; 7F & F′ respectively). Electron micrographs of NDST1+/+ and NDST1-/- proximal tubule epithelium show these vacuoles to be osmophilic in nature, the morphology consistent with that described of small (Figure 7G) and large (Figure 7H) lysosomes36. Staining frozen tissue sections from kidneys of 15 month old NDST1+/+ and NDST1-/- mice (Supplemental Data Figure 2A & B respectively) demonstrated that the smaller vacuoles present within the tubule epithelium stained positive for Oil Red O, but the larger vacuoles were essentially unreactive, suggesting that the bulk of the content of the latter vesicles was material other than lipid. In the PEXTKO animal the onset of development of these vacuoles was seen earlier in life, noted first at 6 months of age11.
Figure 7. Changes in the morphology of the proximal tubule epithelium are seen in the NDST1-/- animals at 9, 12 and 15 months of age.

Light Micrographs of hematoxylin and eosin stained tissue sections of kidney from NDST1+/+ (Panels A & A′ C & C′, E & E′,) and NDST1-/- (Panels B & B′, D &, D′, F & F′) show the gradual development of vacuoles within the epithelium of the proximal tubule cells, the presence of the vacuoles seen first at 9 months of age (B & B′). Vacuolated epithelial cells are seen in the proximal tubules of NDST1+/+ kidneys at 12 and 15 months of age, but to a lesser extent compared to kidneys from NDST1-/- kidneys at the same age. Panels G and H are transmission electron micrographs of tubular epithelial cells from 12 month NDST1+/+ (G) and NDST1-/- (H) kidneys. The epithelial cells of the proximal tubules of the NDST1-/- kidneys have prominent large, lysosomes having an apical location within the epithelium. Supplemental Figure 2 shows representative 0.5μm thick tissue sections stained with toluidine blue that demonstrate the relative abundance of the lysosomes within the epithelium. Final magnification Panels A, B, C, D, E, F 100×; Panels A′, B′, C′, D′, E′ 400×; Final magnification Panels G = 1650× and H = 1200×.
There was no significant difference in urinary albumin excretion in animals at 12 months of age (Figure 8A). By 18 months of age the NDST1-/- mice had increased urinary albumin excretion (Figure 8B) with a mean value of 16.5 μg/dl (p=0.01 from control) with an albumin to creatinine ratio (ACR) of 33.13 (p=0.004 from control) as compared to the control animals with mean urinary albumin levels of 1.5 μg/dl and an ACR of 2.63. This is still below the urinary albumin levels considered to be in the range of albuminuria for mice37. The data would suggest that the NDST1-/- mice were predisposed to the development of age-related proteinuria. Data from the PEXTKO mouse model showed a similar trend towards the gradual development of microalbuminuria over time11.
Figure 8. NDST1-/- animals develop a gradual microalbumuria.

Panel A shows a silver stained gel of urinary proteins from equal amounts of spot urine samples from age-matched (12,15, and 18 months) NDST1+/+ and NDST1-/- animals. The staining shows an increase in protein excretion from the NDST1-/- animals compared to controls at 15 and 18 months. Urinalysis revealed a corresponding increase in urinary albumin, with the greatest amount found in animals of 18 months of age. (B) Urinary albumin measurements in acute urine samples taken from animals of 12, 15 and 18 months of age. (C) Urinary creatinine measurements from the same samples. The ratio of urinary albumin/creatinine ratio (ACR) is shown in graph (D); an increase in ACR for NDST1-/- compared to control is seen at all time points, although a significant difference is not reached until 18 months of age, those levels do not reach the level of what is considered to be albuminuric.
Discussion
NDST1 is an enzyme in the heparan sulfate biosynthetic pathway whose function has been shown to be key and critical in embryonic development of the lungs, craniofacial region, vascular system, skeletal system, and the lens38-41. A global loss of NDST1 results in severe cerebral hypoplasia as well as craniofacial and respiratory defects, with animals dying perinatally42, 43. The skull defects seen in the NDST1 knockout mouse model mimic the phenotypes seen in mouse models deficient in Wnt-1, sonic hedgehog, chordin and noggin44. Most of these findings can be attributed to the important role that the sulfation motifs on HS play in binding growth factors and morphogens. In this context, HS serve as the co-receptors for growth factors that ultimately initiate signaling cascades involved in development and growth. Another function in this context is that HS assists in organizing morphogen gradients during development45. The common denominator in these processes is the presence of sulfate groups in key positions along the length of HS. Sulfation in HS occurs in clusters, referred to as S domains, their presence is determined by the activity of the NDST1 enzymes46, 47. S-domains are known to serve as high affinity binding sites for ligands, mediating the cells interaction with growth factors, morphogens, other receptors and extracellular matrix components47-49.
In this present report, the observations from the NDST1-/- mutant mouse model serve to reiterate that the bioactivity of HS is not entirely the result of non-specific electrostatic intermolecular interactions, but as in some circumstances, e.g. the antithrombin III binding site in HS50, 51, this function is due to the specific organization of sulfate residues within the GAG carbohydrate structure. The 10E4 antibody immunolabeling studies indicate that podocytes from the NDST1-/- animals are unable to modify the nascent HS chain via N-sulfation. Yet the results of the PEI labeling studies show that retention of the LRE anionic sites of the GBM still persists in this model. In reports exploring the impact of NDST1 loss in other organ systems, the 2O-, 3O-, and 6O-sulfation of HS persisted, albeit the extent of these modifications was shown to be significantly diminished25, 39. Furthermore, the results of in vitro studies on immortalized NDST1-/- podocytes show that other sulfation events along the HS-GAG chain still persist despite the targeted loss of NDST1 (Sugar et al., FASEB J. 26:906, 2012, manuscript in preparation). Thus, one would anticipate that these residual sulfate groups would allow for the maintenance of some degree of anionic charge. In addition, one must also consider the fact that HS anionic charge is not the sole result of sulfation, for there is the contribution of negatively charged carboxyl groups resident within the copolymeric repeating structure of HS. Studies by Bertolatus and Hunsicker52 demonstrated that carboxyl groups of molecular components of the GBM do contribute to the non-specific anionic charge of the GBM. Thus the PEI localization in this present study and in previous studies could be due to the summation of the anionic charge contribution from sulfate and carboxyl groups. Conceptually speaking, the latter observations would therefore fit both our models of podocyte GAG insufficiency. Within the context of the PEXTKO model, PEI labeling is almost entirely absent, and can be explained by the elimination of both carboxyl and sulfate groups, thus abolishing all anionic charge in the LRE11. In this current model, undersulfated GAG chains with their carboxyl groups would be synthesized, thus maintaining sufficient anionic charge to facilitate binding the cationic probe PEI. The fact that foot process effacement is found to some extent in the NDST1-/- mouse, strongly suggests that podocyte-matrix interactions are not solely mediated by non-specific anionic charge. In vitro cell-matrix adhesion studies using immortalized NDST1-/- podocytes serve to further highlight this point, those studies showing that immortalized NDST1-/- podocytes are compromised in their ability to attach, spread and migrate on a matrix substrate (Sugar et al., ibid, manuscript in preparation). Thus, these observations would also move cell-surface GAG/matrix interactions from the realm of the non-specific electrostatic intermolecular interactions into events mediated by sulfate pattern specificity involving the presence of N-sulfated residues along the length of HS.
Since sulfated GAGs are always assembled biosynthetically on proteoglycan core proteins, as with the PEXTKO model11 it is most likely that in the NDST1-/- model the changes in cell morphology would be mediated via the cell surface proteoglycans, mainly those of the syndecan family. The syndecans act together with integrins as co-receptors for focal adhesion formation, the coordinated signaling output from which play a role in Rho pathway activation53, 54. Signaling from the Rho pathway is involved in the regulation of the actin cytoskeleton, which has been shown to be critical for the unique pedicle organization of the podocyte55. Syndecan-4 has been shown to be a key regulator of the actin network, through its ability to directly bind and activate PKCα and FAK, and target α-actinin to focal adhesions56-58. Since the HS serves as the bridging moiety between the HS core proteins and their extracellular matrix ligands, any alteration in the ligand-binding ability of the HS chains has the potential to affect cell surface proteoglycan engagement leading to alterations in podocyte pedicel organization and the development of foot process effacement10, 11, 30.
Although the podocytes in the NDST1-/- mouse and the PEXTKO mouse develop a degree of foot process effacement, the data also demonstrate that the mutations in both models of GAG insufficiency are not catastrophic, especially when compared to the functional deficits seen in podocyte-specific models of integrin deletion59, 60 or deletion of elements of the integrin signaling pathway61-63. The development of proteinuria in the latter models was reported to be extremely aggressive/fulminant, the net result of which overwhelmed the protein scavenging capacity of the downstream elements of the nephron. Ultimately, the animals having those mutations die very early in life from the consequences of renal failure. The glomerular dysfunction caused by the mutations in the NDST1-/- and the PEXTKO mice is relatively mild, as demonstrated by the mild microalbuminuria/proteinuria that gradually develops over the lifespan of the animals. Although the animals do develop changes in podocyte morphology that has been associated with proteinuric states, the changes appear not as extreme or as extensive as what is seen in animals whose mutations/deletions center around integrins. The amount of albumin/protein that is delivered to the proximal tubule system in both the PEXTKO and NDST1-/- models could very well be within the capacity of the proximal tubule system to functionally adapt to enhanced scavenging of a relatively modest increase of albumin/protein concentrations in the ultrafiltrate. We can further speculate that despite the early adaptive response in the proximal tubules, the albuminuria/proteinuria that does gradually develop over time in both strains could be the result of failure/decompensation of some aspect scavenging process, the morphologic correlate of this observation is the appearance and persistence of large lysosomes over time in the NDST1-/- mouse and the PEXTKO mouse30.
Research from the last millennium established that in animal models of diabetes and in human specimens, significant changes in the glomerular basement membrane and/or their constituent molecules occur64. It is well known that GBM thickening is an early observation in the disease process65, 66 and correspondingly, a concurrent increase of GBM matrix molecules has been reported67, 68 Other studies reported a loss of sulfate incorporation into GBM HS in diabetic animals69, 70. Still other reports noted loss of anionic sites in the GBM71 and at the podocyte cell surface72. An initial interpretation of those results led to the belief that diabetes mellitus led to an overall loss of proteoglycans73, 74 but the results of other studies suggested that the level of proteoglycan core proteins remains the same, the manifestation of the disease being a loss of sulfate incorporated into the GAG chains75, 76. Based on those studies, it became widely accepted that the loss of proteoglycan sulfation has been associated with the gradual demise of glomerular function, but from the perspective that GBM charge selective function was accordingly diminished. The power of the NDST1-/- model is that it recapitulates one known effect of the diabetic milieu in the absence of confounding factors in cell physiology that are known to be evoked in diabetes mellitus, such as non-enzymatic glycation, oxidative stress, etc. Albeit the GBM charge selectivity plays a role in ultrafiltration, the results of this present report and our previous work in the PEXTKO model indicate that a more direct effect on podocyte organization and potentially podocyte homeostasis is mediated by loss of HS and/or HS sulfation, via the alteration of podocyte-GBM interactions.
Methods
Animals and animal care
Mice were housed in the LSU Health Sciences Center Animal Resource Facility, an AAALAC approved facility. All animal experimentation was carried out under an approved protocol by the LSUHSC-S IACUC. Conditions for light and humidity were consistently controlled, and food and water was available ad libitum. The 2.5 P-Cre expressing mice (podocin-Cre+) were a gift from Dr. Lawrence Holzman (University of Pennsylvania School of Medicine, Philadelphia, PA). The Cre recombinase was under control of the podocin (NPHS2 gene) promoter, permitting the expression of Cre recombinase in glomerular podocytes. NDST1fl/fl mice were a gift from Dr. Jeffrey Esko (University of California, San Diego, La Jolla, CA). Animal genotyping was done as described previously77 from tail snips using the REDExtrac-N-Amp™ Tissue PCR Kit (Sigma Chemical Company, St. Louis MO, USA). For detection of the Cre recombinase transgene the PCR primer set was 5′-GCATAACCAGTGAAACAGCATTGCTG-3′ (forward) and 5′-GGACATGTTCAGGGATCGCCAGGCG-3′ (reverse), the cycling parameters previously described77, 78. For the detection of the NDST1 floxed allele the primer set 5′-CCAGGGCGTCAGGGCCTCCTG-3′ (forward) and 5′-TCCCACATGGCGAGACTGAGGTTC-3′ (reverse) was used, the cyling parameters were 95°C 15 min (denature) then 35 cycles of 95°C 55 sec, 57°C 55 sec, 72°C 1 min 30 sec. The resultant amplicons were electrophoresed in agarose gels and detection was done using ethidium bromide (Supplemental Figure 1). The resultant gels were imaged using a gel documentation system (Carestream Molecular Imaging, Rochester, NY).
Routine Histology and Morphometry
Routine light microscopy, including Hematoxylin and Eosin (H&E) stains and periodic acid Schiff (PAS) stains were used to analyze glomerular morphology and hypertrophy. Kidneys were harvested from NDST1+/+ and NDST1-/- animals (3 male and 3 female animals per age group), ages 3, 6, 7, 9, 14, 15, and 18 months. For paraffin embedding, kidneys were fixed in (3.5% formaldehyde in PBS) and subsequently processed for paraffin embedding and sectioning at 4μm as previously described79. For frozen specimens, kidneys were snap frozen by immersion in a solid CO2/2-methylbutane bath and stored at -80°C until needed. Frozen sections were prepared and cut at 4μm as previously described11. To determine if the NDST1-/- animals developed glomerular hypertrophy and/or mesangial expansion, paraffin sections of kidneys from male NDST1+/+ and NDST1-/- mice ages as indicated above were stained using PAS/Alcian Blue pH 2.5. 50 glomeruli per animal, 3 animals per age interval were digitized at a magnification of 400×. A color segmentation subroutine in the iVision software package was use for morphometric measures, the color segmentation allowed for the differentiation of mesangium (blue staining) and the capillary loops (pink staining) respectively. Glomerular and mesangial areas were measured (pixels2) for all glomeruli imaged and mesangial expansion was calculated as the ratio of the mesangial area relative to the total area of the glomerular tuft (Am/At). Statistical differences among the groups were calculated using Students T-test.
Immunostaining/immunofluorescence
Immunostaining was performed as previously described80, tissue sections were stained for perlecan (3 NDST1+/+ and 3 NDST1-/-), agrin (7 NDST1+/+ and 7 NDST1-/- kidneys). To demonstrate the loss of N-sulfation, tissue sections (7 NDST1+/+ and 7NDST1-/- kidneys) were double label immunostained with monoclonal antibody 10E4, which recognizes an N-sulfated epitope present on HS chains, and phage display antibody HS4C3, which recognizes epitopes present on glomerular heparan sulfate glycosaminoglycans. Primary antibodies used were as follows: Anti-Agrin (1:50, K-17:sc-6166; Santa Cruz Biotechnology, Santa Cruz, CA USA); Rat monoclonal anti-perlecan (1:100, clone A7L6, Upstate Biotechnology, Lake Placid, NY, USA); Anti-Heparin Sulfate (1:1, HS4C3 TVK)32; Mouse monoclonal anti N-sulfated GlcNAc (1:50, 10E4, USBio, Boston, MA). Secondary antibodies used in the study were species-specific Cy-2 or Cy-3 conjugated antibodies (Jackson Immunoresearch Laboratories, West Grove, PA USA). For detection of phage display-derived antibodies (HS4C3), a mouse monoclonal antibody recognizing a VSV epitope (clone P5D4, 1:100 dilution, Sigma Chemical Co) was used. For some studies, a Hoechst 33242 nuclear stain was used to demarcate the nuclei in tissue sections.
Electron Microscopy
Kidneys were harvested for routine electron microscopy studies as previously described79. Briefly, kidneys from NDST+/+l and NDST1-/- animals (3 animals/age group) were minced into 1mm2 pieces and fixed overnight in Karnovsky's fixative (2.5% glutaraldehyde, 2% formaldehyde in 0.1M PO4 buffer)81 and then post-fixed in 2% osmium tetroxide in 0.1M PO4 buffer for 1 hour. The osmicated samples were then dehydrated through a series of graded ethanol solutions and then infiltrated with propylene oxide. Subsequently, the tissues were infiltrated with Durcupan ANC Fluka Araldite (Sigma Chemical) and embedded in the same resin. After polymerization, 80nm sections were cut using a Reichert Ultracut E Ultramicrotome (Leica Microsystems, Bannockburn, IL, USA) and the grids subsequently stained with uranyl acetate and lead citrate. The sections were imaged using a Hitachi transmission electron microscope equipped for digital image acquisition.
PEI labeling
Glomerular basement membrane anionic sites (4 NDST1+/+ and 4 NDST1-/- animals) were labeled using polyethyleneimine staining en bloc as described in the literature13. Renal samples were cut into 0.5mm thick slices and incubated in a 0.5% PEI in 0.9% NaCl solution pH 7.3 for 30 minutes. Sample were then washed in 0.1M cacodylate buffer and fixed for one hour using 2.5% gluteraldehyde and 2% phosphotungstic acid in 0.1M cacodylate buffer. The sample slices were then minced into 0.5mm × 0.5mm cubes, washed in cacodylate buffer and post fixed in 1% osmium tetroxide in 0.1M cacodylate buffer for 2 hours. Tissues were processed for electron microscopy as previously described, and imaged using the above TEM. For quantification purposes, the number of PEI deposits/500nm length of GBM were counted from NDST1+/+ and NDST1-/- mice, a total of 120 -500nm segments from each strain were measured. Statistical differences among the groups were calculated using Students T-test.
Urinalysis
Acute urine samples were taken from NDST1+/+ and NDST1-/- animals at 12,15, and 18 months of age (5 animals per group at each time interval) at time of sacrifice. Urinary albumin levels were analyzed using an indirect competitive ELISA according to manufacturer's directions (Albuwell M; Exocell, Philadelphia, PA USA). Urinary creatinine was measured using an alkaline picrate reaction (Creatinine Companion; Exocell, Philadelphia, PA USA). Undiluted concentration levels were quantified using least squares regression curve plotted from albumin standards. The albumin levels were normalized to urinary creatinine levels. Statistical differences among the groups were calculated using Students T-test.
Supplementary Material
Supplementary Figure 1. Figure 1 shows an agarose gel of the results of genotyping Ndst1 heterozygous and homozygous animals. The upper gel shows the bands for PCR products of 250bp (wild type) and 350bp (floxed allele) for Ndst1. The lower gel shows PCR products for the same animals genotyped using primer sets for the 2.5P-Cre transgene (268 bp).
Supplementary Figure 2. Panels A and B are photomicrographs of frozen sections of NDST1+/+ (A) and NDST1-/- (B) kidneys that were stained with Oil Red O. The arrows in each panel point to the vacuoles present in the renal tubule epithelium. Although Oil Red O stains smaller lysosomes within the tissue section, the larger vacuoles are predominantely negative for the staining. Final magnification 400×. Panels C-F are photomicrographs of 0.5μm thick plastic-embedded sections of NDST1+/+ (C & E) and NDST1-/- (D &F) kidneys from animals 9 (C & D) and 12 (E & F) months of age. Panels D &F show the presence of darkly stained lysosomes within the epithelial cells of the proximal tubules.
Acknowledgments
The authors would like to thank Mr. Ronald Austin and Mr. Reed Kaltenbach of the LSUSHC-S Department of Pathology Electron Microscopy Core facility for their assistance with the TEM studies in the project. The authors would also like to thank Manjeri Venkatachalam, M.D. Department of Pathology, University of Texas Health Sciences Center, San Antonio, for his discussions concerning glomerular basement membrane anionic charge and Jeffery Miner, Ph.D. for his discussion/suggestions with regard to the PEI labeling. This manuscript was submitted for partial fulfillment of the requirements for a Ph.D. dissertation (TS)
Funding Sources: This work supported in part from an NIH Grant (NIDDK RO1 DK077860, KJM) and a Predoctoral Research Award (TS) from the Malcolm Feist Institute for Cardiovascular Diseases and Imaging.
Footnotes
Disclosure: None
References
- 1.Abrahamson DR, Perry EW. Evidence for splicing new basement membrane into old during glomerular development in newborn rat kidneys. J Cell Biol. 1986;103:2489–2498. doi: 10.1083/jcb.103.6.2489. [DOI] [PMC free article] [PubMed] [Google Scholar]
- 2.Reeves WH, Kanwar YS, Farquhar MG. Assembly of the glomerular filtration surface. Differentiation of anionic sites in glomerular capillaries of newborn rat kidney. J Cell Biol. 1980;85:735–753. doi: 10.1083/jcb.85.3.735. [DOI] [PMC free article] [PubMed] [Google Scholar]
- 3.Miner JH. The glomerular basement membrane. Exp Cell Res. 2012;318:973–978. doi: 10.1016/j.yexcr.2012.02.031. [DOI] [PMC free article] [PubMed] [Google Scholar]
- 4.Kanwar YS, Farquhar MG. Presence of heparan sulfate in the glomerular basement membrane. Proc Natl Acad Sci U S A. 1979;76:1303–1307. doi: 10.1073/pnas.76.3.1303. [DOI] [PMC free article] [PubMed] [Google Scholar]
- 5.Groffen AJ, Ruegg MA, Dijkman H, et al. Agrin is a major heparan sulfate proteoglycan in the human glomerular basement membrane. J Histochem Cytochem. 1998;46:19–27. doi: 10.1177/002215549804600104. [DOI] [PubMed] [Google Scholar]
- 6.Halfter W, Dong S, Schurer B, et al. Collagen XVIII is a basement membrane heparan sulfate proteoglycan. The Journal of Biological Chemistry. 1998;273:25404–25412. doi: 10.1074/jbc.273.39.25404. [DOI] [PubMed] [Google Scholar]
- 7.Kanwar YS, Farquhar MG. Anionic sites in the glomerular basement membrane. In vivo and in vitro localization to the laminae rarae by cationic probes. J Cell Biol. 1979;81:137–153. doi: 10.1083/jcb.81.1.137. [DOI] [PMC free article] [PubMed] [Google Scholar]
- 8.Rennke HG, Cotran RS, Venkatachalam MA. Role of molecular charge in glomerular permeability. Tracer studies with cationized ferritins. J Cell Biol. 1975;67:638–646. doi: 10.1083/jcb.67.3.638. [DOI] [PMC free article] [PubMed] [Google Scholar]
- 9.Rennke HG, Venkatachalam MA. Glomerular permeability: in vivo tracer studies with polyanionic and polycationic ferritins. Kidney Int. 1977;11:44–53. doi: 10.1038/ki.1977.6. [DOI] [PubMed] [Google Scholar]
- 10.Chen S, Wassenhove-McCarthy D, Yamaguchi Y, et al. Podocytes require the engagement of cell surface heparan sulfate proteoglycans for adhesion to extracellular matrices. Kidney Int. 2010;78:1088–1099. doi: 10.1038/ki.2010.136. [DOI] [PMC free article] [PubMed] [Google Scholar]
- 11.Chen S, Wassenhove-McCarthy DJ, Yamaguchi Y, et al. Loss of heparan sulfate glycosaminoglycan assembly in podocytes does not lead to proteinuria. Kidney Int. 2008;74:289–299. doi: 10.1038/ki.2008.159. [DOI] [PMC free article] [PubMed] [Google Scholar]
- 12.Goldberg S, Harvey SJ, Cunningham J, et al. Glomerular filtration is normal in the absence of both agrin and perlecan-heparan sulfate from the glomerular basement membrane. Nephrol Dial Transplant. 2009;24:2044–2051. doi: 10.1093/ndt/gfn758. [DOI] [PMC free article] [PubMed] [Google Scholar]
- 13.Harvey SJ, Jarad G, Cunningham J, et al. Disruption of glomerular basement membrane charge through podocyte-specific mutation of agrin does not alter glomerular permselectivity. Am J Pathol. 2007;171:139–152. doi: 10.2353/ajpath.2007.061116. [DOI] [PMC free article] [PubMed] [Google Scholar]
- 14.Kjellen L, Lindahl U. Proteoglycans: structures and interactions. Annu Rev Biochem. 1991;60:443–475. doi: 10.1146/annurev.bi.60.070191.002303. [DOI] [PubMed] [Google Scholar]
- 15.Esko JD, Lindahl U. Molecular diversity of heparan sulfate. J Clin Invest. 2001;108:169–173. doi: 10.1172/JCI13530. [DOI] [PMC free article] [PubMed] [Google Scholar]
- 16.Busse M, Kusche-Gullberg M. In vitro polymerization of heparan sulfate backbone by the EXT proteins. The Journal of Biological Chemistry. 2003;278:41333–41337. doi: 10.1074/jbc.M308314200. [DOI] [PubMed] [Google Scholar]
- 17.Kjellen L. Glucosaminyl N-deacetylase/N-sulphotransferases in heparan sulphate biosynthesis and biology. Biochem Soc Trans. 2003;31:340–342. doi: 10.1042/bst0310340. [DOI] [PubMed] [Google Scholar]
- 18.Uchimura K, Fasakhany F, Kadomatsu K, et al. Diversity of N-acetylglucosamine-6-O-sulfotransferases: molecular cloning of a novel enzyme with different distribution and specificities. Biochem Biophys Res Commun. 2000;274:291–296. doi: 10.1006/bbrc.2000.3141. [DOI] [PubMed] [Google Scholar]
- 19.Rong J, Habuchi H, Kimata K, et al. Substrate specificity of the heparan sulfate hexuronic acid 2-O-sulfotransferase. Biochemistry. 2001;40:5548–5555. doi: 10.1021/bi002926p. [DOI] [PubMed] [Google Scholar]
- 20.Shworak NW, Liu J, Petros LM, et al. Multiple isoforms of heparan sulfate D-glucosaminyl 3-O-sulfotransferase. Isolation, characterization, and expression of human cdnas and identification of distinct genomic loci. The Journal of Biological Chemistry. 1999;274:5170–5184. doi: 10.1074/jbc.274.8.5170. [DOI] [PubMed] [Google Scholar]
- 21.Crawford BE, Olson SK, Esko JD, et al. Cloning, Golgi localization, and enzyme activity of the full-length heparin/heparan sulfate-glucuronic acid C5-epimerase. The Journal of Biological Chemistry. 2001;276:21538–21543. doi: 10.1074/jbc.M100880200. [DOI] [PubMed] [Google Scholar]
- 22.Esko JD, Selleck SB. Order out of chaos: assembly of ligand binding sites in heparan sulfate. Annu Rev Biochem. 2002;71:435–471. doi: 10.1146/annurev.biochem.71.110601.135458. [DOI] [PubMed] [Google Scholar]
- 23.Lindahl U, Kusche-Gullberg M, Kjellen L. Regulated diversity of heparan sulfate. The Journal of Biological Chemistry. 1998;273:24979–24982. doi: 10.1074/jbc.273.39.24979. [DOI] [PubMed] [Google Scholar]
- 24.Adhikari N, Basi DL, Townsend D, et al. Heparan sulfate Ndst1 regulates vascular smooth muscle cell proliferation, vessel size and vascular remodeling. J Mol Cell Cardiol. 2010;49:287–293. doi: 10.1016/j.yjmcc.2010.02.022. [DOI] [PMC free article] [PubMed] [Google Scholar]
- 25.Ledin J, Staatz W, Li JP, et al. Heparan sulfate structure in mice with genetically modified heparan sulfate production. The Journal of Biological Chemistry. 2004;279:42732–42741. doi: 10.1074/jbc.M405382200. [DOI] [PubMed] [Google Scholar]
- 26.Jemth P, Kreuger J, Kusche-Gullberg M, et al. Biosynthetic oligosaccharide libraries for identification of protein-binding heparan sulfate motifs. Exploring the structural diversity by screening for fibroblast growth factor (FGF) 1 and FGF2 binding. The Journal of Biological Chemistry. 2002;277:30567–30573. doi: 10.1074/jbc.M203404200. [DOI] [PubMed] [Google Scholar]
- 27.Kreuger J, Salmivirta M, Sturiale L, et al. Sequence analysis of heparan sulfate epitopes with graded affinities for fibroblast growth factors 1 and 2. The Journal of Biological Chemistry. 2001;276:30744–30752. doi: 10.1074/jbc.M102628200. [DOI] [PubMed] [Google Scholar]
- 28.Loo BM, Kreuger J, Jalkanen M, et al. Binding of heparin/heparan sulfate to fibroblast growth factor receptor 4. The Journal of Biological Chemistry. 2001;276:16868–16876. doi: 10.1074/jbc.M011226200. [DOI] [PubMed] [Google Scholar]
- 29.Shworak NW, HajMohammadi S, de Agostini AI, et al. Mice deficient in heparan sulfate 3-O-sulfotransferase-1: normal hemostasis with unexpected perinatal phenotypes. Glycoconj J. 2002;19:355–361. doi: 10.1023/A:1025377206600. [DOI] [PubMed] [Google Scholar]
- 30.McCarthy KJ, Wassenhove-McCarthy DJ. The glomerular basement membrane as a model system to study the bioactivity of heparan sulfate glycosaminoglycans. Microsc Microanal. 2012;18:3–21. doi: 10.1017/S1431927611012682. [DOI] [PMC free article] [PubMed] [Google Scholar]
- 31.Moeller MJ, Sanden SK, Soofi A, et al. Podocyte-specific expression of cre recombinase in transgenic mice. Genesis. 2003;35:39–42. doi: 10.1002/gene.10164. [DOI] [PubMed] [Google Scholar]
- 32.van Kuppevelt TH, Dennissen MA, van Venrooij WJ, et al. Generation and application of type-specific anti-heparan sulfate antibodies using phage display technology. Further evidence for heparan sulfate heterogeneity in the kidney. The Journal of Biological Chemistry. 1998;273:12960–12966. doi: 10.1074/jbc.273.21.12960. [DOI] [PubMed] [Google Scholar]
- 33.Schurer JW, Hoedemaeker J, Molenaar I. Polyethyleneimine as tracer particle for (immuno) electron microscopy. J Histochem Cytochem. 1977;25:384–387. doi: 10.1177/25.5.325123. [DOI] [PubMed] [Google Scholar]
- 34.Schurer JW, Kalicharan D, Hoedemaeker PJ, et al. The use of polyethyleneimine for demonstration of anionic sites in basement membranes and collagen fibrils. J Histochem Cytochem. 1978;26:688–689. doi: 10.1177/26.8.690407. [DOI] [PubMed] [Google Scholar]
- 35.Rada JA, Carlson EC. Electron microscopic histochemical and immunochemical analyses of heparan sulfate proteoglycan distribution in renal glomerular basement membranes. Histol Histopathol. 1991;6:149–160. [PubMed] [Google Scholar]
- 36.Fawcett DW. The Cell. 2nd. W.B. Saunders Company; Philadelphia: 1981. Lysosomes. [Google Scholar]
- 37.Qi Z, Fujita H, Jin J, et al. Characterization of susceptibility of inbred mouse strains to diabetic nephropathy. Diabetes. 2005;54:2628–2637. doi: 10.2337/diabetes.54.9.2628. [DOI] [PubMed] [Google Scholar]
- 38.Abramsson A, Kurup S, Busse M, et al. Defective N-sulfation of heparan sulfate proteoglycans limits PDGF-BB binding and pericyte recruitment in vascular development. Genes Dev. 2007;21:316–331. doi: 10.1101/gad.398207. [DOI] [PMC free article] [PubMed] [Google Scholar]
- 39.Grobe K, Inatani M, Pallerla SR, et al. Cerebral hypoplasia and craniofacial defects in mice lacking heparan sulfate Ndst1 gene function. Development. 2005;132:3777–3786. doi: 10.1242/dev.01935. [DOI] [PMC free article] [PubMed] [Google Scholar]
- 40.Hu Z, Yu M, Hu G. NDST-1 modulates BMPR and PTHrP signaling during endochondral bone formation in a gene knockout model. Bone. 2007;40:1462–1474. doi: 10.1016/j.bone.2007.01.021. [DOI] [PubMed] [Google Scholar]
- 41.Pan Y, Carbe C, Powers A, et al. Bud specific N-sulfation of heparan sulfate regulates Shp2-dependent FGF signaling during lacrimal gland induction. Development. 2008;135:301–310. doi: 10.1242/dev.014829. [DOI] [PubMed] [Google Scholar]
- 42.Fan G, Xiao L, Cheng L, et al. Targeted disruption of NDST-1 gene leads to pulmonary hypoplasia and neonatal respiratory distress in mice. FEBS Lett. 2000;467:7–11. doi: 10.1016/s0014-5793(00)01111-x. [DOI] [PubMed] [Google Scholar]
- 43.Ringvall M, Ledin J, Holmborn K, et al. Defective heparan sulfate biosynthesis and neonatal lethality in mice lacking N-deacetylase/N-sulfotransferase-1. The Journal of Biological Chemistry. 2000;275:25926–25930. doi: 10.1074/jbc.C000359200. [DOI] [PubMed] [Google Scholar]
- 44.Grobe K, Ledin J, Ringvall M, et al. Heparan sulfate and development: differential roles of the N-acetylglucosamine N-deacetylase/N-sulfotransferase isozymes. Biochim Biophys Acta. 2002;1573:209–215. doi: 10.1016/s0304-4165(02)00386-0. [DOI] [PubMed] [Google Scholar]
- 45.Bulow HE, Hobert O. The molecular diversity of glycosaminoglycans shapes animal development. Annu Rev Cell Dev Biol. 2006;22:375–407. doi: 10.1146/annurev.cellbio.22.010605.093433. [DOI] [PubMed] [Google Scholar]
- 46.Murphy KJ, Merry CL, Lyon M, et al. A new model for the domain structure of heparan sulfate based on the novel specificity of K5 lyase. The Journal of Biological Chemistry. 2004;279:27239–27245. doi: 10.1074/jbc.M401774200. [DOI] [PubMed] [Google Scholar]
- 47.Sheng J, Liu R, Xu Y, et al. The dominating role of N-deacetylase/N-sulfotransferase 1 in forming domain structures in heparan sulfate. The Journal of Biological Chemistry. 2011;286:19768–19776. doi: 10.1074/jbc.M111.224311. [DOI] [PMC free article] [PubMed] [Google Scholar]
- 48.Jastrebova N, Vanwildemeersch M, Lindahl U, et al. Heparan sulfate domain organization and sulfation modulate FGF-induced cell signaling. The Journal of Biological Chemistry. 2010;285:26842–26851. doi: 10.1074/jbc.M109.093542. [DOI] [PMC free article] [PubMed] [Google Scholar]
- 49.Kreuger J, Spillmann D, Li JP, et al. Interactions between heparan sulfate and proteins: the concept of specificity. J Cell Biol. 2006;174:323–327. doi: 10.1083/jcb.200604035. [DOI] [PMC free article] [PubMed] [Google Scholar]
- 50.Rosenberg RD, Damus PS. The purification and mechanism of action of human antithrombin-heparin cofactor. The Journal of Biological Chemistry. 1973;248:6490–6505. [PubMed] [Google Scholar]
- 51.Yabe T, Shukla D, Spear PG, et al. Portable sulphotransferase domain determines sequence specificity of heparan sulphate 3-O-sulphotransferases. Biochem J. 2001;359:235–241. doi: 10.1042/0264-6021:3590235. [DOI] [PMC free article] [PubMed] [Google Scholar]
- 52.Bertolatus JA, Hunsicker LG. Polycation binding to glomerular basement membrane. Effect of biochemical modification. Lab Invest. 1987;56:170–179. [PubMed] [Google Scholar]
- 53.Saoncella S, Echtermeyer F, Denhez F, et al. Syndecan-4 signals cooperatively with integrins in a Rho-dependent manner in the assembly of focal adhesions and actin stress fibers. Proc Natl Acad Sci U S A. 1999;96:2805–2810. doi: 10.1073/pnas.96.6.2805. [DOI] [PMC free article] [PubMed] [Google Scholar]
- 54.Woods A, Couchman JR. Syndecan 4 heparan sulfate proteoglycan is a selectively enriched and widespread focal adhesion component. Mol Biol Cell. 1994;5:183–192. doi: 10.1091/mbc.5.2.183. [DOI] [PMC free article] [PubMed] [Google Scholar]
- 55.Mundel P, Shankland SJ. Podocyte biology and response to injury. J Am Soc Nephrol. 2002;13:3005–3015. doi: 10.1097/01.asn.0000039661.06947.fd. [DOI] [PubMed] [Google Scholar]
- 56.Greene DK, Tumova S, Couchman JR, et al. Syndecan-4 associates with alpha-actinin. The Journal of Biological Chemistry. 2003;278:7617–7623. doi: 10.1074/jbc.M207123200. [DOI] [PubMed] [Google Scholar]
- 57.Keum E, Kim Y, Kim J, et al. Syndecan-4 regulates localization, activity and stability of protein kinase C-alpha. Biochem J. 2004;378:1007–1014. doi: 10.1042/BJ20031734. [DOI] [PMC free article] [PubMed] [Google Scholar]
- 58.Wilcox-Adelman SA, Denhez F, Goetinck PF. Syndecan-4 modulates focal adhesion kinase phosphorylation. The Journal of Biological Chemistry. 2002;277:32970–32977. doi: 10.1074/jbc.M201283200. [DOI] [PubMed] [Google Scholar]
- 59.Pozzi A, Jarad G, Moeckel GW, et al. Beta1 integrin expression by podocytes is required to maintain glomerular structural integrity. Dev Biol. 2008;316:288–301. doi: 10.1016/j.ydbio.2008.01.022. [DOI] [PMC free article] [PubMed] [Google Scholar]
- 60.Sachs N, Kreft M, van den Bergh Weerman MA, et al. Kidney failure in mice lacking the tetraspanin CD151. J Cell Biol. 2006;175:33–39. doi: 10.1083/jcb.200603073. [DOI] [PMC free article] [PubMed] [Google Scholar]
- 61.Dai C, Stolz DB, Bastacky SI, et al. Essential role of integrin-linked kinase in podocyte biology: Bridging the integrin and slit diaphragm signaling. J Am Soc Nephrol. 2006;17:2164–2175. doi: 10.1681/ASN.2006010033. [DOI] [PubMed] [Google Scholar]
- 62.El-Aouni C, Herbach N, Blattner SM, et al. Podocyte-specific deletion of integrin-linked kinase results in severe glomerular basement membrane alterations and progressive glomerulosclerosis. J Am Soc Nephrol. 2006;17:1334–1344. doi: 10.1681/ASN.2005090921. [DOI] [PubMed] [Google Scholar]
- 63.Ma H, Togawa A, Soda K, et al. Inhibition of podocyte FAK protects against proteinuria and foot process effacement. J Am Soc Nephrol. 2010;21:1145–1156. doi: 10.1681/ASN.2009090991. [DOI] [PMC free article] [PubMed] [Google Scholar]
- 64.Beisswenger PJ, Spiro RG. Studies on the human glomerular basement membrane. Composition, nature of the carbohydrate units and chemical changes in diabetes mellitus. Diabetes. 1973;22:180–193. doi: 10.2337/diab.22.3.180. [DOI] [PubMed] [Google Scholar]
- 65.Farquhar MG, Hopper J, Moon HD. Dibetic glomerulosclerosis: Electron and light microscopic studies. Am J Pathology. 1959;35:721. [PMC free article] [PubMed] [Google Scholar]
- 66.Lazarow A. Glomerular basement membrane thickening in diabetes. Diabetes. 1967:301. [Google Scholar]
- 67.Cohen MP, Khalifa A. Renal glomerular collagen synthesis in streptozotocin diabetes. Reversal of increased basement membrane synthesis with insulin therapy. Biochim Biophys Acta. 1977;500:395–404. doi: 10.1016/0304-4165(77)90030-7. [DOI] [PubMed] [Google Scholar]
- 68.Grant ME, Harwood R, Willams IF. Proceedings: Increased synthesis of glomerular basement membrane collagen in streptozotocin diabetes. J Physiol. 1976;257:56P–57P. [PubMed] [Google Scholar]
- 69.Brown DM, Klein DJ, Michael AF, et al. 35S-glycosaminoglycan and 35S-glycopeptide metabolism by diabetic glomeruli and aorta. Diabetes. 1982;31:418–425. doi: 10.2337/diab.31.5.418. [DOI] [PubMed] [Google Scholar]
- 70.Cohen MP, Surma ML. [(35)S]sulfate incorporation into glomerular basement membrane glycosaminoglycans is decreased in experimental diabetes. J Lab Clin Med. 1981;98:715–722. [PubMed] [Google Scholar]
- 71.van den Born J, van Kraats A, Bakker M, et al. Reduction of heparan sulphate-associated anionic sites in the glomerular basement membrane of rats with STZ-induced diabetic nephropathy. Diabetologia. 1995;38 doi: 10.1007/BF00422365. [DOI] [PubMed] [Google Scholar]
- 72.Ina K, Kitamura H, Nakamura M, et al. Loss of sulfated carbohydrate from the glomerular podocyte as a cause of albuminuria in experimental diabetic rats: ultrastructural histochemical study. J Diabet Complications. 1991;5:173–175. doi: 10.1016/0891-6632(91)90063-u. [DOI] [PubMed] [Google Scholar]
- 73.Parthasarathy N, Spiro RG. Effect of diabetes on the glycosaminoglycan component of the human glomerular basement membrane. Diabetes. 1982;31:738–741. doi: 10.2337/diab.31.8.738. [DOI] [PubMed] [Google Scholar]
- 74.Rohrbach DH, Wagner CW, Star VL, et al. Reduced synthesis of basement membrane heparan sulfate proteoglycan in streptozotocin-induced diabetic mice. The Journal of Biological Chemistry. 1983;258:11672–11677. [PubMed] [Google Scholar]
- 75.Cohen MP, Klepser H, Wu VY. Undersulfation of glomerular basement membrane heparan sulfate in experimental diabetes and lack of correction with aldose reductase inhibition. Diabetes. 1988;37:1324–1327. doi: 10.2337/diab.37.10.1324. [DOI] [PubMed] [Google Scholar]
- 76.Cohen MP, Surma ML. Effect of diabetes on in vivo metabolism of [35S]-labeled glomerular basement membrane. Diabetes. 1984;33:8–12. doi: 10.2337/diab.33.1.8. [DOI] [PubMed] [Google Scholar]
- 77.Choi Y, Kim S, Lee J, et al. The oligomeric status of syndecan-4 regulates syndecan-4 interaction with alpha-actinin. Eur J Cell Biol. 2008;87:807–815. doi: 10.1016/j.ejcb.2008.04.005. [DOI] [PubMed] [Google Scholar]
- 78.Cushman LJ, Burrows HL, Seasholtz AF, et al. Cre-mediated recombination in the pituitary gland. Genesis. 2000;28:167–174. doi: 10.1002/1526-968x(200011/12)28:3/4<167::aid-gene120>3.0.co;2-n. [DOI] [PubMed] [Google Scholar]
- 79.McCarthy KJ, Abrahamson DR, Bynum KR, et al. Basement membrane-specific chondroitin sulfate proteoglycan is abnormally associated with the glomerular capillary basement membrane of diabetic rats. J Histochem Cytochem. 1994;42:473–484. doi: 10.1177/42.4.8126374. [DOI] [PubMed] [Google Scholar]
- 80.McCarthy KJ, Couchman JR. Basement membrane chondroitin sulfate proteoglycans: localization in adult rat tissues. J Histochem Cytochem. 1990;38:1479–1486. doi: 10.1177/38.10.2401786. [DOI] [PubMed] [Google Scholar]
- 81.Karnovsky M. A formaldehyde-glutaraldehyde fixative of high osmolarity for use in electron microscopy. J Cell Biol. 1965;27:137. [Google Scholar]
Associated Data
This section collects any data citations, data availability statements, or supplementary materials included in this article.
Supplementary Materials
Supplementary Figure 1. Figure 1 shows an agarose gel of the results of genotyping Ndst1 heterozygous and homozygous animals. The upper gel shows the bands for PCR products of 250bp (wild type) and 350bp (floxed allele) for Ndst1. The lower gel shows PCR products for the same animals genotyped using primer sets for the 2.5P-Cre transgene (268 bp).
Supplementary Figure 2. Panels A and B are photomicrographs of frozen sections of NDST1+/+ (A) and NDST1-/- (B) kidneys that were stained with Oil Red O. The arrows in each panel point to the vacuoles present in the renal tubule epithelium. Although Oil Red O stains smaller lysosomes within the tissue section, the larger vacuoles are predominantely negative for the staining. Final magnification 400×. Panels C-F are photomicrographs of 0.5μm thick plastic-embedded sections of NDST1+/+ (C & E) and NDST1-/- (D &F) kidneys from animals 9 (C & D) and 12 (E & F) months of age. Panels D &F show the presence of darkly stained lysosomes within the epithelial cells of the proximal tubules.